Fluorescent selectivity for small molecules of three Zn-MOFs with different topologies based on a tetracarboxylate ligand†
Jie Yangb,
Liangliang Zhanga,
Xiaoqing Wangb,
Rongming Wanga,
Fangna Dai*a and
Daofeng Sun*a
aState Key Laboratory of Heavy Oil Processing, China University of Petroleum (East China), College of Science, China University of Petroleum (East China), Qingdao, Shandong 266580, P. R. China. E-mail: fndai@upc.edu.cn; dfsun@upc.edu.cn
bKey Lab of Colloid and Interface Chemistry, Ministry of Education School of Chemistry and Chemical Engineering, Shandong University, Jinan, Shandong 250100, P. R. China
First published on 16th July 2015
Abstract
Three new metal–organic frameworks (MOFs) constructed from terphenyl-3,3′′,5,5′′-tetracarboxylic acid (H4ptptc) and zinc nitrate, [Zn2(ptptc)(DMF)3]·4H2O·5.5DMF (1), [Zn2(ptptc)(DMA)(H2O)]·2.5H2O·3.5DMA (2) and [Zn(ptptc)0.5(H2O)]·DMF·DMA (3), have been obtained and characterized. All the complexes exhibit 3D 4-connected networks with different topologies involving diamond (dia, for 1), lonsdaleite (lon, for 2) and Nbo (for 3), which emanate from the different reaction solvents (DMF, DMA and mixture of DMF/DMA (1![[thin space (1/6-em)]](https://www.rsc.org/images/entities/char_2009.gif) :
:![[thin space (1/6-em)]](https://www.rsc.org/images/entities/char_2009.gif) 1), respectively). The results of photoluminescence properties show that the three complexes can be act as potential luminescent probes or sensors for detecting small organic molecules and toxic substances.
1), respectively). The results of photoluminescence properties show that the three complexes can be act as potential luminescent probes or sensors for detecting small organic molecules and toxic substances.
Introduction
In recent years, the rapid inflation of research efforts related to metal–organic frameworks (MOFs) is ascribed to their interesting topologies and high potential applications in gas adsorption and separation, heterogeneous catalysis, magnetism optical materials and so on.1–4 It is well known that different building blocks can be self-assembled into infinite arrays, however, the same building blocks also can generate different structures under multiple external elements such as the reaction solvent, pH value, system temperature, and so on.5–7 Tiny changes of system temperature and pH values can lead to different topologies. For example, two novel temperature-dependent supramolecular stereoisomers of copper coordination networks (pts and NbO) have been reported by Zhou and coworkers.8 Three different structural MOFs (MIL-118, MIL-119 and MIL-120)9 were obtained in the different pH values due that pH value could lead to different deprotonated degrees of ligand. In addition to the system temperature and pH value, solvent effect often plays another important factor on the assembly of reported MOFs. Tzeng group reported three CdII-networks (1D, 2D, and 3D) based on S-spaced-4,4′-bipyridine ligand using the solvent as ligand.10 When put the solvent as guest, two pts and lvt topologies were also obtained via the reaction of 2,5-bis(pyrazine)-1,3,4-oxadiazole (bpzo) ligand and AgBF4.11 Therefore, understanding the influential factors of the coordinated structures is very important as it could regulate and control the characteristics of MOFs. On the other hand, environmental issues such as industrial pollution, exhaust emission and pesticide residue become the hot topics attracting lots of public attention.12 The traditional selective recognition of such small molecules needs expensive instruments and multiple spectrometry as well as intricate characterization approaches.13 It is an urgent to discover series of materials for selectively recognizing the toxic substances in the environment. There into, according to the reported results, MOF is one of the competitive materials for detecting small molecules, which is considered to be more inexpensive, simplicity and efficient.14In this paper, we choose terphenyl-3,3′′,5,5′′-tetracarboxylic acid (H4ptptc) as organic linker for building MOFs based on the reasons as follows: (i) four potential coordination groups and the rigid terphenyl in the tetracarboxylate ligand can afford more coordination opportunities to form diverse structures. (ii) The ligand possesses delocalized π-electron system, which can provide an intense absorbing photosensitizer. (iii) It is favor to form the structures with high symmetry. Herein, three 3D Zn-MOFs: [Zn2(ptptc)(DMF)3]·4H2O·5.5DMF (1), [Zn2(ptptc)(DMA) (H2O)]·2.5H2O·3.5DMA (2) and [Zn(ptptc)0.5(H2O)]·DMF·DMA (3) have been obtained through the solvothermal reactions of H4ptptc and Zn(II) ion in the different solvents (DMF, DMA and mixture of DMF/DMA (1![[thin space (1/6-em)]](https://www.rsc.org/images/entities/char_2009.gif) :
:![[thin space (1/6-em)]](https://www.rsc.org/images/entities/char_2009.gif) 1), respectively). Complexes 1–3 are 4-connected 3D networks with diverse topological structures, which are highly dependent on their reaction solvents. The luminescent properties of complexes 1–3 are measured, and such solvent-dependent luminescence properties are of interest for the sensing of solvent molecules.
1), respectively). Complexes 1–3 are 4-connected 3D networks with diverse topological structures, which are highly dependent on their reaction solvents. The luminescent properties of complexes 1–3 are measured, and such solvent-dependent luminescence properties are of interest for the sensing of solvent molecules.
Results and discussion
Crystal structure
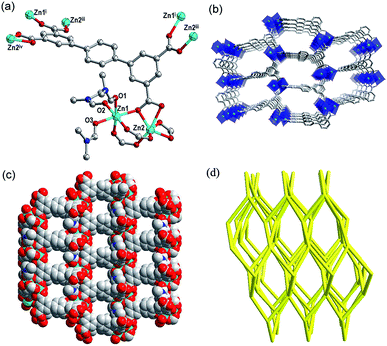
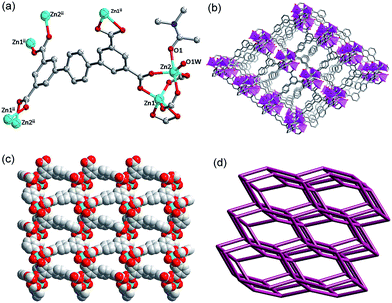
X-ray single-crystal diffraction reveals that complex 1 crystallizes in the orthorhombic space group Pna21, and there are two Zn(II) ions, one ptptc4− ligand and three coordinated DMF molecules in its asymmetric unit. As shown in Fig. 1a, Zn1 displays a distorted octahedral geometry coordinated by three O atoms from three ptptc4− ligands and three O atoms from three coordinated DMF molecules. Zn2 presents the same configuration to Zn1, while the difference is that it is coordinated by six O atoms from four different ligands. The carboxylate groups of ligand adopt three coordination modes: μ1-η1:η1, μ2-η2:η1 and μ2-η1:η1. The distance of Zn1⋯Zn2 is 3.348 Å and the bond length range of Zn–O is 1.975 (4)–2.422 (4) Å. Viewed from Fig. 1b and c, each binuclear cluster is connected by the backbones of four ptptc4− ligands to generate a 3D open framework. The diagonals of 1D square channel in the 3D framework are about 9.4 Å × 10.3 Å along b axis. The calculation of void volume that excluding lattice solvent molecules is 38.9% through the PLATON15 software. The 3D framework can be clarified as a 4-connected 66-dia network by considering binuclear cluster and ptptc4− ligand as the 4-connected nodes through the analysis of the TOPOS16 software, which have been reported in previous literatures.17 The topology expression is 4/6/c1 (sqc6), and the intricate symbol is [6(2)·6(2)·6(2)·6(2)·6(2)·6(2)] (Fig. 1d).Complex 2 crystallizes in the monoclinic space group P21, and the asymmetric unit contains two Zn2+ ions, one ptptc4− ligand, one coordinated DMA molecule and one coordinated water molecule. As displayed in Fig. 2a, Zn1 is surrounded by five O atoms from four different ptptc4− ligands to perform a distorted trigonal bipyramidal geometry, Zn2 is also five-coordinated displayed the same geometry, while it is coordinated by one DMA molecule, one water molecule. The carboxylate groups of ptptc4− ligand in 2 adopt two coordination modes: μ1-η1:η1 and μ2-η1:η1), the distance of Zn1⋯Zn2 is 3.433 Å and the Zn–O bond length range is from 1.945 (3) to 2.390 (3) Å. Each ligand connects four Zn2(COO)4 SBUs, and each SBU attaches four ptptc4− ligands, generating a 3D opens network with triangle channels along a axis (Fig. 2b and c). The void volume after removal of the solvates is 53.9%. Furthermore, Zn-SBU and ptptc4− ligand are 4-connected nodes and both of them connect with each other to form a 66-lon (4/6/h2) network, and the Schläfli symbol is [6(2).6(2).6(2).6(2).6(2).6(2)] calculated through the analysis of the topology program18 (Fig. 2d).
Complex 3 crystallizes in the trigonal crystal system with R![[3 with combining macron]](https://www.rsc.org/images/entities/char_0033_0304.gif) m space group by analyzing the crystal data. In the asymmetric unit of 3, there are one Zn2+ ion, half of ptptc4− ligand and one water molecule. Each zinc ion is five-coordinated with tetragonal pyramid geometry constructed by four O atoms from four different ptptc4− ligands and O1w from coordinated water molecules (see Fig. 3a). Two zinc ions are bonded by four carboxylate groups adopting a bidentate bridging mode to form the classic Zn(II) paddlewheel secondary building unit (SBU) with a Zn⋯Zn distance of 2.98 Å. The [Zn2(CO2)4] unit is bridged by four ptptc4− ligands to form a porous framework. The distance of Zn–O1w is 1.977 Å, and the average Zn–Optptc4− bond distance is 2.023 Å, which are all within the bond length range of Cu(Zn)-paddlewheel complexes.19 As exhibited in Fig. 3b, there are two types of organometallic cages along the c axis. One type of cage is composed of six Zn2(COO)4(H2O) SBUs, the other one consists of twelve Zn2(COO)4(H2O) SBUs, and their diameters are about 5.3 and 9.2 Å, respectively. The total volume is 67.8% for 3, as obtained by PLATON routine. The TOPOS16 software illustrates that 3 is a 64·82 NbO-type (4/6/c2, sqc35) topological structure constructed by organic ligands and Zn-SBUs, and the symbol is [6(2)·6(2)·6(2)·6(2)·8(2)·8(2)] (Fig. 3c).
m space group by analyzing the crystal data. In the asymmetric unit of 3, there are one Zn2+ ion, half of ptptc4− ligand and one water molecule. Each zinc ion is five-coordinated with tetragonal pyramid geometry constructed by four O atoms from four different ptptc4− ligands and O1w from coordinated water molecules (see Fig. 3a). Two zinc ions are bonded by four carboxylate groups adopting a bidentate bridging mode to form the classic Zn(II) paddlewheel secondary building unit (SBU) with a Zn⋯Zn distance of 2.98 Å. The [Zn2(CO2)4] unit is bridged by four ptptc4− ligands to form a porous framework. The distance of Zn–O1w is 1.977 Å, and the average Zn–Optptc4− bond distance is 2.023 Å, which are all within the bond length range of Cu(Zn)-paddlewheel complexes.19 As exhibited in Fig. 3b, there are two types of organometallic cages along the c axis. One type of cage is composed of six Zn2(COO)4(H2O) SBUs, the other one consists of twelve Zn2(COO)4(H2O) SBUs, and their diameters are about 5.3 and 9.2 Å, respectively. The total volume is 67.8% for 3, as obtained by PLATON routine. The TOPOS16 software illustrates that 3 is a 64·82 NbO-type (4/6/c2, sqc35) topological structure constructed by organic ligands and Zn-SBUs, and the symbol is [6(2)·6(2)·6(2)·6(2)·8(2)·8(2)] (Fig. 3c).
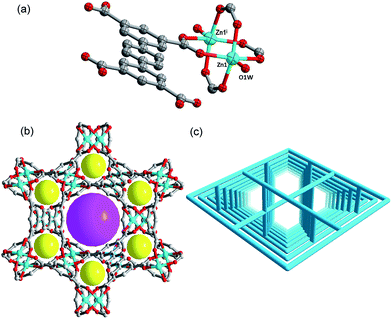 | ||
| Fig. 3 (a) Coordination environment of the Zn(II). (b) The 3D framework viewed from c axis. (c) Schematic illustration of the 3D network with (4,4)-NbO topology. | ||
Effect of solvents on the complexes 1–3
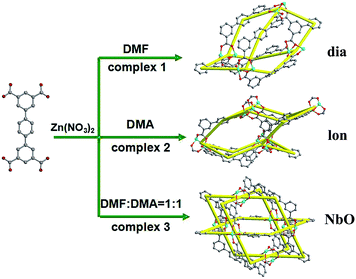
As is well known, the solvent is one of the external factors that influence the formation of MOFs structures.20 The reaction conditions (ratio of reactants, the system temperature, and reaction time) are the same for the syntheses of complexes 1–3 except for solvents, which results in the formation of different structures and topologies. The formation of dia, lon and NbO networks (Fig. 4) is dependent on the different solvents (DMF, DMA and a mixture of DMF/DMA (1![[thin space (1/6-em)]](https://www.rsc.org/images/entities/char_2009.gif) :
:![[thin space (1/6-em)]](https://www.rsc.org/images/entities/char_2009.gif) 1), respectively) for complexes 1–3. The reasons of different structures are probably summarized as follows: (1) different solvent molecules may possibly coordinate with metal ions during the synthesis process, which could have structure-directing properties affecting the structures; (2) the dihedral angles between the intermediate benzene ring and adjacent two benzene rings in the ptptc4− ligand for three complexes are different in different solvents. The dihedral angle among the benzene rings in the structure 1 is approximative 32.38° and 36.43°, respectively. The dihedral angle of the structure 2 is about 35.14° and 35.17°, respectively, while the three benzene rings of the organic ligand in complex 3 are almost on the same plane (Fig. S1†).
1), respectively) for complexes 1–3. The reasons of different structures are probably summarized as follows: (1) different solvent molecules may possibly coordinate with metal ions during the synthesis process, which could have structure-directing properties affecting the structures; (2) the dihedral angles between the intermediate benzene ring and adjacent two benzene rings in the ptptc4− ligand for three complexes are different in different solvents. The dihedral angle among the benzene rings in the structure 1 is approximative 32.38° and 36.43°, respectively. The dihedral angle of the structure 2 is about 35.14° and 35.17°, respectively, while the three benzene rings of the organic ligand in complex 3 are almost on the same plane (Fig. S1†).
Powder diffraction measurements and thermal analyses
PXRD has been used to check the purity of the samples in the solid state, and each PXRD pattern of sample is consistent with its simulated one (Fig. S2†). The thermal stability properties of three complexes were performed under N2 atmosphere at a ramp rate of 10 °C min−1 and the temperature ranged from 40 °C to 900 °C. The curves are displayed in ESI Fig. S3.† From the TGA curve of complex 1, the weight loss at the temperature range from 40 °C to 176 °C is 38.5% (calcd 38.7%) corresponding to the removal of four water molecules and five and a half DMF molecules. After 176 °C, 1 starts to decompose. The thermal stability curve of complex 2 are exhibited weight losses between 40 and 375 °C, which are attributed to the loss of molecules from the pores and decoordination of DMA and water (found 34.1%, calcd 35.4%). The decomposition of 2 starts at 375 °C. For 3, the 39.7% weight loss (calcd 40.1%) are attributed to the release of one DMF molecule and one DMA molecule at 330 °C. After 330 °C, 3 starts to decompose.Luminescent properties and fluorescence sensing
The ligand coordinated with d10 transition metal centers have exhibited excellent luminescent applications in chemical sensors, luminescent materials and electroluminescent display, and so on.21 The solid state luminescent spectra for complexes 1–3 and free organic ligand were performed at room temperature. As exhibited in Fig. 5a, the main characteristic peak of free H4ptptc ligand is observed at 431 nm, which may be ascribed to the π* → n or π* → π transitions.22 The characteristic emission peaks of complexes 1–3 are exhibited at 403 nm, 406 nm and 399 nm under the same conditions as the excitation wavelength (330 nm) of the free H4ptptc ligand, which are obvious blue-shifted of 28 nm, 25 nm and 32 nm in comparison with the free ligand, respectively. The different wavelengths of maximum peak among complexes 1–3 may be attributed to the deviations of the coordination modes between the central metal ions and ptptc4− ligand.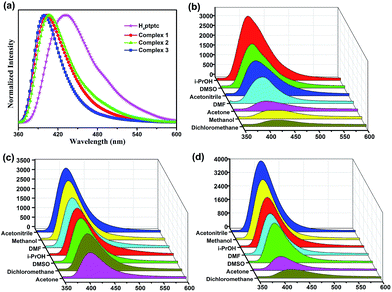 | ||
| Fig. 5 (a) Room-temperature emission spectra for free ligand and complexes 1–3. (b–d) The photoluminescence intensities spectra of complexes 1–3 that were dispersed in different organic solvents. | ||
In order to explore the sensing sensitivity of complexes 1–3 for solvent molecules, 1–3 and free ligand were dispersed in different solvent emulsions (DMF, CH3OH, CH3CN, CH2Cl2, acetone, isopropanol and DMSO), and their luminescence intensities were investigated. When free ligand was dispersed in DMF and DMSO, respectively, remarkable blue shifts are observed for the emission of free ligand relative to all the other solvent molecules due to the different solubility (Fig. S8†). As illustrated in Fig. 5b, complex 1 dispersed in isopropanol (i-PrOH) displays the strongest luminescent intensity, and it exhibits the weakest emission in dichloromethane (CH2Cl2). While the order of the intensity for 2 and 3 are different from that for 1. As exhibited in Fig. 5c and d, 2 and 3 display the strongest luminescence intensity in CH3CN and acetone emulsion, respectively, while weakest luminescence intensity is observed in CH3CN and CH2Cl2 emulsion, respectively. The fact that complexes 1–3 exhibit different order of the luminescence intensity may be ascribed to two factors: the different structures and the interactions between the framework and guest solvent molecules. As shown in Fig. S4a,† when complex 1 is dispersed in i-PrOH, the fluorescence intensity gradually decreased with adding amounts of dichloromethane (CH2Cl2). A small amount of CH2Cl2 can be recognized due to its photoluminescence diminishment, which is dependent on its content. Similar results are observed for complexes 2 and 3. (Fig. S4b and c†). These intensity differences suggested that the organic molecules could be trapped on the surface of the MOF, which could be attributed into the different interactions between the framework structure and distinct solvents.12b,24b
The widespread use of nitro aromatic compounds in industry has seriously harmed the environment and public health due to its high toxicity, therefore, the development of rapid and selective sensing of nitro aromatic compounds is very significant.23 The 1.0 mM DMSO solution containing different aromatic compounds were added gradually into a batch of DMSO-emulsions of complexes 1–3, respectively (Fig. S5–7†). To investigate their sensing performances, a series of benzene and nitrobenzene derivatives, such as benzene (BZ), chlorobenzene (CB), nitrobenzene (NB), 4-nitrotoluene (NT), 1,3-dinitrobenzene (1,3-DNB), 2,4-dinitrotoluene (2,4-DNT), 1,4-dinitrobenzene (1,4-DNB) were selected as the analytes. The fluorescence intensities of the DMSO-emulsions of complexes 1–3 reduced gradually upon the addition of different derivatives. In particular, the addition of 1,4-dinitrobenzene shows obvious quenching effect of fluorescence intensity. The quenching percentage after adding the different analytes were calculated via the (I0 − I)/I0 × 100% formula, where I0 is the initial fluorescence intensity without the benzene and nitrobenzene derivatives, I is the fluorescence intensity after the addition of the derivatives. The sequences of fluorescence quenching percentages in the 0.14 mM concentration of suspension solution for complexes 1–3 are displayed in Fig. 6. The highest fluorescence quenching percentage of complex 1 is 1,4-DNB, which quenches the emission by as much as 41%. The lower quenching efficiencies are observed for other nitrobenzene derivatives and benzene (10%). Complexes 2 and 3 have the similar phenomenons to complex 1. These results demonstrate a higher selectivity for 1,4-DNB, which can be attributed to the presence of the electron-withdrawing –NO2 groups and electrostatic interactions between 1,4-DNB and the fluorophore.24,25 Furthermore, to further research the quenching efficiency of the 1,4-DNB for complexes 1–3, the value of quenching constant KSV are about 5.02 × 10³ M−1, 4.21 × 10³ M−1 and 4.36 × 10³ M−1, respectively, which are calculated by the Stern–Volmer equation, (I0/I) = Ksv[A] + 1, [A] is the concentration of the analyte.26 The above results illustrate that three Zn-MOFs could all serve as the materials detected nitrocompound. Thus, to further design and synthesis of analogous MOFs with the fluorescent sensing properties have become important for environment and public healthiness.
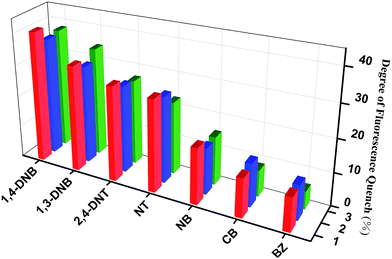 | ||
| Fig. 6 Percentage of fluorescence quenching obtained for introducing different nitro aromatic compounds into the DMSO-emulsion of complexes 1–3. | ||
Experimental
Methods
The ligand terphenyl-3,3′′,5,5′′-tetracarboxylic acid was synthesized through the Suzuki coupling reaction of dibromobenzene and dimethyl-5-(4,4,5,5-tetramethyl-1,3,2-dioxaborolan-2-yl)isophthalate,27 and reagents used in the synthesis were purchased commercially without further purification. The tests of IR spectra were carried on a Nexus FT-IR Spectrometer ranged in 4000–500 cm−1. C, H, N of elemental analyses were measured on an EA 1110 elemental analyzer. The powder diffraction data were collected on a Cu-Kα radiation using an X-Pert PRO MPD diffractometer. Thermogravimetric analyses were performed in the temperature ranged from 25 to 800 °C with 10 °C min−1 rate of heat using a Mettler Toledo TGA instrument. Photoluminescence spectra experiments were obtained on a Hitachi F-7000 spectrofluorometer.Synthesis of complexes
![[thin space (1/6-em)]](https://www.rsc.org/images/entities/char_2009.gif) :
:![[thin space (1/6-em)]](https://www.rsc.org/images/entities/char_2009.gif) DMA = 1
DMA = 1![[thin space (1/6-em)]](https://www.rsc.org/images/entities/char_2009.gif) :
:![[thin space (1/6-em)]](https://www.rsc.org/images/entities/char_2009.gif) 1 was replaced into the DMF as solvent. Yield: 35%. Calcd for 3: C, 48.61; H, 5.21; N, 6.30. Found: C, 48.86; H, 5.37; N 5.92. IR (KBr, cm−1): 3433 (m), 2019 (w), 1632 (s), 1450 (w), 1398 (m), 1193 (w), 1122 (w), 1023 (m), 711 (w), 602 (w), 593 (w), 479 (w).
1 was replaced into the DMF as solvent. Yield: 35%. Calcd for 3: C, 48.61; H, 5.21; N, 6.30. Found: C, 48.86; H, 5.37; N 5.92. IR (KBr, cm−1): 3433 (m), 2019 (w), 1632 (s), 1450 (w), 1398 (m), 1193 (w), 1122 (w), 1023 (m), 711 (w), 602 (w), 593 (w), 479 (w).Structural crystallography
The X-ray datum of complex 1 was collected on a Bruker APEXII CCD with Mo-Kα radiation (λ = 0.71073 Å) at room temperature. The data of complexes 2 and 3 were obtained on an Agilent Super nova with Cu-Kα and Mo-Kα radiation (λ = 1.54178 and 0.71073 Å) at 200 and room temperature, respectively. The absorption corrections were decided by employing the SADABS program.28 The structures and hydrogen atoms of three complexes were refined to utilize the SHELX-97 program29 through the full-matrix least-squares by fitting on F2 and anisotropic thermal parameters, respectively. There are many disordered solvent molecules could existed in the cavity of three complexes, which can be not be achieved through the reasonable modeling. Hence, the diffuse electron could be removed by the PLATON/SQUEEZE routine.15 The summary of three structures data were displayed in Table 1, and the part of the bond lengths and bond angles were exhibited in Table S1–S3 from ESI.† Three CIF data were confirmed by employing the checkCIF/PLATON service, ESI.†| Complexes | 1 | 2 | 3 |
|---|---|---|---|
| a R1 = ∑||Fo| − |Fc||/∑o|. wR2 = {∑[w(Fo2 − Fc2)2]/∑[w(Fo2)2]}1/2. | |||
| Formula | C31H31N3O11Zn2 | C26H21NO10Zn2 | C11H5O5Zn |
| Mr | 752.33 | 638.18 | 282.52 |
| Crystal system | Orthorhombic | Monoclinic | Trigonal |
| Space group | Pna21 | P21 | R![[3 with combining macron]](https://www.rsc.org/images/entities/char_0033_0304.gif) m m |
| a (Å) | 18.416 (5) | 10.19159 (13) | 19.0926 (9) |
| b (Å) | 10.154 (3) | 16.42204 (19) | 19.0926 (9) |
| c (Å) | 27.010 (8) | 15.56239 (19) | 37.8155 (15) |
| α (degree) | 90.00 | 90.00 | 90.00 |
| β (degree) | 90.00 | 107.0727 (13) | 90.00 |
| γ (degree) | 90.00 | 90.00 | 120.00 |
| Z | 4 | 2 | 18 |
| V (Å3) | 5051 (2) | 2489.85 (5) | 11![[thin space (1/6-em)]](https://www.rsc.org/images/entities/char_2009.gif) 938.0 (9) 938.0 (9) |
| Dc (g cm−3) | 0.989 | 0.851 | 0.707 |
| μ (mm−1) | 0.991 | 1.457 | 0.928 |
| F (000) | 1544.0 | 648.0 | 2538.0 |
| No. of unique reflns | 22![[thin space (1/6-em)]](https://www.rsc.org/images/entities/char_2009.gif) 282 282 |
39![[thin space (1/6-em)]](https://www.rsc.org/images/entities/char_2009.gif) 103 103 |
8035 |
| No. of obsd reflns [I > 2σ(I)] | 8783 | 9434 | 2575 |
| Parameters | 430 | 355 | 85 |
| GOF | 0.968 | 1.105 | 1.130 |
| Final R indices [I > 2σ(I)] | R1 = 0.0606, wR2 = 0.1502 | R1 = 0.0427, wR2 = 0.1128 | R1 = 0.0703, wR2 = 0.2075 |
| R Indices (all data) | R1 = 0.0753, wR2 = 0.1584 | R1 = 0.0467, wR2 = 0.1152 | R1 = 0.0856, wR2 = 0.2293 |
| Largest diff. peak/hole/e Å−3 | 0.79/−0.47 | 0.73/−0.45 | 0.66/−0.74 |
Conclusions
In summary, three 3D Zn-MOFs: [Zn2(ptptc)(DMF)3]·4H2O·5.5DMF (1), [Zn2(ptptc)(DMA)(H2O)]·2.5H2O·3.5DMA (2), [Zn(ptptc)0.5(H2O)]·DMF·DMA (3) based on H4ptptc and Zn(NO3)2 have been successfully obtained. Complexes 1–3 are all 3D 4-connected networks, but features different topological structures. These results show that the structures of three MOFs can be affected by the choice of reaction solvent. Choosing DMF gives rise to a dia topology for complex 1, choice of DMA brings about the formation of complex 2 with lon network, and using DMF/DMA (1![[thin space (1/6-em)]](https://www.rsc.org/images/entities/char_2009.gif) :
:![[thin space (1/6-em)]](https://www.rsc.org/images/entities/char_2009.gif) 1) leads to the structure of complex 3 with a NbO net. Furthermore, the fluorescent recognition properties for three Zn-MOFs were investigated at room temperature. Our study on their guest-free forms exposes that complexes 1–3 could selectively detect dichloromethane (CH2Cl2), acetone and CH2Cl2 due to the quenching phenomena, respectively. And three complexes were measured for sensing a series of aromatic compounds. The results illustrate that three complexes exhibit the highest quenching behavior upon adding in a solvent of 1,4-DNB compounds. Further studies will be focused on their recognition selectivity for other functional groups of aromatic compounds, which can explore their application in sensing organic molecule and pollutants. To realize these aims are underway.
1) leads to the structure of complex 3 with a NbO net. Furthermore, the fluorescent recognition properties for three Zn-MOFs were investigated at room temperature. Our study on their guest-free forms exposes that complexes 1–3 could selectively detect dichloromethane (CH2Cl2), acetone and CH2Cl2 due to the quenching phenomena, respectively. And three complexes were measured for sensing a series of aromatic compounds. The results illustrate that three complexes exhibit the highest quenching behavior upon adding in a solvent of 1,4-DNB compounds. Further studies will be focused on their recognition selectivity for other functional groups of aromatic compounds, which can explore their application in sensing organic molecule and pollutants. To realize these aims are underway.
Acknowledgements
This work was supported by the NSFC (Grant Nos 21271117, 21201179), the China Postdoctoral Science Foundation funded project (2012M510106, 2014T70665), and the Fundamental Research Funds for the Central Universities (13CX05015A, 14CX02213A).Notes and references
- (a) M. Kurmoo, Chem. Soc. Rev., 2009, 38, 1353 RSC; (b) D. F. Weng, Z. M. Wang and S. Gao, Chem. Soc. Rev., 2011, 40, 3157 RSC.
- (a) J. R. Li, R. J. Kuppler and H. C. Zhou, Chem. Soc. Rev., 2009, 38, 1477 RSC; (b) S. Kitagawa and K. Uemura, Chem. Soc. Rev., 2005, 34, 109 RSC.
- (a) S. Kitagawa, R. Kitaura and S. Noro, Angew. Chem., Int. Ed., 2004, 43, 2334 CrossRef CAS PubMed; (b) Y. He, S. Xiang and B. Chen, J. Am. Chem. Soc., 2011, 133, 14570 CrossRef CAS PubMed.
- (a) L. Ma, C. Abney and W. Lin, Chem. Soc. Rev., 2009, 38, 1248 RSC; (b) J. Y. Lee, O. K. Farha, J. Roberts, K. A. Scheidt, S. T. Nguyen and J. T. Hupp, Chem. Soc. Rev., 2009, 38, 1450 RSC.
- (a) C. K. Brozek, L. Bellarosa, T. Soejima, T. V. Clark, N. López and M. Dincǎ, Chem.–Eur. J., 2014, 20, 6871 CrossRef CAS PubMed; (b) C. P. Li, J. M. Wu and M. Du, Chem.–Eur. J., 2012, 18, 12437 CrossRef CAS PubMed.
- (a) M. Du, X. J. Zhao and Y. Wang, Dalton Trans., 2004, 2065 RSC; (b) Y. F. Han, W. G. Jia, W. B. Yu and G. X. Jin, Chem. Soc. Rev., 2009, 38, 3419 RSC; (c) Y. P. He, Y. X. Tan, F. Wang and J. Zhang, Inorg. Chem., 2012, 51, 1995 CrossRef CAS PubMed; (d) D. C. Zhong, W. X. Zhang, F. L. Cao, L. Jiang and T. B. Lu, Chem. Commun., 2011, 47, 1204 RSC; (e) J. S. Hu, L. Qin, M. D. Zhang, X. Q. Yao, Y. Z. Li, Z. J. Guo, H. G. Zheng and Z. L. Xue, Chem. Commun., 2012, 48, 681 RSC.
- (a) I. H. Park, R. Medishetty, J. Y. Kim, S. S. Lee and J. Vittal, Angew. Chem., Int. Ed., 2014, 53, 5591 CrossRef CAS PubMed; (b) P. P. Cui, J. L. Wu, X. L. Zhao, D. Sun, L. L. Zhang, J. Guo and D. F. Sun, Cryst. Growth Des., 2011, 11, 5182 CrossRef CAS; (c) P. Hu, L. Ma, K. J. Tan, H. Jiang, F. X. Wei, C. H. Yu, K. P. Goetz, O. D. Jurchescu, L. E. McNeil, G. G. Gurzadyan and C. Kloc, Cryst. Growth Des., 2014, 14, 6376–6382 CrossRef CAS.
- D. F. Sun, Y. X. Ke, T. M. Mattox, B. A. Ooro and H. C. Zhou, Chem. Commun., 2005, 5447 RSC.
- C. Volkringer, T. Loiseau, N. Guillou, G. Férey, M. Haouas, F. Taulelle, E. Elkaim and N. Stock, Inorg. Chem., 2010, 49, 9852 CrossRef CAS PubMed.
- B. C. Tzeng, H.-T. Yeh, T.-Y. Chang and G.-H. Lee, Cryst. Growth Des., 2009, 9, 2552 CAS.
- M. Du, X.-J. Zhao, J.-H. Guo and S. R. Batten, Chem. Commun., 2005, 4836 RSC.
- (a) Y. J. Cui, Y. F. Yue, G. D. Qian and B. L. Chen, Chem. Rev., 2012, 112, 1126 CrossRef CAS PubMed; (b) X. F. Zheng, L. Zhou, Y. M. Huang, C. G. Wang, J. G. Duan, L. L. Wen, Z. F. Tian and D. F. Li, J. Mater. Chem. A, 2014, 2, 12413 RSC; (c) H. H. Li, W. Shi, K. N. Zhao, Z. Niu, H. M. Li and P. Cheng, Chem.–Eur. J., 2013, 19, 3358 CrossRef CAS PubMed.
- (a) K. Sumida, D. L. Rogow, J. A. Mason, T. M. McDonald, E. D. Bloch, Z. R. Herm, T. H. Bae and J. R. Long, Chem. Rev., 2012, 112, 724 CrossRef CAS PubMed; (b) J. M. Zhou, W. Shi, N. Xu and P. Cheng, Inorg. Chem., 2013, 52, 8082 CrossRef CAS PubMed; (c) S. R. Zhang, D. Y. Du, J. S. Qin, S. J. Bao, S. L. Li, W. W. He, Y. Q. Lan, P. Shen and Z. M. Su, Chem.–Eur. J., 2014, 20, 3589 CrossRef CAS PubMed.
- (a) L. E. Kreno, K. Leong, O. K. Farha, M. Allendorf, R. P. Van Duyne and J. T. Hupp, Chem. Rev., 2012, 112, 1105 CrossRef CAS PubMed; (b) A. Lan, K. Li, H. Wu, D. H. Olson, T. J. Emge, W. Ki, M. Hong and J. Li, Angew. Chem., Int. Ed., 2009, 48, 2334 CrossRef CAS PubMed; (c) S. Pramanik, C. Zheng, X. Zhang, T. J. Emge and J. Li, J. Am. Chem. Soc., 2011, 133, 4153 CrossRef CAS PubMed; (d) C. Zhang, Y. Che, Z. Zhang, X. Yang and L. Zang, Chem. Commun., 2011, 47, 2336 RSC; (e) Z. Zhang, S. Xiang, X. Rao, Q. Zheng, F. R. Fronczek, G. Qian and B. Chen, Chem. Commun., 2010, 46, 7205 RSC; (f) A. K. Chaudhari, S. S. Nagarkar, B. Joarder and S. K. Ghosh, Cryst. Growth Des., 2013, 13, 3716 CrossRef CAS.
- (a) A. L. Spek, Platon, A Multipurpose Crystallographic Tool, Utrecht University, Utrecht, The Netherlands, 1998 Search PubMed; (b) A. L. Spek, Acta Crystallogr., 2009, 65, 148 CAS.
- V. A. Blatov, Struct. Chem., 2012, 23, 955 CrossRef CAS.
- (a) Q. Q. Guo, C. Y. Xu, B. Zhao, Y. Y. Jia, H. W. Hou and Y. T. Fan, Cryst. Growth Des., 2012, 12, 5439 CrossRef CAS; (b) Z. Q. Shi, Y. Z. Li, Z. J. Guo and H. G. Zheng, Cryst. Growth Des., 2013, 13, 3078 CrossRef CAS.
- (a) L. Wen, P. Cheng and W. B. Lin, Chem. Sci., 2012, 3, 2288 RSC; (b) J. Zhang, F. Wang, D. C. Hou, H. Yang, Y. Kang and J. Zhang, Dalton Trans., 2014, 43, 3210 RSC.
- (a) M. Xue, G. S. Zhu, Y. X. Li, X. J. Zhao, Z. Jin, E. H. Kang and S. L. Qiu, Cryst. Growth Des., 2008, 4, 2478 CrossRef; (b) B. Zheng, Z. Q. Liang, G. H. Li, Q. S. Huo and Y. L. Liu, Cryst. Growth Des., 2010, 10, 3405 CrossRef CAS.
- (a) L. Delhaye, A. Ceccato, P. Jacobs, C. Kottgen and A. Merschaert, Org. Process Res. Dev., 2007, 11, 160 CrossRef CAS; (b) K. M. Kadish, L. L. Wang, A. Thuriere, L. Giribabu, R. Garcia, E. V. Caemelbecke and J. L. Bear, Inorg. Chem., 2003, 42, 8309 CrossRef CAS PubMed.
- (a) X. Shi, G. Zhu, Q. Fang, G. Wu, G. Tian, R. Wang, D. Zhang, M. Xue and S. Qiu, Eur. J. Inorg. Chem., 2004, 1, 185 CrossRef PubMed; (b) X. M. Zhang, M. L. Tong, M. L. Gong and X. M. Chen, Eur. J. Inorg. Chem., 2003, 1, 138 CrossRef PubMed; (c) L. Wen, Y. Li, Z. Lu, J. Lin, C. Duan and Q. Meng, Cryst. Growth Des., 2006, 6, 530 CrossRef CAS.
- (a) Y. Yang, P. Du, J. F. Ma, W. Q. Kan, B. Liu and J. Yang, Cryst. Growth Des., 2011, 11, 5540 CrossRef CAS; (b) W. G. Lu, J. H. Deng and D. C. Zhong, Inorg. Chem. Commun., 2012, 20, 312 CrossRef CAS PubMed; (c) L. Wen, Z. Lu, J. Lin, Z. Tian, H. Zhu and Q. Meng, Cryst. Growth Des., 2007, 7, 93 CrossRef CAS; (d) J. G. Lin, S. Q. Zang, Z. F. Tian, Y. Z. Li, Y. Y. Xu, H. Z. Zhu and Q. J. Meng, CrystEngComm, 2007, 9, 915 RSC.
- (a) F. Arduini, F. Ricci, C. S. Tuta, D. Moscone, A. Amine and G. Palleschi, Anal. Chim. Acta, 2006, 580, 155 CrossRef CAS PubMed; (b) B. X. Li, Y. Z. He and C. L. Xu, Talanta, 2007, 72, 223 CrossRef CAS PubMed; (c) X. H. Li, Z. H. Xie, H. Min, Y. Z. Xian and L. T. Jin, Electroanalysis, 2007, 24, 2257 Search PubMed.
- (a) S. S. Nagarkar, B. Joarder, A. K. Chaudhari, S. Mukherjee and S. K. Ghosh, Angew. Chem., Int. Ed., 2013, 52, 2881 CrossRef CAS PubMed; (b) G. L. Liu, Y. J. Qin, L. Jing, G. Y. Wei and H. Li, Chem. Commun., 2013, 49, 1699 RSC.
- S. Pramanik, C. Zheng, X. Zhang, T. J. Emge and J. Li, J. Am. Chem. Soc., 2011, 133, 4153 CrossRef CAS PubMed.
- A. Ganguly, B. K. Paul, S. Ghosh, S. Kar and N. Guchhait, Analyst, 2013, 138, 6532 RSC.
- X. Lin, J. H. Jia, X. B. Zhao, K. M. Thomas, A. J. Blake, G. S. Wallker, N. R. Champness, P. Hubberstey and M. Schröder, Angew. Chem., Int. Ed., 2006, 45, 7358 CrossRef CAS PubMed.
- G. M. Sheldrick, SADABS 2.05, University of Gottingen, Gottingen, Germany, 2002 Search PubMed.
- G. M. Sheldrick, SHELXS-97, Programs for X-ray Crystal Structure Solution, University of Gottingen, Gottingen, Germany, 1997 Search PubMed.
Footnote |
| † Electronic supplementary information (ESI) available. CCDC 1042265, 1042267 and 1042266. For ESI and crystallographic data in CIF or other electronic format see DOI: 10.1039/c5ra10391f |
| This journal is © The Royal Society of Chemistry 2015 |

