Understanding the thermal dehydrochlorination reaction of 1-chlorohexane. Revealing the driving bonding pattern at the planar catalytic reaction center

Lina Lópeza, Pablo Ruiza, Manuela Castroa, Jairo Quijanoa, Mario Duque-Noreñab, Patricia Pérezb and Eduardo Chamorro*b
aUniversidad Nacional de Colombia, Laboratorio de Fisicoquímica Orgánica, Facultad de Ciencias, AP 3840, Medellín, Colombia
bUniversidad Andres Bello, Facultad de Ciencias Exactas, Departamento de Ciencias Quimicas, Millennium Nucleus Chemical Processes and Catalysis, Avenida Republica 275, 8370146 Santiago, Chile. E-mail: echamorro@unab.cl

Received 29th May 2015 , Accepted 15th July 2015

First published on 15th July 2015


Abstract

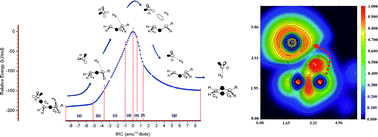
The nature of bonding along the gas-phase thermal decomposition of 1-chlorohexane to produce 1-hexene and hydrogen chloride has been examined at the DFT M05-2X/6-311+G(d,p) level of theory. Based on results both from energetical and topological analysis of the electron localization function (ELF), we propose to rationalize the experimental available results not in terms of a decomposition via a four-membered cyclic transition structure (TS), but properly as a two stage one step reaction mechanism featuring a slightly asynchronous process associated to the catalytic planar reaction center at the TS. In this context, the first electronic stage corresponds to the Cδ+⋯Clδ bond cleavage, which take place on the activation path earlier the transition structure be reached. There is no evidence of a Cl–C bond at the TS configuration. The second stage, associated to the top of the energy barrier, includes the TS and extends beyond on the deactivation pathway towards the products. The existence of both bonding and nonbonding non covalent interactions (NCI) are also revealed for the first time for the TS configuration.

Introduction

Alkyl halides decompose thermally in the gas phase to yield olefins and hydrogen halides via homogeneous, unimolecular, first-order rate law processes. For many years, a planar four-membered cyclic transition state has been proposed to be the most accepted mechanism for such an elimination reaction process.1,2 Indeed, experimental analysis of the reaction occurring in deactivated static reaction vessels and in the presence of free radical suppressors, suggests the existence of large electric charge separations in the transition region.1 In the case of decomposition of alkyl chlorides, a syn-elimination with the active participation of a nonbonding pair of the chlorine atom has been considered the driving factor allowing a highly concerted decomposition in the gas-phase.3–8 Extensive work, both experimental2,4,9,10 and theoretically oriented3,9–11 have pointed out to the polarization of the Cδ+⋯Xδ bond as the key chemical event associated to the rate determining step of the dehydrohalogenation process (see Scheme 1).1
image file: c5ra10152b-s1.tif
Scheme 1 Thermal decomposition of alkyl chlorides in the gas phase via a four-membered planar transition structure (TS), including polar (1), concerted (2), ion pair (3) or semi ion pair alternatives (4). The nature of bonding at the catalytic reaction center for the electronic rearrangement (i.e., Cl–Cα–Cβ–Hβ) remains unknown. The thermal decomposition of 1-chlorohexane (R = n-C4H8) is examined in this work as test representative example.2,4,9,10

The catalytic substituent effects on the rates,2,4,9,10 including both inductive and resonance effects on the centers Cα and Cβ, have been rationalized on the basis of favouring a heterolytic transition structure (1) or a completely concerted alternative (2).3,9–11 However, and not free from controversy, mechanisms in the gas phase implying a polar nature of the transition state have been also related to the consideration of very polar intimate ion pair interactions (3), or even semi-ion pair transition structures (4).3,8–18 The intimate nature of the electronic rearrangement driving this type of transformations remains certainly unknown. Our main goal is the characterization of the electronic patterns governing cyclic transition states,19–28 therefore we will focus on the nature of bonding of the thermal decomposition of 1-chlorohexane reaction mechanism as a benchmark of this type of reactivity in gas phase.2,4,9,10 Our discussion will be based on results from local measures of the same spin pair density distribution as given through the topological analysis of the electron localization function (ELF),29,30 i.e., a relative but proper measure of Pauli repulsion at the local level. The existence of non-covalent interactions (NCI)31 at the transition structure is also examined in order to characterize the stabilizing/de-stabilizing interactions in the reaction center associated to the driving electronic rearrangement. Our aim is to provide a deeper insight on the thought-provoking nature of the pattern of bonding in the reaction mechanism of such a thermal decomposition in the gas phase. The thermal decomposition of 1-chlorohexane2,4 is examined within the experimental temperature range 623.15–833.15 K and pressures of 5–20 Torr. Under these conditions the rate constant has been reported.2,4,9,10 to be independent of the initial pressure, and the derived Arrhenius activation parameters, i.e., A = 9.84 ± 1.08 s−1 and Ea = 177.25 ± 3.35 kJ mol−1, have been claimed to be consistent with the suggested heterolytic mechanism depicted in Scheme 1.

Theoretical methods and computational details

Topological analysis of the electron localization function (ELF)

Given any electronic state for a N-electron molecular system represented in terms of a single determinant of Hartree–Fock or Kohn–Sham molecular orbitals ψi(r) with occupation numbers ni, the Electron Localization Function (ELF),29 η(r), is a useful relative measure of the electron pair localization characterizing the corresponding electron density distribution image file: c5ra10152b-t1.tif. Within the framework of density functional theory (DFT), ELF is a property based directly on the electron density, able to be interpreted in terms of the positive-definite local Pauli τP(r) and Thomas Fermi, τh(r), kinetic energy densities in the given system, namely,30,32 η(r) = [1 + [τP(r)/τh(r)]2]−1. As it is well known,30,32 the ratio τP(r)/τh(r) provides the key information on the relative local excess of kinetic energy density associated to the Pauli principle, given we have that image file: c5ra10152b-t2.tif and τh(r) = (3/5)(6π2)2/3ρ(r)5/3. η(r) takes values in the range [0,1], the highest values being associated to the spatial positions r with higher electron localization (as compared to the arbitrarily chosen uniform electron gas reference).30,32 The analysis of the gradient vector field of ELF, ∇η(r), provides a division of the molecular space ρ(r) into basins of attractors Ω that are, empirically, associated to chemically meaningful concepts such as atomic cores (C), and valence (V) bonds, lone pairs, and other elements of chemical bonding.29,33,34 In this picture of bonding, the valence basin densities are delocalized throughout those associated to the inner atomic shell densities of core basins. The valence basins V(X,Y,…) are characterized by the number of core basin C(X), C(Y),… with which they have a boundary. Valence monosynaptic basins can be associated for instance to electron lone pairs, whereas disynaptic basins are associated to typical two-center bonds. Such a synaptic order provides a useful way to portray multicenter bonds within a topological framework of rationalization of chemistry.34 Currently, both single-determinantal and correlated wave functions can be analysed using extended formulations of the electron localization function.28,35,36 The integration of the density ρ(r) or the two-electron density probabilities in the spatial volume of ELF basins Ω constitutes the basis for the definition of topologically dependent populations image file: c5ra10152b-t3.tif and variance-related indices,37,38 that have proved a useful way to understanding electron delocalization in molecular systems. It should be formally noted that the electronic basin populations NΩ, characterize only the spatial organization of the bonding in terms of the electron pair localization.

Identifying non-covalent interactions molecular systems

The localization and characterization of non-covalent interactions NCI (i.e., van der Waals, steric repulsion, and hydrogen bond interactions) in chemical structural domains in real space provides a useful way to further understanding the favourable and unfavourable interactions prescribing the nature of chemical bonding. These weak interactions, undetectable from the topological analysis of ELF, can be however revealed by using the analysis of isosurfaces of low values of the reduced density gradient, s = 1/(2(3π2)1/3|∇ρ(r)|/ρ(r)4/3, at low values of electron density, within the methodological approach proposed by Yang et al.31 Non covalent interactions are associated to the low-density, low-gradient regions in plots of s vs. ρ. The value of density itself gives us information about the strength of the NCI, whereas the sign of the second eigenvalue of the electron-density Hessian matrix allow their categorization as bonded (λ2 < 0) or nonbonded (λ2 > 0) interactions.

Computational details

Potential energy surfaces corresponding to the dehalogenation of 1-chlorohexane in the vacuum have been explored using the global-hybrid meta-GGA M05-2X functional with the 6-311+G(d,p) basis set as implemented in the Gaussian 09 package of programs.39 This level of theory has shown to have good performance for applications involving thermochemistry, kinetics, and non-covalent interactions that become enough suitable to incorporate the electronic effects involved in the bonding breaking/formation in hydrocarbon systems. Geometry optimizations were followed by analytical calculation of frequencies to determine the nature of the stationary point, i.e. each structure was characterized as a minimum or a saddle point of first order by using analytical frequency calculations. A scaling factor of 0.9580 for the zero-point vibrational energies has been used. Thermal corrections to enthalpy and entropy values have been evaluated in the range of experimental temperature determinations at 0.013 atm. Activation parameters were evaluated within the classical formulation of transition state theory (TST) using the Eyring–Polanyi equation.40–42 The reaction pathway was studied within the IRC approach.43–45 The electronic structures of selected structures along the path were examined both within the Natural Bond Orbital (NBO) approximations.46,47 The topological analysis of the electron localization function (ELF) was performed using the TopMod 09 computational tools.48 NCI analysis was performed through the NCIPLOT program49,50 and visualization was performed using the VMD51 and Multiwfn52 suite of tools using the optimized densities of selected points along the IRC at the chosen level of theory. The NBO formalism provides atomic natural total charges enabling the evaluation of Wiberg bond indices used to follow the progress of the reaction. Similarly, the electronic populations integrated in the ELF basins, NΩ, followed along the reaction path provide us the structure of the dominant electron pair delocalization topology of the rearrangement process.23,24,26–28,53

Results and discussion

At the selected DFT level of theory we found that the transition structure (Fig. 1) corresponding to a syn-dehalogenation process is associated to the lowest energy path for the decomposition of 1-chlorohexane. At the four-membered reaction center the interatomic distances describes a transition structure where the Cl–Cα bond has been essentially broken and the substituents on the Cα and Cβ deviate from planarity by 7.729° i.e., exhibiting almost trigonal planar configurations while evolving towards the formation of the Cα–Cβ double bond. The TS is not properly a cyclic one, given that the Cl–Cα bond is already broken. The TS configuration features the migration of Hβ, and we propose that the global reaction process should be better considered two-stage one-step decomposition. In this mechanism the Cl–Cα (bond breaking) takes place before the hydrogen transfer process. Analogue rationalizations have been recently exemplified in the exploration of polar chemical organic reactions.54–59 In order to properly characterize the thermal decomposition process, in the following sections the progress of the reaction will be examined in terms of the electronic events governing the transformation evolving via the localized four-membered transition state.
image file: c5ra10152b-f1.tif
Fig. 1 Transition structure for the thermal syn-elimination of 1-chlorohexane, calculated at the M05-2X/6-311+G(d,p) level of theory. The interatomic distances and angles are expressed in Å, and degree, respectively. The catalytic reaction center at the TS adopts a quasi planar configuration, exhibiting a dihedral angle Cl–Cα–Cβ–Hβ valued in −3.143°. The most stable conformation of the carbon branch exhibits a Cα–Cβ–Cγ–Cδ dihedral angle of −20.421°.

Predicting kinetic rate constants

For the thermal decomposition reaction of 1-chlorohexane, Table 1 reports calculated activation parameters (ΔH, ΔS, ΔG) and the corresponding calculated rate constant kTST obtained within the ranges of temperature and pressure as experimental evidence reports.2,4,9,10 The adjusted experimental rate constant kEXP have been obtained from results by Nisar et al.4 It can be immediately noted that the agreement of the predicted TST rate constants with experimental available results is noticeably improved at higher temperatures as shown in the Arrhenius plots depicted in Fig. 2. Note also that at the chosen DFT level of theory the activation entropy is predicted to be positive but small (9.47–9.57 J mol−1 K−1). The transition state theory predicts from the experimental kinetic data that activation entropy is essentially zero (i.e., −0.069 J mol−1 K−1) within the experimental error associated to the determination of Arrhenius parameters.2,4,9,10 The positive difference in activation entropy in the calculations can be traced back to the increased contributions from rotational and vibrational modes in the TS, namely, ∼0.608 J mol−1 K−1 and ∼1.72 J mol−1 K−1, respectively in the range of analysed temperatures. The percentage of relative error for the prediction of the rate constant becomes only 5.1% at 683.2 K. Such an error is within the experimental tolerance of the experimental results, validating the chosen theoretical level of theory for further analysis of electron density.
Table 1 Theoretical activation parameters and kinetic constant at different temperatures for the thermal decomposition of 1-chlorohexane from results at the M05-2X/6-311+G(d,p) level of theory. Temperatures are in Kelvin, activation enthalpy and free energies are expressed in kJ mol−1, entropy in J mol−1 K−1, and the kinetic constant in s−1
T ΔH ΔS ΔG kTSTa kEXPb
a This work.b Experimental adjusted data from ref. 4.
623.2 226.70 9.47 220.8 4.04 × 10−06 9.77 × 10−06
643.2 226.72 9.51 220.6 1.63 × 10−05 2.83 × 10−05
653.2 226.74 9.53 220.5 3.16 × 10−05 4.70 × 10−05
673.2 226.76 9.56 220.3 1.13 × 10−04 1.24 × 10−04
683.2 226.77 9.57 220.2 2.07 × 10−04 1.97 × 10−04


image file: c5ra10152b-f2.tif
Fig. 2 Theoretical and experimental Arrhenius plots (k vs. T−1) for the thermal decomposition of 1-chlorohexane in the gas phase. Theoretical results were obtained from the predicted kinetic rate constants using the classical transition state theory at the DFT M05-2X/6-311+G(d,p) level of theory. Experimental adjusted data from ref. 4.

Analysis of the reaction IRC path

A representation of the relative energy and root mean square of gradient for the thermal decomposition of 1-chlorohexane along the intrinsic reaction coordinate is presented in Fig. 3. The relative positions of selected points along the reaction path are shown on the RMS curve. Negative labels are associated to the pathway from the reactant (point −80) to the TS (point 0), and positive ones are associated to the pathway from the TS towards the products (point +80) of decomposition, namely, 1-hexene and hydrogen chloride. The examination of variation evidenced by the RMS gradient along the IRC constitutes a sensitive and useful tool allowing us to identify regions along the reaction path where key chemical events take place. Of course, this analysis oversimplifies a proper treatment based on the scrutiny of the reaction force and the reaction flux descriptors,60–65 but it still useful for a general approach. We should note that we have implicitly used elements of a bonding evolution theory consisting of the joint-use of the electron localization function29,30 and Thom's catastrophe theory66 as a convenient tool to analyse the electronic changes associated to the bonding breaking/formation chemical processes. In the present case, regions a: IRC = (−8.683, −5.114), b: IRC = (−5.114, −3.700), c: (IRC = −3.700, −0.980), and d: IRC = (−0.980, 0.000) account for the activation barrier, whereas regions e: IRC = (0.000, 0.544), f: IRC = (0.544, 1.305), and g: IRC = (1.305, 8.681) become associated to the deactivation path. Steps along the IRC are expressed units of amu1/2 Bohr. Complementarily, Fig. 4 reveals the variation of interatomic distances associated to the catalytic reaction center along the IRC.
image file: c5ra10152b-f3.tif
Fig. 3 Relative energy and associated RMS gradient norm variations associated to the thermal syn dehydrohalogenation of 1-chlorohexane. The changes evidenced by the RMS gradient reveals seven regions (a–g) along the reaction path where the main chemical events (e.g., bond breaking/formation) take place. The relative positions of selected points along the reaction path are indicated on the RMS curve. Activation path is defined by region a: points −80 to −47, region b: points −47 to −34, region c: points −34 to −9, and region d: points −9 to 0 (TS). Deactivation path is associated to region e: points 0(TS) to 5, region f: points 5 to 12, and region g: points 12 to 80.

image file: c5ra10152b-f4.tif
Fig. 4 Variation of main interatomic distances at the reaction center of the thermal dehalogenation of 1-chlorohexane along the IRC path. The seven regions (a–g) associated to the key chemical events (e.g., bond breaking/formation) are indicated. The position of selected points are shown on the top Cl–Cα bond variation.

In region a, points −80 to −47, conformational changes associated to the rotation of the Cβ atom are observed. Within this region, the Cl–Cα–Cβ–Hβ dihedral angle (see Scheme 1) decreases 20.7° from its observed value (−46.3°) in the reactant structure of 1-chlorohexane (point −80). This region is associated to conformation activation of the system. Region b, points −47 to −34, features the elongation of the Cα–Cl bond from 1.86 Å to 2.09 Å, distance at which this bond starts to be weakness. The Cl–Cα–Cβ–Hβ dihedral angle decreases to −21.4°. Within region c, points −34 to −9, the large variation of the RMS is associated to the rotation of the Cβ center that closes the Hβ atom to the catalytic plane of reaction. This preparation key is essential for the late migration of the hydrogen. At the end of region c (point −9) the Cα–Cl distance has increased to 2.51 Å, whereas the Cl–Cα–Cβ–Hβ dihedral angle reaches −4.7°. The Cα–Cβ bond distance remains essentially around 1.52 Å along the regions (a) to (c). The Cβ–Hβ bond distance, almost constant in 1.09 Å from points −80 to −23 (IRC = −2.503 amu1/2 Bohr) is slightly increased to 1.13 Å at the end of region c. It is clear that most of the activation energy is associated to the breaking of the Cl–Cα bond in region c, but also to the concerted conformational rearrangement occurring at center Cβ. This is the key event that can be associated to any catalytic action on the Cβ center,2,4,9,10 which promotes that the Hβ be oriented on the same plane that the Cl–Cα–Cβ fragment. In region d, points −9 to 0, the RMS quickly decreases while the Cβ–Hβ distance readily increases to 1.24 Å, reaching the quasi-planar transition structure, which indeed features a Cl–Cα–Cβ–Hβ dihedral angle of −3.1° (see Fig. 1). It should be emphasized that on the tiny region d on the top of the activation barrier, the Cl–Cα bond is already broken. Up to this point the Cl–Cα bond breaking can be identified as the first stage of the entire reaction process, which occurs before the TS configuration be reached on the reaction path. It can be observed that region d point out the starting of the second stage of the reaction process, i.e., the breaking of the Hβ–Cβ bond and the hydrogen migration to form Hβ–Cl. In fact, most of the second stage occurs on the deactivation pathway. We note that region e, points 0 to 5, with a noticeable increase in the RMS, is mainly characterized by the migration of the β hydrogen, i.e., Cβ–Hβ distance increases to 1.65 Å, and the Hβ–Cl distance becomes 1.48 Å, while the Cα–Cβ bond decreases to 1.36 Å, and the Cl–Cα–Cβ–Hβ dihedral has evolved to −2.19°. The maximum of the RMS on the deactivation path is reached at point 9 on the region f (points 5 to 12). At the end of this region, the Cα–Cβ bond has reached the distance of a carbon–carbon double bond (i.e., 1.34 Å), whereas the Hβ–Cl bond just starts to be formed (i.e., 1.32 Å). The dihedral within this region is −1.44°. Region g, points 12 to 80, corresponds in fact to the separation of reaction products. It is clear that within these conditions, the Hβ–Cl bond leaves out perpendicular to the Cα–Cβ double bond. We note indeed that the equilibrium distance for Hβ–Cl (i.e., 1.29 Å) is already reached at point 19, IRC = 2.066.

In order to further characterize the evolution of the bonding pattern along the reaction path, Table 2 reports the electron populations of the most significant ELF valence basins (i.e., those at the catalytic reaction center) for selected points along the IRC. The ELF topological analysis along a reaction path help us to understand the key driven bonding changes. In the following paragraphs, the topological analysis of the most relevant points associated with the breaking of the Cl–Cα and Hβ–Cβ single bonds, and formation of the Cα–Cβ double bond and Cl–Hβ single bond along the IRC of the reaction of thermal decomposition of 1-chlorohexane is discussed.

Table 2 ELF valence (V) basin populations (in number of electrons) at the reaction center of the thermal decomposition of 1-chlorohexane, for specific points along the IRC. The corresponding interatomic distances d are reported in angstroms, Å
Pointa V(Cl,Cα) V(Cα,Cβ) V(Hβ,Cβ) V(Hβ) V(Hβ,Cl) V(Cl) d(Cl–Cα) d(Cα–Cβ) d(Hβ–Cβ) d(Hβ,Cl)
a The reaction mechanism is proposed to be understood in terms of a two-stage one-step reaction process. The Cl–Cα bond breaking (first stage, points −47 to −9) occurring before the TS position, is followed by a feasible Hβ migration associated with the top of the energy barrier (second stage, points −9 to 9), and the evolution of the products as separated species.
−80 1.30 1.93 2.02 6.48 1.808 1.519 1.089 2.833
−51 1.28 1.93 2.01 6.51 1.821 1.531 1.089 2.726
−47 1.20 1.94 2.01 6.56 1.870 1.534 1.089 2.722
−34 0.85 1.99 1.98 6.83 2.095 1.519 1.091 2.647
−29 0.72 2.01 1.97 6.93 2.182 1.511 1.087 2.606
−23 0.59 2.04 1.95 7.04 2.284 1.500 1.088 2.545
−17 0.47 2.07 1.91 7.14 2.379 1.483 1.091 2.461
−12 0.39 2.11 1.86 7.23 2.447 1.462 1.095 2.361
−11 0.38 2.12 1.84 7.24 2.459 1.456 1.097 2.337
−10 0.36 2.13 1.83 7.26 2.470 1.451 1.100 2.310
−9 2.14 1.81 7.63 2.480 1.445 1.103 2.282
−8 2.16 1.79 7.62 2.490 1.440 1.107 2.252
−7 2.17 1.77 7.63 2.498 1.434 1.113 2.220
−6 2.19 1.75 7.63 2.506 1.428 1.120 2.187
−5 2.20 1.72 7.63 2.514 1.422 1.129 2.152
−4 2.23 2.69 7.64 2.520 1.416 1.141 2.115
−3 2.25 1.65 7.66 2.526 1.410 1.157 2.076
−2 2.27 1.61 7.67 2.531 1.405 1.180 2.034
−1 2.30 1.57 7.68 2.536 1.399 1.207 1.989
0 2.34 1.51 7.70 2.541 1.394 1.240 1.941
1 2.37 1.47 7.69 2.545 1.389 1.274 1.895
2 2.42 1.40 7.69 2.550 1.384 1.313 1.847
3 2.49 1.31 7.68 2.554 1.379 1.356 1.796
4 2.59 1.21 7.68 2.559 1.375 1.399 1.745
5 2.71 1.08 7.66 2.563 1.370 1.446 1.694
6 3.14 0.66 7.64 2.567 1.366 1.495 1.641
7 3.20 0.62 7.60 2.571 1.363 1.547 1.587
8 3.23 0.63 7.54 2.574 1.359 1.600 1.533
9 3.25 0.68 7.46 2.578 1.356 1.654 1.479
10 3.28 1.66 6.45 2.583 1.352 1.708 1.425
11 3.29 1.70 6.39 2.589 1.348 1.761 1.375
12 3.31 1.74 6.34 2.597 1.344 1.811 1.330
13 3.33 1.75 6.30 2.611 1.338 1.844 1.309
14 3.33 1.76 6.30 2.626 1.335 1.864 1.302
15 3.34 1.77 6.28 2.641 1.333 1.882 1.299
27 3.36 1.77 6.26 2.826 1.330 2.045 1.290
45 3.35 1.76 6.28 3.092 1.331 2.197 1.295
80 3.37 1.76 6.25 3.538 1.332 2.519 1.291


Analysis of the electron localization function (ELF) along the reaction path, and the nature of bonding at the transition structure. Although the formal physical meaning of an ELF basin is still unclear,67,68 there exist computational evidence supporting the usefulness of a topological-based population analysis resulting from the integration of the electron density in ELF basins (i.e., electronic basin populations) in order to get deeper understanding about the nature of chemical bonding. In Table 2, we focus our attention only within the localization domains of ELF associated to the reaction center (i.e., Cl–Cα–Cβ–Hβ) evolving along the different regions a–g of the reaction path. ELF topological analysis of points in the regions a and b exhibits two pairs of disynaptic basins. V(Cl,Cα) and V(Cα,Cβ) associated to the single bonds Cl–Cα and Cα–Cβ, whose electron basin populations drastically decreases from 1.30e to 0.85e, and increases slightly from 1.93e to 1.99e, respectively. Within these regions (a + b), the lone pairs on chlorine in each point appears represented by three valence monosynaptic basins V(Cl) showing integrated electron populations increasing from 6.48e to 6.83e. There is also a disynaptic protonated basin V(Hβ,Cβ) with an integrated population that remains essentially constant in 2.02e to 1.98e within this region. Region (c) is mainly associated to the weakness of the Cl–Cα bonding region. The disynaptic basin population corresponding to the V(Cl,Cα) decreases from 0.85e (point −34) to 0.36e (point −10). The three monosynaptic basins V(Cl) integrates populations that varies from 6.83e (point −34) to 7.63e (point −5). The disynaptic basin V(Cl, Cα) is absent thereafter along the reaction path, indicating that the Cl–Cα single bond can be considered effectively broken after point −9 on the activation part of the reaction path. These results allow us to strongly considerer the first stage of thermal dehalogenation to be concerned with evolution of the electronic process from point −47 to point −9 along the IRC reaction pathway. Arbitrarily the second stage concerning main electronic changes will be associated to points −9 to +9. Both stages refer to regions where key electronic changes driving the transformation take place. Note that from point −34 to point −5, the population associated to the disynaptic basin V(Cα,Cβ) increases from 1.99e to 2.20e, whereas the population integrated in the disynaptic protonated basin V(Hβ,Cβ) decreases from 1.98e to 1.72e. The attractor corresponding to the forming double bond localizes out of the line connecting the carbon center cores. This topology for the Cα–Cβ region remains unchanged until point 12 in region g. At the top of the energy barrier, within the entire interval IRC = (−0.97962, +0.97971), i.e., point −9 to point 9, we observe an isolated electron localization region integrating to 7.64e which is associated to the migrating chlorine center. This picture, on the top of the barrier, corresponds to a lonely chlorine atom bearing an electronic charge of −0.64 while evolving to the encounter of the Hβ center. Thereafter, within the tiny region d four valence monosynaptic basins V(Cl) associated to the negatively charged chlorine center adopt a tetrahedral conformation, with an increasing in the population from 7.64e to 7.70e. In this region the valence basins populations for V(Cα,Cβ) and V(Hβ,Cβ) varies from 2.41e to 2.34e, and from 1.81e to 1.51e, respectively. The migrating chlorine center develops thus a maximum charge of −0.71 at the transition structure (point 0). ELF picture of bonding reveals that activation events are mainly associated to conformational changes in preparation of the reaction center (region a), followed by the breaking of the Cl–Cα bond (regions b and c), and the start of the migration of Hβ atom with the associated bonding changes at Cα–Cβ–Hβ moiety (regions c and d). Regarding the deactivation pathway, within the region e, three valence monosynaptic basins associated to the chlorine atom, V(Cl), evolve with almost constant population integrating to 7.69e to 7.66e. The V(Cα,Cβ) population increases from 2.37e to 2.71e, while the V(Hβ,Cβ) population varies from 1.47e to 1.08e. A relevant topological change along region f occurs, i.e., no disynaptic basin associated to V(Hβ,Cβ) can be localized (see point 6, Table 2). Indeed, an isolated Hβ electron localization region integrating 0.66e (point 6) to 0.68e (point 9) is observed within this region on the deactivation pathway. The Hβ–Cβ single bond can be considered effectively broken. In this tiny interval on the path both Hβ and Cl centers evolves as isolated and independent electronic domains of electron pairs with net topological electronic charges varying from +0.34 to +0.32, and from −0.65 to −0.47, respectively. At the end of region f, other notable topological change is evidenced, i.e., a new valence disynaptic basin V(Cl,Hβ) can be located, indicating that formation of the new Cl–Hβ single bond has already begun. The corresponding basin population increases from 1.66e (point 10) to 1.74e (point 12). The basin populations for V(Cα,Cβ) and V(Cl) changes in this short region from 3.28e to 3.31e, and from 6.45e to 6.34e, respectively. The ELF picture of bonding reflects the formation of the Cl–Hβ bond. Finally, in region g, two attractors (instead one) become associated to the forming double bond between Cα and Cβ, with corresponding basin populations fluctuating in the interval of 3.33e to 3.37e, whereas evolving towards the formation of 1-hexene. In this case, the V(Cl,Hβ) and V(Cl) populations stabilizes in the range 1.75e to 1.76e, and 6.30e to 6.28e, respectively. The picture of bonding in region f simply corresponds to the evolution of products 1-hexene and Hβ–Cl as separated molecular species. A schematic picture summarizing the main bonding changes along the selected points involved in this reaction is introduced in Scheme 2.


image file: c5ra10152b-s2.tif
Scheme 2 Schematic brief representation of the dominating topology of the electron localization function (ELF) associated to the reaction center of the thermal decomposition of 1-chlorohexane in the gas phase via a four-membered planar transition structure (TS). Symbols image file: c5ra10152b-u1.tif, image file: c5ra10152b-u2.tif, and image file: c5ra10152b-u3.tif, represents core, valence disynaptic, and valence monosynaptic basins, respectively. Protonated basins are indicated as single lines connecting to the H atoms. Note that Cl–Cα bond breaking occurs along the region c, and the top of the barrier, both activation and deactivation (i.e., points −9 to +9), features the migration of the Hβ center. At the TS (point 0) the chlorine atom is observed as an isolated domain of localization.

The ELF topology at the TS reveals a negative charge accumulation of −0.71 in the localization region associated to the Cl atom. No disynaptic attractors connect this region with other fragments. Remarkably, it can be noted that the migrating Hβ can be effectively associated to the disynaptic region V(Hβ,Cβ) in the configuration of the TS. A detailed view of the evolution of the electron localization function in the plane of the Hβ–Cβ–Cα is revealed in Fig. 5. This figure represents colour-filled maps of the ELF in the interval defined between the points −9 to +9, associated to the second stage of the reaction process. Note that in fact, the migrating Hβ center remains always essentially interacting with the V(Cα,Cβ) localization domain at the TS.


image file: c5ra10152b-f5.tif
Fig. 5 Colour-filled maps of the electron localization function (ELF) in the reaction center for configurations in the interval defined between the points −9 to +9 on the top of the energy barrier (i.e., regions d–f), associated to the here defined second stage of the thermal reaction dehalogenation process. The ELF values (0 to 1) are mapped on a red-green-blue colour scale indicated on the left of each representation. Note that the Cl–Cα bond is already broken at point −9, and that the V(Cl) basin evolves as an independent localization basin towards the encounter of the migrating Hβ atom. Along this stage, the Hβ localization region is observed in continuous interrelation (ELF > 0.75) with the V(Cα,Cβ) basin associated to the Cα–Cβ double bond formation. Note that point 6 within the tiny region f (points 5 to 9) on the deactivation path, reveals in fact the existence of independent isolated monosynaptic basins that can be properly associated to both the chlorine and the migrating hydrogen centers. A video file presenting the “evolution” of the ELF pattern of bonding in the reaction center along the IRC path, from points −50 to 20, is available for detailed examination as ESI.

In order to quantify the evolution of bonding pattern, the progress of the thermal decomposition of 1-chlorohexane has been followed using the Wiberg bond indices Bij. These constitute a measure of the bond order or bond strength between two atomic centers i and j. The relative variation of the bond index at a given point k on the IRC path, δBijk, for each pair ij, can be obtained from δBijk = (BijkBRij)/(BPijBRij), where the superscripts R, and P refer to the reactant and the product of the reaction, respectively.69 The degree of “evolution” of bonding at the k-th point along the reaction path can be thereafter calculated from the average value of {δBijk}, i.e., δBavk = (1/n)∑δBijk, where n is the number of bonds involved in the reaction center. A value of 0.5 will indicate perfect concertedness. These quantities are indeed suitable to calculate an index of synchronicity (SY) for the complete reaction, SYk = 1 − (2n − 2)−1∑|δBijkδBavk|/δBavk, which vary between zero (i.e., an asynchronous process) and unity (i.e., a concerted synchronic reaction).70–75 Higher values of this index are indicative of cases where all bonds implicated in the reaction center have broken or formed at the same extent in the k-th selected point along the reaction path. Table 3 reports the Wiberg bond order and the percentage of evolution (100δBijk) along the reaction path associated to the four interatomic distances at the reaction center at key points of the IRC. Fig. 6 plots the percentage of evolution vs. the average bond index. These results clearly quantify the early nature the Cl–Cα bond breaking. For instance, at the TS position this bond advanced 65%, followed by the breaking of the Hβ–Cβ bond (40.2%), the formation of the double bond Cα–Cβ (33.6%), and finally, the formation of the Hβ–Cl bond (22.6%). The synchronicity of these bonding changes at the TS is 0.80, i.e., the reaction is slightly asynchronous. Note however, that in the average, the position of TS is associated only to a 40.3% of advancement of the complete reaction.

Table 3 Wiberg bond order (first entry) and percentage of evolution (100δBijk) (second entry) for selected points along the IRC of the thermal decomposition of 1-chlorohexane in the gas phase
Point, k Cl–Cα Cα–Cβ Hβ–Cβ Hβ–Cl δBavka
a Formally, this quantity can be considered a measured of the advancement of the reaction.
−80 1.34587 1.12432 0.88833 0.02362 0.000
  0.0 0.0 0.0 0.0  
−47 1.30804 1.11309 0.88625 0.03061 0.006
  2.9 −1.3 0.2 0.6  
−34 1.14796 1.13631 0.87505 0.04004 0.050
  15.4 1.4 1.6 1.5  
−23 1.01879 1.16103 0.85888 0.05359 0.090
  25.4 4.2 3.5 2.7  
−5 0.71459 1.28172 0.71788 0.14245 0.245
  49.0 18.2 20.0 10.9  
0 0.50951 1.41505 0.54591 0.27155 0.403
  65.0 33.6 40.2 22.6  
5 0.35284 1.60406 0.33496 0.52187 0.607
  77.2 55.4 64.9 45.5  
9 0.28288 1.75337 0.19955 0.79486 0.766
  82.6 72.7 80.8 70.4  
12 0.24144 1.84281 0.13411 0.97675 0.861
  85.8 83.0 88.4 87.1  
19 0.20029 1.90597 0.09474 1.04446 0.914
  89.0 90.3 93.1 93.2  
80 0.05879 1.98959 0.03549 1.11843 1.000
  100.0 100.0 100.0 100.0  


image file: c5ra10152b-f6.tif
Fig. 6 Percentage of evolution for Wiberg bond orders (100δBijk) at the reaction center versus the average bond index δBavk for the thermal decomposition of 1-chlorohexane in the gas phase. The position of selected points k along the IRC are indicated on the bottom X axis, which indeed represents the advancement of the reaction. Note that the asynchronous TS is slightly early on the reaction path. Also, note that at the catalytic reaction center, the Cl–Cα bond breaking constitutes always the more advanced event driving the decomposition.

We have finally to note that the ELF picture of charge separation in the transition structure is consistent with other wave function based population analysis. For instance, the atomic charges predicted at the reaction center using Hirschfeld and NBO partitions are respectively −0.641 and −0.643 for Cl; +0.104, and −0.052 for Cα, −0.033 and −0.513 for Cβ, and +0.092 and +0.419 for Hβ. In the gas phase, the catalytic effects,2,4,9,10 on polar reaction processes can be certainly traced out to the charge stabilization that substituents at α to β positions introduces on the planar center of reaction reached in the top of the energy barrier configurations.2,7,9,10,12,14,16,18,24,27,55,58,71,76 The thermal decomposition seems better and properly described in terms of a two stage one step reaction process.

Non covalent interactions in the TS

Fig. 7 shows a plot of the reduced density gradient (s) versus the electron density ρ multiplied by the sign of the second hessian eigenvalue for the transition structure of the thermal decomposition of 1-chlorohexane. Favourable (attractive or bonding) interactions appear on the left, while unfavourable (nonbonding) on the right, and very weak van der Waals interactions near zero. Fig. 8 depicts reduced gradient isosurface (s = 0.4) for the transition structure of the thermal decomposition of 1-chlorohexane in the gas phase. The strength of the NCI is proportional to the density on the NCI surface. The surfaces are coloured on a red-green-blue (RGB) scale according to values of sign(λ2)ρ ranging from −0.05 to 0.05 au. Blue indicate strong attractive bonding noncovalent interactions, and red indicates strong repulsive steric overlaps. These results reveal (in blue) two strong attractive NCI are clearly associated to the Cl–Hβ bond formation as well as the Cl–Cα bond breaking regions, whereas one strong (steric) repulsive NCI remain located (in red) at the center of the four membered cyclic TS. The noncovalent stabilizing interaction associated to Cl–Hβ is clearly stronger than those associated to the Cl–Cα. Fig. 8 also reveals weak van der Waals interactions (in green) in the TS configuration between hydrogen atoms bonded at Cδ and Cα, and between the migrating chlorine and one hydrogen atom bonded at Cδ, featuring the observed syn-elimination path.
image file: c5ra10152b-f7.tif
Fig. 7 Plot of the reduced density gradient (s) versus the electron density ρ multiplied by the sign of the second Hessian eigenvalue sign(λ2) for the transition structure of the thermal decomposition of 1-chlorohexane. Results were obtained on a cuboid grid using the density and gradient values at the DFT M05-2X/6-311+G(d,p) level of theory. The strength of the interaction is proportional to the value of ρ. Favorable (attractive or bonding) interactions are associated to negative X-axis values (blue), whereas unfavorable (nonbonding) are associated to positive X-axis values (red). The very weak (both attractive or repulsive) van der Waals interactions are located near zero.

image file: c5ra10152b-f8.tif
Fig. 8 Isosurface (s = 0.4) of the reduced density gradient generated for the transition structure of the thermal decomposition of 1-chlrohexane. Results were obtained on a cuboid grid using the density and gradient values at the DFT M05-2X/6-311+G(d,p) level of theory. The values of sign(λ2)ρ ranging from −0.04 to 0.04 au are mapped on the gradient isosurface using a blue-green-red color scale. Blue color denotes strong attractive noncovalent bonding interactions and red color reveals strong nonbonded steric noncovalent overlaps. The very weak (both attractive or repulsive) van der Waals interactions are depicted on this scale in green color.

Conclusions

The precedent analysis provides new insights concerning the nature of bonding driving the thermal decomposition reaction of 1-chlrohexane in the gas phase. The ELF topological analysis allows clearly establishing that reaction can be considered to take place through a two-stage one-step polar mechanism via a slightly asynchronous polar and quasi-planar transition structure. Given the well known inductive and resonance effects that substituents introduce on these type of thermal eliminations, the conclusions here drawn are presumably extensible to analogue systems.2,7,9,10,12,14,16,18,24,27,55,58,71,76 It is expected that catalytic effects will be concerned almost exclusively with those factors that affects the charge polarization due to the departure of the chlorine atom from the Cα center and the attaining of the planar configuration of the reaction center.2,4,9,10 However, the effects of the top of the barrier cannot be completely ignored. Results evidence that the first important stage of the reaction corresponds in fact to the breaking of the Cl–Cα bond, which occurs along the activation region, certainly earlier than the polar transition structure be reached. The second chemically significant stage corresponds to the Hβ–Cβ bond breaking with the fast subsequent Cl–Hβ bond formation. The second stage is located on a tiny region on the top of the barrier, earlier the TS configuration and extending beyond the position of the transition structure over the deactivation pathway. Finally, we reveal for the first time the existence of both strong favourable and destabilizing noncovalent interactions at the polar transition structure proposed for this type of gas-phase thermal decomposition. The stronger favourable NCI are located in the bonding region associated to the formation of the new bond Cl–Hβ, whereas the steric repulsive NCI is associated to the four membered cyclic configuration of the TS.

Acknowledgements

We thank the continuous support provided by Fondecyt (Chile) grant numbers 1140343 (EC), 1140341 (PP) and 11130589 (MD-N), and the Millennium Science Initiative Nucleus No. 120082 (Chile). We thank the financial support provided by Universidad Nacional de Colombia, Vicerretoría de investigación, through “Programa Nacional de Semilleros de Investigación, Creación e Innovación – 2015”. EC and PP thanks the Universidad Andres Bello (UNAB) for continuous support through research grants DI-806-15/R and DI-793-15/R, respectively.

References

  1. A. Maccoll, Chem. Rev., 1969, 69, 33 CrossRef .
  2. G. Chuchani, I. Martin, A. Rotinov, J. A. Hernandez and N. Reikonnen, J. Phys. Chem., 1984, 88, 1563 CrossRef CAS .
  3. J. L. Toto, G. O. Pritchard and B. Kirtman, J. Phys. Chem., 1994, 98, 8359 CrossRef CAS .
  4. J. Nisar, I. A. Awan, M. Humayun, T. Ahmad and A. Shakoor, J. Chem. Soc. Pak., 2006, 28, 417 CAS .
  5. L. Zhu, J. G. Simmons, M. O. Burgin, D. W. Setser and B. E. Holmes, J. Phys. Chem. A, 2006, 110, 1506 CrossRef CAS PubMed .
  6. J. Lezama, E. Márquez, J. R. Mora, T. Cordova and G. Chuchani, J. Mol. Struct.: THEOCHEM, 2009, 916, 17 CrossRef CAS PubMed .
  7. A. Maldonado, J. R. Mora, T. Cordova and G. Chuchani, J. Mol. Struct.: THEOCHEM, 2010, 961, 55 CrossRef CAS PubMed .
  8. A. Shiroudi and E. Zahedi, Chin. J. Struct. Chem., 2011, 30, 858 CAS .
  9. R. M. Dominguez, A. Rotinov and G. Chuchani, J. Phys. Chem., 1986, 6277 CrossRef CAS .
  10. G. Chuchani, A. Rotinov, I. Martin, I. Avila and R. M. Dominguez, J. Phys. Chem., 1985, 89, 4134 CrossRef CAS .
  11. G. Chuchani, A. Rotinov, R. M. Dominguez and I. Martin, J. Phys. Org. Chem., 1996, 9, 348 CrossRef CAS .
  12. O. Brea, M. Lorono, E. Márquez, J. R. Mora, T. Cordova and G. Chuchani, Int. J. Quantum Chem., 2012, 112, 2504 CrossRef CAS PubMed .
  13. D. R. Burgess and J. A. Manion, Int. J. Chem. Kinet., 2012, 44, 369 CrossRef CAS PubMed .
  14. J. R. Mora, J. Lezama, N. Berroteran, T. Cordova and G. Chuchani, Int. J. Quantum Chem., 2012, 112, 3729 CrossRef CAS PubMed .
  15. N. Ahubelem, M. Altarawneh and B. Z. Dlugogorski, Tetrahedron Lett., 2014, 55, 4860 CrossRef CAS PubMed .
  16. M. Luiggi, J. R. Mora, M. Lorono, E. Márquez, J. Lezama, T. Cordova and G. Chuchani, Comput. Theor. Chem., 2014, 1027, 165 CrossRef CAS PubMed .
  17. V. Saheb, Struct. Chem., 2014, 25, 21 CrossRef CAS .
  18. J. Lezama, R. M. Dominguez and G. Chuchani, Int. J. Chem. Kinet., 2015, 47, 104 CrossRef CAS PubMed .
  19. J. Quijano, P. Ruiz, R. Notario, E. Zapata and J. Gaviria, Int. J. Chem. Kinet., 2014, 46, 363 CrossRef CAS PubMed .
  20. V. López, J. Quijano, S. Luna, P. Ruiz, D. Rios, W. Parra, E. Zapata, J. Gaviria and R. Notario, Struct. Chem., 2013, 24, 1811 CrossRef .
  21. E. Chamorro, P. Pérez and L. R. Domingo, Chem. Phys. Lett., 2013, 582, 141 CrossRef CAS PubMed .
  22. P. Pérez and E. Chamorro, Lett. Org. Chem., 2011, 8, 88 CrossRef .
  23. L. R. Domingo, E. Chamorro and P. Pérez, Org. Biomol. Chem., 2010, 8, 5495 CAS .
  24. L. R. Domingo, E. Chamorro and P. Pérez, Lett. Org. Chem., 2010, 7, 432 CrossRef CAS .
  25. E. Velez, J. Quijano, R. Notario, E. Pabon, J. Murillo, J. Leal, E. Zapata and G. Alarcon, J. Phys. Org. Chem., 2009, 22, 971 CrossRef CAS PubMed .
  26. L. R. Domingo, E. Chamorro and P. Pérez, J. Phys. Chem. A, 2008, 112, 4046 CrossRef CAS PubMed .
  27. L. R. Domingo, E. Chamorro and P. Pérez, J. Org. Chem., 2008, 73, 4615 CrossRef CAS PubMed .
  28. E. Chamorro, R. Notario, J. C. Santos and P. Pérez, Chem. Phys. Lett., 2007, 443, 136 CrossRef CAS PubMed .
  29. A. D. Becke and K. E. Edgecombe, J. Chem. Phys., 1990, 92, 5397 CrossRef CAS PubMed .
  30. A. Savin, A. D. Becke, J. Flad, R. Nesper, H. Preuss and H. G. Vonschnering, Angew. Chem., Int. Ed., 1991, 30, 409 CrossRef PubMed .
  31. E. R. Johnson, S. Keinan, P. Mori-Sánchez, J. Contreras-García, A. J. Cohen and W. Yang, J. Am. Chem. Soc., 2010, 132, 6498 CrossRef CAS PubMed .
  32. A. Savin, R. Nesper, S. Wengert and T. F. Fassler, Angew. Chem., Int. Ed., 1997, 36, 1809 CrossRef PubMed .
  33. A. Savin, B. Silvi and F. Colonna, Can. J. Chem., 1996, 74, 1088 CrossRef CAS .
  34. B. Silvi, J. Mol. Struct., 2002, 614, 3 CrossRef CAS .
  35. E. Matito, B. Silvi, M. Durán and M. Sòla, J. Chem. Phys., 2006, 125, 024301 CrossRef PubMed .
  36. F. Feixas, E. Matito, M. Durán, M. Sòla and B. Silvi, J. Chem. Theory Comput., 2010, 6, 2736 CrossRef CAS .
  37. R. Ponec and J. Chaves, J. Comput. Chem., 2005, 26, 1205 CrossRef CAS PubMed .
  38. P. W. Ayers, J. Chem. Sci., 2005, 117, 441 CrossRef CAS .
  39. M. J. Frisch, et al., Gaussian 09, Revision C.01, Gaussian, Inc., Wallingford CT, 2010, full details provided as ESI.
  40. D. G. Truhlar, B. C. Garrett and S. J. Klippenstein, J. Phys. Chem., 1996, 100, 12771 CrossRef CAS .
  41. D. A. McQuarrie and J. D. Simon, Physical Chemistry: A Molecular Approach, University Science Books, Sausalito, California, 1997 Search PubMed .
  42. D. A. McQuarrie and J. D. Simon, Molecular Thermodynamics, University Science Books, Sausalito, California, 1999 Search PubMed .
  43. H. P. Hratchian and H. B. Schlegel, in Theory and Applications of Computational Chemistry: The First 40 Years, ed. C. E. Dykstra, G. Frenking, K. S. Kim and G. Scuseria, Elsevier, Amsterdam, 2005, p. 195 Search PubMed .
  44. H. P. Hratchian and H. B. Schlegel, J. Chem. Theory Comput., 2005, 1, 61 CrossRef CAS .
  45. K. Fukui, Acc. Chem. Res., 1981, 14, 363 CrossRef CAS .
  46. A. E. Reed, L. A. Curtiss and F. Weinhold, Chem. Rev., 1988, 88, 899 CrossRef CAS .
  47. F. Weinhold and C. R. Landis, Valency and Bonding. A Natural Bond Orbital Donor-Acceptor Perspective, Cambridge University Press, 2005 Search PubMed .
  48. S. Noury, X. Krokidis, F. Fuster and B. Silvi, Comput. Chem., 1999, 23, 597 CrossRef CAS .
  49. J. Contreras-Garcia, E. R. Johnson, S. Keinan, R. Chaudret, J.-P. Piquemal, D. N. Beratan and W. Yang, J. Chem. Theory Comput., 2011, 7, 625 CrossRef CAS PubMed .
  50. E. R. Johnson, S. Keinan, P. Mori-Sánchez, J. Contreras-Garcia, A. J. Cohen and W. Yang, J. Am. Chem. Soc., 2010, 132, 6498 CrossRef CAS PubMed .
  51. W. Humphrey, A. Dalke and K. Schulten, J. Mol. Graphics, 1996, 14, 33 CrossRef CAS .
  52. T. Lu, J. Comput. Chem., 2012, 33, 580 CrossRef CAS PubMed .
  53. E. Chamorro, J. Chem. Phys., 2003, 118, 8687 CrossRef CAS PubMed .
  54. L. R. Domingo, J. A. Saéz and S. R. Emamian, Org. Biomol. Chem., 2015, 13, 2034 CAS .
  55. L. R. Domingo, M. J. Aurell and P. Pérez, RSC Adv., 2014, 4, 16567 RSC .
  56. L. R. Domingo, M. J. Aurell and P. Pérez, Org. Biomol. Chem., 2014, 12, 7581 CAS .
  57. L. R. Domingo, RSC Adv., 2014, 4, 32415 RSC .
  58. L. R. Domingo, J. A. Saéz and M. Arno, RSC Adv., 2012, 2, 7127 RSC .
  59. E. M. Brasil, R. S. Borges, O. A. S. Romero, C. N. Alves, J. A. Saéz and L. R. Domingo, Tetrahedron, 2012, 68, 6902 CrossRef CAS PubMed .
  60. A. Toro-Labbé, S. Gutierrerez-Oliva, J. S. Murray and P. Politzer, Mol. Phys., 2007, 105, 2619 CrossRef PubMed .
  61. E. Echegaray and A. Toro-Labbé, J. Phys. Chem. A, 2008, 112, 11801 CrossRef CAS PubMed .
  62. D. Yepes, J. S. Murray, P. Pérez, L. R. Domingo, P. Politzer and P. Jaque, Phys. Chem. Chem. Phys., 2014, 16, 6726 RSC .
  63. D. Yepes, J. S. Murray, J. C. Santos, A. Toro-Labbé, P. Politzer and P. Jaque, J. Mol. Model., 2013, 19, 2689 CrossRef CAS PubMed .
  64. P. Politzer, J. S. Murray and P. Jaque, J. Mol. Model., 2013, 19, 4111 CrossRef CAS PubMed .
  65. D. Yepes, J. S. Murray, P. Politzer and P. Jaque, Phys. Chem. Chem. Phys., 2012, 14, 11125 RSC .
  66. R. Thom, Structural Stability and Morphogenesis (An Outline of a General Theory of Models), Benjamin/Cummings Publishing Co., Reading, Mass., 1980 Search PubMed .
  67. A. Savin, J. Chem. Sci., 2005, 117, 473 CrossRef CAS .
  68. A. Savin, J. Mol. Struct.: THEOCHEM, 2005, 727, 127 CrossRef CAS PubMed .
  69. A. Moyano, M. A. Pericas and E. Valenti, J. Org. Chem., 1989, 54, 573 CrossRef CAS .
  70. R. Notario, J. Quijano, J. C. Quijano, L. P. Gutierrez, W. A. Suarez, C. Sánchez, L. A. Leon and E. Chamorro, J. Phys. Chem. A, 2002, 106, 4377 CrossRef CAS .
  71. J. Quijano, R. Notario, E. Chamorro, L. A. Leon, C. Sánchez, G. Alarcon, J. C. Quijano and G. Chuchani, J. Phys. Org. Chem., 2002, 15, 413 CrossRef CAS PubMed .
  72. L. A. Leon, R. Notario, J. Quijano, E. Velez, C. Sánchez, J. C. Quijano and N. Al-Awadi, Theor. Chem. Acc., 2003, 110, 387 CrossRef CAS .
  73. R. Notario, J. Quijano, L. A. Leon, C. Sánchez, J. C. Quijano, G. Alarcon, E. Chamorro and G. Chuchani, J. Phys. Org. Chem., 2003, 16, 166 CrossRef CAS PubMed .
  74. C. Quijano, R. Notario, J. Quijano, C. Sánchez, L. A. Leon and E. Velez, Theor. Chem. Acc., 2003, 110, 377 CrossRef CAS .
  75. J. Murillo, D. Henao, E. Velez, C. Castano, J. Quijano, J. Gaviria and E. Zapata, Int. J. Chem. Kinet., 2012, 44, 407 CrossRef CAS PubMed .
  76. E. Chamorro, J. Quijano, R. Notario, C. Sánchez, L. A. Leon and G. Chuchani, Int. J. Quantum Chem., 2003, 91, 618 CrossRef CAS PubMed .

Footnote

Electronic supplementary information (ESI) available: (S1) full details for ref. 39; (S2) Cartesian coordinates of the transition structure of the thermal dehalogenation of 1-chlorohexane calculated at the DFT M05-2X/6-311+G(d,p) level of theory are also reported; (S3) a video file (MP4 format) presenting the change of the electron localization function (ELF) pattern of bonding at the reaction center along the IRC path of the thermal dehalogenation of 1-chlorohexane calculated at the DFT M05-2X/6-311+G(d,p) level of theory, is available for further examination as ESI. The video presents colour-filled maps of ELF for configurations in the interval defined between the points −50 to +20 along the representative energy barrier (i.e., regions a–g). This information can be used for didactical purposes in studying in detail the two stages one step mechanism that we propose as a proper way of interpretation this polar reaction process in the gas phase. The ELF values (0 to 1) are mapped on a red-green-blue colour scale indicated on the left of each frame. See DOI: 10.1039/c5ra10152b

This journal is © The Royal Society of Chemistry 2015
Click here to see how this site uses Cookies. View our privacy policy here.