Influence of Ti4+ on the long lasting luminescence of Sr2SiO4:Eu2+

Karol Szczodrowski*a, Alicja Chruścińskab, Justyna Barzowskaa, Krzysztof Przegiętkab, Krzysztof Andersc, Ryszard Piramidowiczc and Marek Grinberga
aInstitute of Experimental Physics, University of Gdańsk, Wita Stwosza 57, 80-952 Gdańsk, Poland. E-mail: fizks@ug.edu.pl
bInstitute of Physics, Faculty of Physics, Astronomy and Informatics, Nicolaus Copernicus University, Grudziadzka 5/7, 87-100 Torun, Poland
cInstitute of Microelectronics and Optoelectronics, Warsaw University of Technology, Koszykowa 75, 00-662 Warsaw, Poland

Received 27th May 2015 , Accepted 17th July 2015

First published on 23rd July 2015


Abstract

The Sr2Si0.95Ti0.05O4:Eu2+ phosphor was synthesized using titanium modified silica SBA-15 or titania as titanium precursors via a solid state synthesis method. The phase composition of samples was investigated by powder XRD technique. The SEM pictures enabled study of the influence of Ti4+ precursors on the materials' morphology. The results of versatile optical characterization pointed out that titanium incorporation causes the extending of the persistent luminescence time and does not change the basic spectral properties of the parent phosphor. The persistent luminescence phenomenon results from the presence of point defects in the lattice (ion vacancies) that play a role in electron or hole traps. It was found that both the concentration and distribution of traps in Sr2Si0.95Ti0.05O4:Eu2+ depends on the form of the titanium precursor used in the synthesis. The trap parameters were characterized by thermoluminescence measurements and luminescence kinetics analysis.

Introduction

Despite decades of studies, optical materials exhibiting persistent luminescence attract the attention of researchers, mainly due to the broad range of potential applications, extending from decorative elements, emergency and traffic signs, to medical imaging and various diagnosis techniques. Since 1996, when Matsuzawa reported long lasting luminescence in SrAl2O4:Eu2+,Dy3+ phosphor,1 a large number of new materials based on oxide matrices doubly doped with Eu2+ and R3+ (R = Dy, Tm, Ho, Nd, Er) and exhibiting efficient persistent luminescence have been developed.2–7 It should be noted, however, that most of these enable obtaining luminescence in blue-green spectral region only, which makes the phosphors that emit in the remaining part of the visible spectral range (yellow-orange and red) specifically interesting. The yellow afterglow of Eu2+ can be observed in only a few oxide matrixes modified by halides to change the bond covalency between the ligands and activator, e.g.: Sr3Al2O5Cl2:Eu2+,Ce3+,8 Ca2BO3Cl:Eu2+,Dy3+[thin space (1/6-em)]9 and in pure oxides, such as Sr3SiO5:Eu2+,Er3+[thin space (1/6-em)]10 or Ca2ZnSi2O7:Eu2+,Dy3+.11 Recently, the efficient long lasting yellow luminescence was achieved in Sr2SiO4:Eu2+,Dy3+[thin space (1/6-em)]12 where the afterglow effect is dominated by the only one of two emission bands observed in this material, which is not common in persistent phosphors. In the case of the red emitting afterglow phosphors doped with Eu2+ the huge challenge is to achieve a sufficiently high crystal field of active ion environment, necessary for obtaining the red emission. Usually the high crystal field is observed in nitride compounds,13 synthesis of which require the highly reductive atmosphere as the commonly used nitride precursors tend to oxidize/decompose in high temperature. It should be emphasized, that in all these materials besides the main emitter of light (which is Eu2+ ion), also other lanthanide dopants are introduced as electron/hole traps, which causes additional costs.

In the literature there can be found also the reports on long lasting luminescent materials doped with transition metal ions,14,15 but the luminescence efficiency in such materials is relatively low comparing to those doped with Eu2+. Taking the all above mentioned facts into account it may be concluded that there is still a lot of room for research and development of new optical materials enabling persistent luminescence and investigation of effects supporting the effective transfer of charge carriers from the traps to the active ion. In this contribution the synthesis strategy, luminescence (excitation and emission spectra) as well as luminescence kinetics of a new material – Sr2Si0.95Ti0.05O4:Eu2+ are presented.

Experimental details

Synthesis and structural characterization

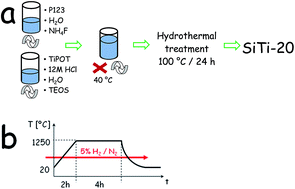
The investigated materials doped with Eu2+ (1% mol) and Ti4+ (5% mol) were synthesized using solid state synthesis method and different titanium precursors. Depending on the Ti4+ precursor the starting reagents were SrCO3 (99.995%) and Eu2O3 (99.999%) complemented by modified silica SiTi-20 in the case of sample A and SiO2 (99.995%) and TiO2 (99.8%) in the case of sample B. The SiTi-20 precursor was a mesoporous SBA-15 silica doped with 5 mol% of titanium. The sol–gel method was used for the synthesis of the precursor. Pluronic P123 and NH4F were stirred overnight with 1 M HCl to achieve the Sol 1. Then, tetraethoxy silane (TEOS) was mixed with appropriate amount of titanium isopropoxide and 1.14 ml 1 M HCl. The mixture was stirred for 1.5 h and yielded the Sol 2. When Sol 2 was added dropwise into Sol 1 and the whole mixture stirred vigorously at 40 °C for 3 h, a white precipitate formed in the container. The pH of the liquid suspension was adjusted to 8 by adding drop by drop a 28% ammonia solution. The molar ratio of TEOS[thin space (1/6-em)]:[thin space (1/6-em)]H2O[thin space (1/6-em)]:[thin space (1/6-em)]HCl[thin space (1/6-em)]:[thin space (1/6-em)]P123[thin space (1/6-em)]:[thin space (1/6-em)]NH4F in the initial gel was 1[thin space (1/6-em)]:[thin space (1/6-em)]184[thin space (1/6-em)]:[thin space (1/6-em)]3.4[thin space (1/6-em)]:[thin space (1/6-em)]0.015[thin space (1/6-em)]:[thin space (1/6-em)]0.028. The resulting mixture was continuously stirred at 40 °C for 20 h and then transferred into a Teflon autoclave for a subsequent hydrothermal treatment at 100 °C for 24 h. The filtrate collected was washed and dried overnight at 60 °C and then calcined at 540 °C for 6 h. The details of the precursor synthesis are described in ref. 16 and the scheme of the synthesis can be seen on Fig. 1a. All reagents used in this work were purchased from Sigma-Aldrich. To synthesize Sr2SiO4:Eu2+,Ti4+ materials, i.e. sample A and sample B, the appropriate amounts of the reagents were weighted to obtain following molar composition: Sr1.99Eu0.01Si0.95Ti0.05O4 and then thoroughly mixed together using tempered steel planetary ball mill (Fritsh, Pulverisette 6) with rotation speed 400 rpm. The obtained mixtures were calcined at 1250 °C for 4 h in a slight reductive atmosphere using a mixture of hydrogen (5 vol%) and nitrogen (95 vol%) in a tubular furnace (PRS 75WM, CZYLOK). The scheme of synthesis is shown on Fig. 1b.
image file: c5ra09999d-f1.tif
Fig. 1 Schemes of the synthesis of titanium modified silica SBA-15 (a) and all luminescent materials (b).

Moreover the strontium silicate samples doped only with Eu2+ ions at different concentration (0.5, 1, 2, 3% of mol) were synthesized to exhibit the influence of Ti4+ on the luminescent properties of Sr2SiO4:Eu2+ as well as to study the influence of europium concentration on the presence of afterglow luminescence phenomenon. The materials were obtained by solid state synthesis method using the same synthesis conditions and reagents except TiO2, as in the case of sample B. Since the strontium orthosilicate doped with 1% of Eu2+ had no detectable persistent luminescence we have chosen sample doped with 2% of Eu2+ as a reference material. In that case the concentration of activator is as close as possible to the concentration of Eu2+ in investigated materials co-doped with Ti4+ and is enough to observe the persistent luminescence (see inset of Fig. 6). The Sr2SiO4:Eu2+ already has been shown to present the long lasting luminescence.17 Quality and purity of samples were examined with X-ray diffraction method (XRD) using BRUKER D2PHASER equipment employing Cu Kα radiation and operated at 30 kV and 10 mA. The XRD patterns were collected using scanning step of 0.02° and counting time of 0.4 s per step. Morphology of the sample A, sample B and reference material was examined with Scanning Electron Microscope TM – 1000 (Hitachi).

Optical spectroscopy

The excitation and emission spectra were measured using the system consisting of Xe lamp (450 W), two SPM2 monochromators (in the excitation and detection paths) and two photomultipliers R928 (for a luminescence and a reference signal detection).

To obtain time resolved luminescence spectra and luminescence kinetics the sample was excited using PL 2143 A/SS laser followed by PG 401/SH parametric optical generator generating 30 ps pulses with frequency 10 Hz. The emission spectra were collected using a 2501S (Bruker Optics) spectrograph followed by a C4334-01 Hamamatsu Streak Camera. Time resolved luminescence spectra and decay profiles were obtained by integration of the streak camera images over the time and wavelength intervals, respectively. This apparatus allowed to measure time resolved spectra and luminescence decays for the time scale shorter than 10 ms.

For the measurements of persistent luminescence kinetics at room temperature the modified PTI QuantaMasterTM spectrofluorimetric setup equipped with PMT followed by analog/digital converter was used. In this system the sample was excited directly by laser diodes or LEDs (depending on the spectral range and required optical power) controlled by programmable signal generator. To avoid detector's saturation, the fast electro-mechanical shutter synchronized with excitation source triggering was applied at the entrance slit of the emission path monochromator. The recorded data were cumulated and averaged to maximize signal-to-noise ratio.

Thermoluminescence (TL) measurements were carried out using Risø TL/OSL System TL-DA-12 equipped with the EMI 9235QA photomultiplier. 90Sr/90Y beta sources (beta dose rate calibrated for quartz—about 40 mGy s−1) were used for TL excitation. TL signal was detected in different spectral windows using Schott BG 39 (2 mm) and Schott BG 3 (3 mm) filters. Two 2 mg portions of each of investigated samples were carefully scattered onto stainless steel discs, covered previously by the thin layer of silicon oil spray. Experiments were performed in argon atmosphere, in the temperature range from 273 K to 723 K. The TL curves were obtained with the heating rate 0.5 K s−1 unless other values are given.

Results and discussion

SEM images were taken to investigate the surface morphology of the synthesized powders. The representative Scanning Electron Microscope images of all samples are presented in Fig. 2. As it can be seen the shape and diameter of the particles in all cases are not uniform because they have aggregated to form the large secondary particles, what is common in phosphors obtained via solid state synthesis method. However the materials are not characterized by the sharp-edged crystallites. Moreover, the particles of sample A are much more porous, specifically comparing to the reference material where the dense particles can be found. The higher porosity of the sample is a result of using the modified mesoporous silica SBA-15 as a silicon and titanium precursor.
image file: c5ra09999d-f2.tif
Fig. 2 SEM micrographs for the samples: upper pictures – reference material; middle pictures – sample A; lower pictures – sample B.

Sr2SiO4 can exist in two crystallographic phases: high temperature—orthorhombic α′ and low temperature—monoclinic β. The temperature of α′ ↔ β phase transition is equal to ∼358 K, and is relatively low comparing to other silicates. The α′ phase as a meta-stable form can exist below the phase transition temperature if small amount of Ba2+ or Eu2+ is added to the Sr2SiO4 lattice. In both phases Sr2+ ions occupy two kinds of non equivalent sites: ten-coordinated SI and nine-coordinated SII sites.18,19 The X-ray diffraction (XRD) patterns collected for synthesized materials (sample A, sample B and reference material) prove that α′ form of strontium silicate is a predominant phase in all cases – the recorded XRD patterns are in good agreement with PDF 00-039-1256 card (Fig. 3). However, in the case of samples co-doped with titanium ions the α-Sr2TiO4 phase (PDF 01-072-2040) can be distinguished and the contribution of this phase is comparable in both materials. This shows that small concentration of Eu2+ and Ti4+ ions introduced into the silicate lattice has no effect on Sr2SiO4 basic crystal structure and the excess of titanium, not incorporated in the silicate, takes part in creation of strontium titanate regardless of Ti4+ precursor used. Moreover the small amount of Sr(OH)2 (PDF 00-027-0847) exists in all samples as an impurity phase. The detailed phase composition of products is presented in Table 1. Sr2SiO4:Eu2+ obtained as a reference material as well as Sr2SiO4:Eu2+ co-doped with titanium (sample A and sample B), exhibit strong luminescence which consists of two broad bands with maxima at about 490 nm and 570 nm [Fig 4]. These bands are attributed to the parity allowed 4f65d1 → 4f7 transitions in Eu2+ ions occupying in Sr2SiO4 crystal lattice two different Sr2+ sites: ten-coordinated SI and nine-coordinated SII, respectively.17,20–25 Since the emission excitation bands are partially overlapped (Fig. 4), both types of Eu2+ luminescence centers can be excited simultaneously and the relative intensity of the signals from Eu2+ ions occupying SI site and SII site can be easily controlled by changing the excitation wavelength.17,26 When emission is excited with 442 nm, a single emission band with maximum at 570 nm is observed. Under excitation at wavelengths shorter than 420 nm, the second emission band appears in the blue-green spectral region, with maximum at 490 nm. However, this later band, originating from Eu2+ (SI) centers, is always (i.e. independently of the excitation wavelength) accompanied by the yellow-orange emission band from Eu2+ (SII).27 For 325 nm excitation the yellow-orange emission band is seen only as a shoulder on the longer wavelengths side of the dominating emission from Eu2+ (SI) (Fig. 4). Both mentioned emission bands have comparable intensities under 355 nm excitation, therefore this wavelength was chosen to investigate decays in the time resolved emission spectra (TRES) experiment. The emission decay profiles of the reference material, sample A and sample B, obtained at room temperature are presented in Fig. 5. In the case of the band with maximum at 490 nm the decay profiles were obtained by integration of the emission signal over 475–505 nm wavelength range. Such a range was chosen to minimize the contribution of the second, yellow-orange band. To get decay profiles of the yellow-orange band, the emission signal was integrated over 545–595 nm wavelength range. As it can be seen in Fig. 5 the luminescence intensity decreases approximately exponentially. A slight deviation from the exponential dependence, observed for the blue-green emission decay is related to the inter site SI → SII energy transfer and has been discussed in our previous paper.17 Decay constants estimated by fitting an exponential function to the decay profiles of the blue-green emission band are equal to: 0.55 μs for the reference material, 0.49 μs for the sample A, 0.56 μs for the sample B, and for the yellow-orange emission band: 1.06 μs, 1.16 μs and 1.19 μs for the reference material, sample A and sample B, respectively.


image file: c5ra09999d-f3.tif
Fig. 3 XRD patterns of investigated samples.
Table 1 Description and phase composition of samples
Sample Formula Ti4+ precursor Dopant concentration Composition
Reference material Sr1.98Eu0.02SiO4 Eu2+ – 2% mol 95% α′-Sr2SiO4, 5% Sr(OH)2
Sample A Sr1.99Eu0.01Si0.95Ti0.05O4 SiTi-20 Eu2+ – 1% mol, Ti4+ – 5% mol 93% α′-Sr2SiO4, 2% α-Sr2TiO4, 5% Sr(OH)2
Sample B Sr1.99Eu0.01Si0.95Ti0.05O4 TiO2 Eu2+ – 1% mol, Ti4+ – 5% mol 97% α′-Sr2SiO4, 2% α-Sr2TiO4, 1% Sr(OH)2


image file: c5ra09999d-f4.tif
Fig. 4 Normalized excitation and emission spectra. Excitation spectra were monitored at 480 nm (dashed green line) and 570 nm (dashed orange line). Emission spectra were measured under excitation at 325 nm (solid green line), 355 nm (solid blue line) and 442 nm (solid orange line).

image file: c5ra09999d-f5.tif
Fig. 5 Decay profiles of the two emission bands, measured at room temperature. Luminescence was excited at 355 nm and monitored at 480 nm (a) and 570 nm (b).

The high similarity in the shape of the emission and excitation spectra, as well as similarity in fluorescence decay profiles indicate that in samples A and B the active luminescence centers are the same as the luminescence centers present in the reference material. In all investigated samples the luminescence is a result of d–f transitions in Eu2+ ions occupying SI and SII sites. These results suggest also that the introduction of Ti4+ ions into the strontium silicate lattice as well as the presence of additional, impurity phases such as Sr(OH)2 and Sr2TiO4, at least at given in Table 1 concentration, do not influence the basic spectral properties of Eu2+ in the investigated materials what is advisable due to maintaining the good spectral properties of Sr2SiO4:Eu2+.

Besides of described above two strong emission bands, which decays in microseconds range, Sr2SiO4:Eu2+ exhibits also luminescence that lasts at room temperature for several seconds after stopping the excitation.17 The luminescence decay profiles collected for materials undoped with Ti4+ (inset of Fig. 6) show that the presence of the long lasting luminescence depends on the concentration of europium ions. The persistent luminescence is practically observed only in Sr2SiO4:Eu2+ nominally doped with 2 and 3% mol of activator. As described in our previous paper persistent luminescence is represented by the single band, with maximum at 570 nm, independently of the excitation wavelength. It leads to the conclusion, that traps responsible for long lasting luminescence of Sr2SiO4:Eu2+ observed at room temperature, deactivate directly and only through Eu2+ ions occupying nine coordinated SII sites. The traps type was attributed to the oxygen vacancies image file: c5ra09999d-t1.tif formed during synthesis of material to compensate the additional negative charge created after reduction of Eu3+ to Eu2+.17


image file: c5ra09999d-f6.tif
Fig. 6 Long lasting luminescence decay profiles of the samples co-doped with Ti (sample A and B) and reference material. Inset: the decay profiles of the long lasting luminescence of Sr2SiO4 doped with different concentration of Eu2+ (percent of mole). Wavelength of excitation is equal to 445 nm for all samples.

The samples of the Sr2SiO4:Eu2+ co-doped with Ti4+ exhibit the persistent luminescence in the same spectra region as the Sr2SiO4:Eu2+, however it is significantly enhanced. The decay profiles obtained after switching off the excitation source (λexc =445 nm) for both Sr2Si0.95Ti0.05O4:Eu2+ materials are shown in Fig. 6. It can be seen from these decay profiles that the persistent luminescence is characterized by much longer decay time comparing to the reference material. All phosphors show firstly a rapid intensity decrease and then a longer lasting yellow luminescence. The introduction of Ti4+ into the Eu2+ doped silicate matrix significantly extends the time of persistent luminescence from few seconds up to several minutes. It should be noted that the long lasting luminescence is observed in the samples doped with 1% mol of Eu2+ while in the parent material with the same concentration of Eu2+ it is practically not observable (Fig. 6). Taking into account the similarity of the spectroscopic properties between all samples it can be assumed that the long lasting luminescence observed in Ti4+ doped materials is a result of the existence of traps that are localized or active only at the SII emission center as in Sr2SiO4:Eu2+.

Furthermore, it was found that the decay time of persistent luminescence observed in Sr2Si0.95Ti0.05O4:Eu2+ phosphor depends strongly on the titanium precursor used during synthesis route. In the case of sample obtained using modified mesoporous silica SiTi-20 the decay time of long lasting luminescence was increased up to several tens of minutes comparing to the sample modified using TiO2 (Fig. 6). The reason seems to be that the distribution of Ti4+ ions among silicon in modified SBA-15 silica is much more homogeneous and is controlled by appropriate rate of hydrolysis and condensation reactions of alcoxides whereas the distribution of the ions in sample obtained using SiO2 and TiO2 was controlled only by mechanical milling.

The increase of the decay time is attributed to the changes in electron/hole traps distribution. The changes should give the additional contribution to thermoluminescence. Therefore the thermoluminescence measurements were carried out to investigate the traps occurring in the reference material, sample A and sample B. To distinguish the emission from Eu2+ occupying SI and SII, the TL signal was detected in two different spectral windows using Schott BG39 and Schott BG3 filters (Fig. 8). The comparison of the TL intensities measured with different filters indicates that the Eu2+ (SII) emission dominates also in the TL spectrum.

Trap parameters such as a trap depth E (or thermal activation energy) and a frequency factor s determine the lifetime of carriers in a trap (τ):

 
image file: c5ra09999d-t2.tif(1)
where k is the Boltzmann constant. The both parameters can be estimated by TL curve analysis. Fitting the sum of first order curves to experimental TL curves is one of the most popular methods.28,29 For such kind of approach some preliminary values of trap depths obtained from an independent TL experiment are required. They can be estimated by the various heating rate method (Hoogenstraaten method) (Fig. 7)30 for the clearly isolated TL maxima. The trap depth E is estimated from the relation between heating rate (β) and TL peak maximum position (Tmax):
 
image file: c5ra09999d-t3.tif(2)


image file: c5ra09999d-f7.tif
Fig. 7 TL measured with different heating rates (reference material).

The above relation is valid for the first order kinetics model. In the case of the investigated materials the first-order kinetics of the TL process can be supposed because of the stable position of the TL peaks in the TL curves measured for different initial trap populations (after different excitation doses). Three heating rates (0.5, 1 and 2 K s−1) were applied in order to estimate the E values for peaks at about 350 K and 450 K (see Fig. 7). For each peak a line was plotted in the coordinates 1/T and ln(Tmax2/β). Then the line slope, which is equal E/k, was estimated. The E values were used in the next step of TL analysis – the glow curve decomposition into first-order TL peaks:

 
image file: c5ra09999d-t4.tif(3)
where n0 is the initial concentration of filled traps. In this procedure, first of all the peaks for the E values from the Hoogenstraaten method were postulated and their s values were chosen in such way that the peak maxima were positioned at the TL curve maxima at 333 or 440 K (fitting was performed for the curves measured with the heating rate of 0.5 K s−1). Next the neighboring peaks were added. The fitting results are presented in Fig. 9 and Tables 2–4.

Table 2 Traps identified in the reference material. Traps parameters were obtained from the experimental TL curve in the fitting procedure described in details in the text. E – trap depth, s – frequency factor, n0 the initial concentration of filled traps, τ – lifetime of carriers in a trap at room temperature
Peak E [eV] n0 s [s−1] τ [s]
1 0.79 9.4 × 10⁵ 4.2 × 10¹⁰ 9.9 × 10²
2 0.70 1.2 × 10⁵ 7.9 × 10¹⁰ 1.2 × 101
3 0.92 3.5 × 10⁵ 1.1 × 10¹² 5.0 × 10³
4 1.30 4.0 × 10⁵ 2.4 × 10¹³ 9.1 × 10⁸
5 0.92 1.4 × 10⁵ 4.3 × 10⁹ 1.4 × 10⁶
6 1.07 7.0 × 10⁴ 2.4 × 10¹³ 1.0 × 10⁵
7 1.10 6.5 × 10⁴ 7.3 × 10¹² 1.2 × 10⁶


Table 3 Traps identified in the sample A. Traps parameters were obtained from the experimental TL curve in the fitting procedure described in details in the text. E – trap depth, s – frequency factor, n0 the initial concentration of filled traps, τ – lifetime of carriers in a trap at room temperature
Peak E [eV] n0 s [s−1] τ [s]
1 0.79 5.8 × 10⁵ 6.9 × 10¹⁰ 6.0 × 10²
2 0.70 2.8 × 10⁵ 8.2 × 10¹⁰ 1.1 × 101
3 0.83 3.6 × 10⁵ 7.1 × 10¹⁰ 2.8 × 10³
4 1.29 3.0 × 10⁴ 2.3 × 10¹³ 6.3 × 10⁸
5 0.92 2.2 × 10⁴ 4.4 × 10⁹ 1.3 × 10⁶
6 1.07 2.0 × 10⁵ 4.1 × 10¹³ 6.0 × 10⁴
7 0.96 4.7 × 10⁴ 8.0 × 10¹⁰ 3.6 × 10⁵
8 0.83 2.1 × 10⁵ 1.0 × 10¹² 2.0 × 10²
9 1.08 7.4 × 10⁴ 1.4 × 10¹³ 2.5 × 10⁵


Table 4 Traps identified in the sample B. Traps parameters were obtained from the experimental TL curve in the fitting procedure described in details in the text. E – trap depth, s – frequency factor, n0 the initial concentration of filled traps, τ – lifetime of carriers in a trap at room temperature
Peak E [eV] n0 s [s−1] τ [s]
1 0.79 3.1 × 10⁵ 5.2 × 10¹⁰ 8.0 × 10²
2 0.70 9.8 × 10⁴ 6.8 × 10¹⁰ 1.4 × 101
3 0.83 3.9 × 10⁵ 6.2 × 10¹⁰ 2.8 × 10³
4 1.30 6.1 × 10⁴ 2.7 × 10¹³ 8.2 × 10⁸
5 0.92 4.4 × 10⁴ 5.2 × 10⁹ 1.1 × 10⁶
6 1.07 1.2 × 10⁵ 4.2 × 10¹³ 5.9 × 10⁴
7 1.10 5.3 × 10⁴ 7.7 × 10¹² 1.1 × 10⁶
8 0.83 2.1 × 10⁴ 6.9 × 10¹¹ 3.0 × 10²
9 1.08 5.6 × 10⁴ 2.4 × 10¹³ 1.5 × 10⁵


The most conspicuous feature of the TL curves measured for the investigated samples and presented in Fig. 8 and Fig. 9 is the TL signal below 300 K especially high for sample A. The time between the end of excitation and starting the TL measurement is 60 s. This is the time needed for moving the sample in the reader from the position under the beta source to the position of luminescence detection. The TL below 300 K may fade significantly during this period, so what is observed only a small part of this signal. The traps responsible for this luminescence are identical to traps that are the source of carriers for the fastest components of the long-lasting luminescence presented in Fig. 6. Their parameters E and s cannot be estimated by the fitting procedure. One can suppose that their lifetime at RT should be a bit smaller than the lifetime of trap 2 that was identified by the fitting procedure, so of the order of a few seconds. From Fig. 8 it is clear that these traps are most highly populated in sample A but are also present in sample B and (in the slightest degree) in the reference material. A high concentration of the defects responsible for the shallow traps in sample A and B can be the first reason of the strong TL signal below 300 K and efficient long-lasting luminescence. There is, however, also another factor that favors the higher occupation of the shallow traps after excitation and enhances the long-lasting luminescence. In the TL curves of both samples, A and B, peak 1 is significantly weaker than in reference material. Moreover, the peaks present in the TL curve of reference material above 400 K are only slightly marked in TL curves of samples B and they sink in the background in the case of sample A. The deeper traps present in reference material are strong competitors for the shallower traps during the process of trap filling. They may also diminish the long-lasting luminescence by retrapping the carriers freed from shallow traps. The lack of the deeper traps in samples A and B enhances the signal originating from shallow traps.


image file: c5ra09999d-f8.tif
Fig. 8 Comparison of TL intensities measured in different spectral windows (heating rate 2 K s−1). Solid lines – TL measured with BG39 filter, dashed lines – TL measured with BG3 filter. Inset: transmission of the filters used in the detection module and PMT sensitivity curve.

image file: c5ra09999d-f9.tif
Fig. 9 TL curves decomposition into first order TL peaks, (a) – reference material, (b) – sample A, (c) – sample B.

Outcomes of the fitting procedure reveal an additional trap, beside the shallower traps mentioned above, that may be responsible for the clear difference between the shapes of long-lasting luminescence of sample A and B. The first maximum of TL curve of sample A is shifted into lower temperatures with respect to the first maximum in reference material and sample B (Fig. 8). This is due to the presence of peak 8 that does not occur in the TL curve of reference material and is very weak in the TL curve of sample B (Fig. 9b). This peak, having the lifetime of about 200–300 s, fades significantly faster than peaks 1 and 3 (lifetimes about 1000 s and 3000 s respectively), so the luminescence produced by the carriers freed from the trap related to this peak is a medium component of long-lasting luminescence in RT. Peaks 1 and 3 contribute to the slowest component of long-lasting luminescence of both samples.

In view of the analysis of TL spectra have not gave the answer about the life time of the most shallow traps, we have also analyzed the persistent luminescence decay assuming that each trap is an individual emission source and contributes to the persistent luminescence intensity by its individual light output image file: c5ra09999d-t5.tif where τ is the lifetime of the trap, and A(τ) is the number of the of the traps having lifetime τ. Thus the intensity of the total emission is given by the following sum:

 
image file: c5ra09999d-t6.tif(4)

When considering no homogeneously broadened system, the quantity A(τ) can be viewed as the distribution of luminescence lifetimes in the sample. Thus, instead of summation, one can consider the integration

 
image file: c5ra09999d-t7.tif(5)
 
image file: c5ra09999d-t8.tif(6)

One can recover the distribution function A(τ) from the experimental luminescence decay by minimizing the χ2 function defined as:

 
image file: c5ra09999d-t9.tif(7)
where k indexes the experimental points and σk is statistical weights. Details of the calculations are described in papers.31,32 When the integral is replaced by the sum the fitted quantities are image file: c5ra09999d-t10.tif or A(τ)d[ln(τ)] in dependence if the lifetime is spaced linearly or logarithmically. For our calculations we have used the logarithmic spacing where each decade was divided into 14 equal spaces. The fitted curves are presented in Fig. 10 (black curves), whereas recovered distributions are presented in Fig. 11a and b. In Fig 11a quantity image file: c5ra09999d-t11.tif is presented. Here the traps characterized by the shortest decay times are seen. In Fig. 11b the value of A(τ) is presented. Here the traps characterized by longer life times are seen. One should notice the rapid increasing of the quantity A(τ) for the longest decay times in Fig. 11b is related to the effect of the traps with the lifetimes longer than 10[thin space (1/6-em)]000 s which contribute to persistent luminescence at ambient temperature by solid background. The obtained lifetimes are listed in Table 5.


image file: c5ra09999d-f10.tif
Fig. 10 Fitted luminescence decays (black curve). Experimental decays (red curves).

image file: c5ra09999d-f11.tif
Fig. 11 Distribution of short time trap decays (a) quantity A(τ)/τ, (b) quantity A(τ).
Table 5 Recovered decay distribution maximums of the decays, τ [s]
Ref. sample Sample A Sample B
3 × 10⁻³ 0.02 0.02
0.1 0.3 0.15
1.2 1.2
6.0 20 10
200 300


One found the correlation between the results of analysis of luminescence decay and thermoluminescence experiments. Especially in both experiments one obtained the traps characterized by 10 s lifetime (in reference sample the luminescence kinetics yield 6 s). Additionally the appearance of traps characterized by the lifetime 200 s and 300 s for sample A and B (not observed for reference sample) obtained from thermoluminescence experiment were confirmed by luminescence kinetics analysis. Probably this traps are related to Ti3+.

Conclusions

Novel luminescent materials with composition Sr2Si0.95Ti0.05O4:Eu2+ were synthesized using different titanium precursors via solid state synthesis method. The persistent luminescence observed in the strontium orthosilicate doped with Eu2+ that lasts few seconds can be easily extended up to several tens of minutes by a co-doping of Sr2SiO4:Eu2+ with Ti4+ ions. Moreover in point of view of the luminescence lasting time the modified silica is a better titanium precursor than titania.

The extending of the time of persistent luminescence is a result of the traps distribution changing observed in thermoluminescence spectra and luminescence kinetics analysis. The Ti4+ incorporated into the silicate matrix can play the role of electron acceptor and the possibility of Ti4+ to Ti3+ reduction after excitation of Eu2+ should be considered. Thus, we propose tentatively the model in which Eu2+ after excitation give the electron to Ti4+. This process can be described by following relation:

Eu2+ + Ti4+ → (Eu2+)* + Ti4+ → Eu3+ + Ti3+

Energy of the [Eu3+ + Ti3+] is smaller than [(Eu2+)* +Ti4+] by value of 0.83 eV and the [Eu3+ + Ti3+] electron trap is responsible for enhancement of persistent luminescence in Ti doped Sr2SiO4:Eu2+. Taking into account that the typical persistent luminescent materials doped with Eu2+ need another expensive lanthanide ions to extend the time of luminescence,12 obtaining a similar effect by Ti4+ codoping can be considered as an advantage.

Acknowledgements

This work was supported by POIG.01.01.02-02-006/09 project co-funded by European Regional Development Fund within the Innovative Economy Program. Priority I, Activity 1.1. Sub-activity 1.1.2, which is gratefully acknowledged.

Notes and references

  1. T. Matsuzawa, Y. Aoki, N. Takeuchi and Y. Murayama, J. Electrochem. Soc., 1996, 143, 2670 CrossRef CAS PubMed.
  2. T. Katsumata, R. Sakai, S. Komuro, T. Morikawa and H. Kimura, J. Cryst. Growth, 1999, 198–199, 869 CrossRef.
  3. Y. Lin, Z. Tang and Z. Zhang, Mater. Lett., 2001, 51, 14 CrossRef CAS.
  4. N. Kodama, N. Sasaki, M. Yamaga and Y. Masui, J. Lumin., 2001, 94–95, 19 CrossRef.
  5. Y. Lin, Z. Tang, Z. Zhang, X. Wang and J. Zhang, J. Mater. Sci. Lett., 2001, 20, 1505 CrossRef CAS.
  6. L. Jiang, C. Chang, D. Mao and B. Zhang, Mater. Lett., 2004, 58, 1825 CrossRef CAS PubMed.
  7. Y. Wang, Z. Wang, P. Zhang, Z. Hong, X. Fan and G. Qian, Mater. Lett., 2004, 58, 3308 CrossRef CAS PubMed.
  8. R. Chen, Y. Hu, L. Chen, X. Wang, Y. Jin and H. Wu, Ceram. Int., 2014, 40, 8229 CrossRef CAS PubMed.
  9. W. Zeng, Y. Wang, S. Han, W. Chen and G. Li, Opt. Mater., 2014, 36, 1819 CrossRef CAS PubMed.
  10. X. Xu, X. Yu, D. Zhou and J. Qiu, J. Solid State Chem., 2013, 206, 66 CrossRef CAS PubMed.
  11. L. Jiang, S. Xiao, X. Yang, X. Zhang, X. Liu, B. Zhou and X. Jin, Mater. Sci. Eng., B, 2013, 178, 123 CrossRef CAS PubMed.
  12. D. Dutczak, A. Milbrat, A. Katelnikovas, A. Meijerink, C. Ronda and T. Justel, J. Lumin., 2012, 132, 2398 CrossRef CAS PubMed.
  13. S. E. Brinkley, N. Pfaff, K. A. Denault, Z. Zhang, H. T. Hintzen, R. Seshadri, S. Nakamura and S. P. DenBaars, Appl. Phys. Lett., 2011, 99, 241106 CrossRef PubMed.
  14. W. Hoogenstraaten and H. A. Klasen, J. Electrochem. Soc., 1953, 100, 366 CrossRef CAS PubMed.
  15. P. Zhang, Z. Hong, M. Wang, X. Fang, G. Qian and Z. Wang, J. Lumin., 2005, 113, 89 CrossRef CAS PubMed.
  16. K. Szczodrowski, B. Prélot, S. Lantenois, J.-M. Douillard and J. Zajac, Microporous Mesoporous Mater., 2009, 124, 84–93 CrossRef CAS PubMed.
  17. J. Barzowska, K. Szczodrowski, M. Grinberg, S. Mahlik, K. Anders, R. Piramidowicz and Y. Zorenko, J. Phys.: Condens. Matter, 2013, 25, 425501 CrossRef CAS PubMed.
  18. M. Catti, G. Gazzoni and G. Ivaldi, Acta Cryst. C, 1983, 39, 29 CrossRef.
  19. M. Catti, G. Gazzoni, G. Ivaldi and G. Zanini, Acta Cryst. C, 1983, 39, 674 CrossRef.
  20. J. S. Kim, Y. H. Park, S. M. Kim, J. C. Choi and H. L. Park, Solid State Commun., 2005, 133, 445 CrossRef CAS PubMed.
  21. J. S. Kim, P. E. Jeon, J. C. Choi and H. L. Park, Solid State Commun., 2005, 133, 187 CrossRef CAS PubMed.
  22. X. Sun, J. Zhang, X. Zhang, Y. Luo and X. Wang, J. Rare Earths, 2008, 26, 421 CrossRef.
  23. W. Zhi-Jun, Y. Zhi-Ping, G. Qing-Lin, L. Pan-Lai and F. Guang-Sheng, Chin. Phys. B, 2009, 18, 1056 Search PubMed.
  24. Y. S. Won and S. S. Park, J. Phys. Chem. Solids, 2010, 71, 1742 CrossRef CAS PubMed.
  25. C. Guo, Y. Xu, F. Lv and Xu. Ding, J. Alloys Compd., 2010, 497, L21 CrossRef CAS PubMed.
  26. W. Zhi-Jun, Y. Zhi-Ping, G. Qing-Lin, L. Pan-Lai and F. Guang-Sheng, Chin. Phys. B, 2009, 18, 2068 CrossRef.
  27. J. Barzowska, K. Szczodrowski, M. Krosnicki, B. Kuklinski and M. Grinberg, Opt. Mater., 2012, 34, 2095 CrossRef CAS PubMed.
  28. C. Furetta, Handbook of Thermoluminescence, World Scientific, Singapore, 2003 Search PubMed.
  29. M. Puchalska and P. Bilski, Radiat. Meas., 2006, 41, 659–664 CrossRef CAS PubMed.
  30. R. Chen and S. W. S. McKeever, Theory of Thermoluminescence and Related Phenomena, World Scientific, London, 1997 Search PubMed.
  31. M. Grinberg, D. L. Russell, K. Holliday, K. Wiśniewski and C. Koepke, Opt. Commun., 1998, 156, 409 CrossRef CAS.
  32. N. Deans, Excited states lifetime measurements, Academic press, New York, 1983 Search PubMed.

This journal is © The Royal Society of Chemistry 2015
Click here to see how this site uses Cookies. View our privacy policy here.