An optimized mild reduction route towards excellent cobalt–graphene catalysts for water oxidation

Doungkamon Phihusut a, Joey D. Oconac, Jae Kwang Leeab and Jaeyoung Lee*ab
aElectrochemical Reaction and Technology Laboratory (ERTL), School of Environmental Science and Engineering, Gwangju Institute of Science and Technology (GIST), Gwangju 500-712, South Korea. E-mail: jaeyoung@gist.ac.kr
bERTL Center for Electrochemistry and Catalysis, RISE, GIST, Gwangju 500-712, South Korea
cLaboratory of Electrochemical Engineering (LEE), Department of Chemical Engineering, College of Engineering, University of the Philippines Diliman, Quezon City 1101, Philippines

Received 27th May 2015 , Accepted 14th July 2015

First published on 16th July 2015


Abstract

Low cost yet efficient water oxidation catalysts are crucial in making economically competitive water electrolyzers and secondary metal–air batteries. In this study, we demonstrate the optimized mild reduction of graphene oxide towards the synthesis of highly active and stable cobalt–graphene electrocatalysts for water oxidation. Contrary to the conventional use of fully reduced graphene oxide (RGO) as a composite material in electrocatalysis, our results suggest that the oxygen functional groups, which are retained during mild GO reduction, are crucial in the formation of cobalt oxalate (CoC2O4) microstructures. Gently reduced graphene oxide (gRGO) with a low degree of reduction results in CoC2O4/gRGO microrods with impressive water oxidation activity, reaching current densities 21.1% higher than conventional iridium oxide-based catalysts and 70.5% more than the unoptimized CoC2O4/gRGO catalysts. Mild reduction of GO favors the homogeneous formation of microstructures via the negatively-charged functional groups, which attract the positive Co ions and lead to a stronger chemical interaction between the two components. This work points towards investigating and reevaluating the role of the degree of GO reduction on graphene's contribution to the composition and catalytic activity of metal–graphene composites.

Introduction

With rapidly growing energy demands and increasing environmental awareness, much effort has been dedicated to the development of efficient electrochemical energy storage and conversion systems.1,2 These technologies are crucial in serving the growing need for energy storage of renewable energy sources (e.g. solar, biomass, and wind), with the world becoming less dependent on conventional fossil fuels.3,4 Among electrochemical energy storage and conversion technologies, unitized regenerative fuel cells (URFCs), water electrolyzers, and rechargeable metal–air batteries constitute as cornerstone systems, without which, efficient storage and conversion of the energy coming from renewable energy sources is difficult.5–7 At the heart of these devices is the oxidation of water molecules to generate molecular oxygen, which severely limits the operational efficiency and considerably increases the system cost when noble metal catalysts are used.8 Inevitably, development of low cost, highly-reactive, and durable oxygen evolution reaction (OER) catalysts represents the foremost challenge if the above technologies are to become energy efficient and economical.9 Although various metal and non-metal OER electrocatalysts have been explored, noble metal-based catalysts (e.g. Ir/IrOx, Ru/RuOx) are still mainly considered as prime candidates due to their high current densities at potentials close to the equilibrium potential.10

Aside from expensive noble metals, first-row transition metal spinels and perovskites have been investigated as OER electrocatalysts in alkaline condition.11–13 For instance, cobalt (Co)-based catalysts are well known to be good OER catalysts in alkaline media, in addition to having catalytic activity towards oxygen reduction reaction (ORR). Hence, a significant number of Co-based electrocatalysts have been suggested, varying mainly in its structure (i.e. thin films, nanowires, and nanoparticles) and chemical composition (i.e. metallic, oxides, hydroxides, and alloys).14–17 Of late, we first demonstrated the use of Co oxalate (CoC2O4) as a prospective precursor in making one-dimensional (1D) nanostructured electrodes with high catalytic activity for OER in alkaline media.18 Furthermore, another innovative concept is the application of hybrid materials based on Co and carbon (e.g. graphene, carbon nanofibers, and carbon nanotubes), in order to exploit the inherent advantages of these carbon materials in electrocatalysis (i.e. scalable production, inexpensive precursors, and good electronic conductivity).17,19–23 Combining both approaches, we recently developed a bifunctional catalyst, based on gently reduced graphene oxide incorporated into microstructured cobalt oxalate rods (CoC2O4/gRGO), showing excellent and stable electrocatalytic activity in both OER and ORR.24 While gRGO is inactive in OER, combining it with CoC2O4 significantly improves the OER stability and contributes to the ORR activity via the nitrogen functional groups, leading to a slightly higher ORR limiting current than platinum on carbon (Pt/C). Nevertheless, the relationship between the degree of graphene oxide reduction and its properties as substrate for the formation of CoC2O4 has yet to be understood.

In this paper, we report the facile synthesis of gRGOs at different reduction condition (i.e. time and temperature) and demonstrate its effectiveness for the incorporation with CoC2O4 as a highly active electrocatalyst for oxygen evolution from water. Using various physico-chemical characterization and electrochemical methods, we show that a strongly reduced GO is not required in the efficient catalysis of water oxidation using the cobalt–graphene composite.

Experimental

Synthesis of gRGO and CoC2O4/gRGO

GO powder was synthesized from natural graphite following the chemically-modified Hummer's method described in our previous work.24 Partial reduction of GO was performed by adding hydrazine monohydrate (99.99%) (0.32 mg hydrazine per mg GO) to the dispersed GO in deionized (DI) water (1.5 mg GO per mL of DI water). The mixture was then maintained at the desired temperature levels (25 °C, 50 °C, 70 °C and 90 °C) at different reduction times (10 min, 30 min, 1 h, 2 h, 3 h, 4 h, 5 h, 6 h, 12 h, and 24 h). After the reduction of GO, each sample was filtered, collected, and dried. The gRGO powder was then redispersed in DI water (1.5 mg gRGO per mL of DI water) and underwent ultrasonication to enhance the homogeneous dispersion. CoC2O4/gRGO composites were synthesized by dissolving 0.5 mmol oxalic acid powder (H2C2O4) into 15 mL of the gRGO solution and consequently adding cobalt nitrate hexahydrate (Co(NO3)2·6H2O) as Co precursor. Finally, the mixture was sonicated in a sonication bath for 30 min to obtain the CoC2O4/gRGO powder. The samples are named according to the GO reduction condition used. For instance, gRGO-25 °C-6 h denotes that the GO was reduced at 25 °C for 6 h. On the other hand, CoC2O4/gRGO-25 °C-6 h denotes the sample using gRGO-25 °C-6 h to form with CoC2O4.

Characterization

The degree of reduction and dispersion of gRGOs were analyzed using ultraviolet-visible spectroscopy (UV-vis, Shimadzu UV-1800, Japan). Meanwhile, the morphology and structure of CoC2O4/gRGO composites were observed on the surface of a glass substrate under field emission scanning electron microscopy (FE-SEM, Hitachi S-4700). The crystal structures of CoC2O4/gRGO were confirmed using an automated X-ray diffraction equipment (XRD, Rigaku D/MaX IIIA, Japan). The surface functional groups of graphene were also characterized by X-ray photoelectron spectroscopy (XPS, Thermo VG Scientific, MultiLab 2000) with an Mg Kα X-ray source (1253.6 eV) and a Shirley background during fitting and Fourier transform infrared (FT-IR) spectroscopy (Varian 660-IR). Adsorption–desorption isotherms and pore size distributions of gRGOs and CoC2O4/gRGOs were also measured using a BET Analyzer (Belsorp max, Japan). Furthermore, the resistivities of the GO samples were taken using four-point probe measurements.

Electrochemical property and OER activity

We measured the specific capacitance of gRGO using cyclic voltammetry (CV) in the potential range between −0.8 V and 0.2 V (vs. Hg/HgO) in a 0.1 M KOH electrolyte at a scan rate of 50 mV s−1. The working electrode was prepared by depositing the catalyst ink (0.15 mg cm−2) onto a 5 mm glassy carbon electrode (GC, Metrohm). Pt mesh and Hg/HgO were used as counter and reference electrodes, respectively. In order to evaluate the catalytic activity and stability in OER for CoC2O4/gRGO samples, LSV measurements were performed under N2-saturated 0.1 M KOH solution in the window range of 0 V to 1.0 V (vs. Hg/HgO) at a scan rate of 100 mV s−1 until the 50th scan. The catalyst stability in OER was evaluated by chronoamperometry (CA) at a fixed potential of 0.8 V in N2-saturated solution for 6 h.

Results and discussion

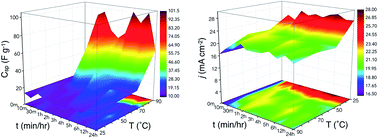
After GO reduction at different temperatures for various lengths of time, we evaluated the electrochemical and physicochemical properties of gRGOs. In order to check the effect of the reduction condition on gRGO samples' electrochemical characteristics, we measured the specific capacitance (Csp) in cyclic voltammetry (CV). Fig. 1 represents the response surface plots of the Csp of gRGO as a function of the reduction time and the reduction temperature. As shown in the surface contour plot, increasing the reduction temperature strongly enhanced the specific capacitance of gRGO samples. Meanwhile, the effect of the reduction time is evident only in the high reduction temperature region, specifically at 90 °C. It must be noted that the reduction temperature was restricted up to 90 °C only due to the limitations posed by the flash point of the reductant solution (hydrazine) and the boiling point of water. High Csp values were observed for gRGO samples reduced at 90 °C. For instance, gRGOs treated for 12 h, 5 h, 1 h, and 30 min displayed high capacitance values of 101.36 F g−1, 100.46 F g−1, 96.07 F g−1, and 91.08 F g−1, respectively. Relative to previous studies on RGO, these values are not as high as expected since GO was only partially reduced.25,26 In addition, ramping up the reduction time at 90 °C resulted to an increase in Csp up to 1 h, then decreased until 3 h, and rose again up to 5 h of reduction time. This odd behaviour, however, can be explained by considering the changes that occur in the surface oxygen groups of GO during reduction.
image file: c5ra09956k-f1.tif
Fig. 1 Surface response plot of specific capacitance (Csp) of gRGO samples as a function of reduction time (t) and reduction temperature (T). The Csp was computed from the CV of each sample in the potential range between −0.8 V and 0.2 V (vs. Hg/HgO) in 0.1 M KOH electrolytes at a scan rate of 50 mV s−1.

X-Ray diffractograms of the gRGO samples were studied to look at the changes in the crystallinity. As shown in Fig. 2a, the diffraction patterns of gRGOs reduced at 90 °C showed a narrowing of the initially broad peak at around 23.9°, indicating an increase in the interlayer distance between the graphite oxide sheets.25 Expectedly, the small GO peak at around 12° disappeared as the reduction occurred. On the other hand, reduction proceeded at a lesser degree for gRGOs reduced at 25 °C, as proven also by XPS. Nonetheless, the XRD analysis proves that the GO was only mildly reduced, as exhibited by the absence of the sharp characteristic RGO peak usually found at 24°.


image file: c5ra09956k-f2.tif
Fig. 2 (a) X-Ray diffractograms of gRGOs reduced at 90 °C in different reduction times, cyclic voltammetry (CV) profiles of gRGOs reduced at different reduction times at (b) 90 °C and (c) 25 °C in a 0.1 M KOH electrolyte at a scan rate of 50 mV s−1. (d) Electrical conductivity of gRGOs reduced at 90 °C in different reduction times.

Fig. 2b and c display the representative CVs of the gRGOs treated at 90 °C and 25 °C. Evidently, the gRGOs reduced at 90 °C exhibited pseudo-capacitive characteristics in between −0.8 V and −0.2 V (vs. Hg/HgO), indicating the occurrence of an oxidation–reduction reaction pair.25 Pseudo-capacitive behaviour, however, was not observed in gRGOs reduced at 25 °C. Thus, the capacitive behaviour in the gRGO samples is a combination of the double-layer capacitance and pseudo-capacitance, in the case of gRGOs samples reduced at higher temperature.

The reduction of gRGO was also monitored using UV-Vis spectroscopy as seen in Fig. S1. The absorption peaks of gRGOs are located at 265 nm, within the absorption region of fully reduced GO and graphene.27,28 The characteristic absorbance peak for the π–π* transition in pristine GO is located at 230 nm.29 During reduction of GO, however, the accompanying conjugation of the electronic structure shifted the absorbance peak to the higher wavelength region, near to that of graphene.27 The increasing absorbance at 265 nm with longer reduction times occurred with the solution color change from brown to black and with the increase in the amount of dispersed gRGO in the aqueous solutions.28,30 This is crucial in obtaining highly dispersible gRGO in water and in making CoC2O4/gRGO.

To further investigate the functional groups after reduction at low and high temperatures, FT-IR spectroscopy was performed. As shown in the FT-IR spectra of gRGOs in Fig. S2, there are slight differences in the absorption bands at 1619 cm−1 and 3403 cm−1, denoting changes in the hydroxyl and carboxyl groups at different temperatures. The typical absorption bands of GO are located at 1060 cm−1 (C–O–C), 1395 cm−1 and 3403 cm−1 (O–H), 1619 cm−1 (C[double bond, length as m-dash]C) and 1739 cm−1 (C[double bond, length as m-dash]O).27 Increasing the reduction temperature of the solution with diluted hydrazine, however, partially reduced the GO only.

On the other hand, the resistivities of gRGO paper samples, produced after drying the samples reduced at 90 °C at different reduction times, were measured using four-point probe analysis (Fig. 2d). The lowest resistivity was obtained for gRGO-90 °C-3 h (0.32 Ω cm), while high resistivities were measured for gRGOs reduced for a short time. The enhanced electrical conductivity of gRGOs signifies that the oxygen functional groups were removed and the defects were lost. In principle, removal of the oxygen functional groups during reduction leads to the reconnection of the original graphitic domains by forming new sp2 clusters to restore the long-range conjugation of GO.31 This could result to a significant rise in the electrical conductivity once a high number of the sp2 structures is achieved.32 The advantages of the improved conductivity have been widely used in electrocatalysis, as the electron transfer between the liquid–solid interfaces is crucial in accelerating the reactions. Indeed, this reasoning has been the consistent justification on why RGO is applied as composite material.33

In order to shed light on the electrochemical characteristics of gRGOs, the surface chemistry of gRGOs was investigated using X-ray photoelectron spectroscopy (XPS). The C1s spectra of gRGO were deconvoluted into five characteristic peaks consisting of the following bonds: sp2 (C[double bond, length as m-dash]C)/sp3 (C–C), hydroxyl and epoxide (C–O), carbonyl (C[double bond, length as m-dash]O), carboxyl (O[double bond, length as m-dash]C–O), and the shake-up satellite (π–π*).33,34 Using these results, we plotted the relative amounts of the different surface functional groups in the gRGO samples (Fig. 3a), except the C[double bond, length as m-dash]C/C–C bonds, which constituted majority of the C1s signal (68.6%). C–O has the highest atomic percentage (>15 at%), while C[double bond, length as m-dash]O and O[double bond, length as m-dash]C–O were at 6.8 at% and 3.5 at%, respectively. Furthermore, a rising π–π* shake-up satellite peak was only observed for the reduction at 5 h, implying the presence of aromatics, conjugated systems or the electronic excitation of the π electron system on an aromatic ring by the photoelectrons.35–37


image file: c5ra09956k-f3.tif
Fig. 3 (a) C1s X-ray photoelectron spectra of gRGOs reduced at different reduction times at 90 °C. (b) Atomic percentages of surface functional groups of gRGOs reduced at different reduction times at 90 °C, as measured in XPS. (c) C1s X-ray photoelectron spectra of gRGOs reduced at different reduction times at 25 °C. (b) Atomic percentages of surface functional groups of gRGOs reduced at different reduction times at 25 °C, as measured in XPS.

Additionally, we analyzed the functional groups in gRGOs reduced with the same set of reduction times (1 h, 3 h, and 5 h) but at 25 °C. Similar to the previous spectra, the signals were fitted with the same five characteristics peaks (Fig. 3c) and we plotted the relative amounts of the functional groups in Fig. 3d. The C–O (25.32 at%) groups exhibited the highest concentration, having several-folds higher content among the other functional groups. Similar to the results above, the presence of the π–π* shake-up satellite peak was observed for gRGO-25 °C-1 h, at a higher binding energy, reflecting the restoration of aromaticity after eliminating some oxygen atoms in the surface.38 Comparing the spectra of gRGOs reduced at 25 °C and 90 °C, the removal of C–O seemed to have influenced more the capacitance of gRGOs reduced at 90 °C. The difficulty in removing C–O groups at 25 °C is explained by the transformation and evolution mechanisms involved in the single-bonded C–O, consistent with previous studies.39 Various functional groups (i.e. C–OH, C–O–C, and –O) actually contributed to the C–O signal. Moreover, at low temperature reduction, the transformation of C[double bond, length as m-dash]O to C–O can also occur. The initial C–OH species are suggested to have been involved in the formation of phenols by sacrificing the C–O–C bonds.39 As mentioned above, pseudo-capacitance behaviour influenced in increasing the specific capacitance in gRGOs reduced at 90 °C. The increase in capacitance from zero to 1 h of reduction time at 90 °C could be attributed to the increase in the carboxyl groups. The decrease in O–C[double bond, length as m-dash]O was coincidental with the decrease of capacitance in gRGO-90 °C-3 h. With further reduction at 5 h, the specific capacitance rose with the increase in carboxyl groups and the enrichment of the π–π* shake-up satellite, which produces additional redox reactions similar to that of O–C[double bond, length as m-dash]O. Since good electronic transport is required to facilitate the storage of charge at the interfacial sites, gRGOs reduced at 90 °C demonstrated the best specific capacitance due to the enhanced conductivity from the removal of the oxygen functional groups.

Following our previous study on CoC2O4/gRGO composites, we looked at the most suitable gRGO for incorporation with CoC2O4. The composite was synthesized from the reaction between cobalt nitrate precursor with oxalic acid in the gRGO solution.

 
H2C2O4·2H2O + Co(NO3)2·6H2O + 3H2O → CoC2O4(s) + 11H2O + 2HNO3. (1)

The Co loading of the CoC2O4/gRGO from the TGA curves in Fig. S3 agrees well with the computed Co loading from the precursor amounts. For each CoC2O4/gRGO composite, we evaluated the OER catalytic activity using linear sweep voltammetry (LSV) in N2-saturated 0.1 M KOH electrolytes with respect to Hg/HgO as reference electrode. Contrary to the expected result, as shown in the surface plot in Fig. 4, increasing the degree of reduction GO does not guarantee an increase in OER activity. CoC2O4/gRGO composites, where the gRGOs were reduced at 25 °C, showed high OER activities. This behaviour is in stark contrast with the results in Fig. 1, where the gRGOs reduced at 90 °C showed higher Csp. Nevertheless, CoC2O4/gRGO composites reduced at 90 °C exhibited modest OER activity. This unexpected phenomenon has not been reported yet in previous studies using graphene–metal composites for OER.


image file: c5ra09956k-f4.tif
Fig. 4 Surface plot of the oxygen evolution electrocatalytic activity (j) of CoC2O4/gRGO as a function of reduction time (t) and reduction temperature (T). The current densities were obtained at 1.0 V vs. Hg/HgO using LSV in 0.1 M KOH electrolyte.

In our previous study, we have shown that CoC2O4/gRGO demonstrates excellent and stable electrocatalytic activity towards OER, arising from the inherent properties of the components and their physicochemical interaction. As seen in Fig. 5a, CoC2O4/gRGO-25 °C-6 h displayed the best electrocatalytic activity with a current density of 27.9 mA cm−2, which represents 21.1% higher activity than Ir/C catalyst (23.1 mA cm−2) with the same loading amount. In addition, this current density is 70.5% higher than the previous unoptimized CoC2O4/gRGO catalyst in our previous study.24 Evidently, gRGO alone does not provide any catalytic activity, while the OER activity is exclusively due to CoC2O4. The combination of the two components, at the same Co loading, exhibited excellent OER activity. The results in the Tafel slope measurements agree well with that of the LSV. As seen in Fig. S4, the estimated Tafel slope of CoC2O4/gRGO-25 °C-6 h is the lowest among the Co–graphene composites, and even the Ir/C catalyst. In effect, a lower overpotential is required to increase the current density of OER, leading to a more efficient water splitting reaction.


image file: c5ra09956k-f5.tif
Fig. 5 Surface plot of the oxygen evolution electrocatalytic activity (j) of CoC2O4/gRGO as a function of reduction time (t) and reduction temperature (T). The current densities were obtained at 1.0 V vs. Hg/HgO using LSV in 0.1 M KOH electrolyte.

We believe that the strong interaction between Co and gRGO during the formation of CoC2O4/gRGO is crucial for improving the OER activity. Excellent interaction between the component materials could be attributed to the enriched functional groups in gRGO that are well suited for the sorption of ions and molecules.40–42 The synergistic combination also translates into more durable catalysts, as shown by the long-term electrolysis in Fig. 5b. After 21[thin space (1/6-em)]000 s, Ir black exhibited fast degradation, while the cobalt–graphene composites remained stable. For instance, CoC2O4/gRGO-25 °C-6 h exhibited the best long-term performance with around 42% current reduction after 21[thin space (1/6-em)]000 s. Even the catalyst prepared at the higher temperature showed better stability than just CoC2O4 and Ir/C. The excellent physical interaction between CoC2O4 and gRGO sheets may have contributed also to the improved stability of the catalyst by preventing further oxidation of cobalt.24

Fig. 6a displays the representative SEM images of CoC2O4/gRGO-25 °C-6 h, showing the homogeneous formation of microstructured CoC2O4 rods with the gRGO. Although various CoC2O4/gRGO catalysts, depending on the reduction condition, catalyze the water oxidation reaction at different rates, their morphologies do not differ much. Furthermore, the TEM image in Fig. 5b displays the wrapping of gRGO sheets on the CoC2O4 structures. Comparing the morphologies of the composites formed under different GO reduction conditions, low temperature reduction allowed the formation of microrods. Without the gRGO, however, cubic-like CoC2O4 structures are formed in the same reduction condition at 25 °C (Fig. S5b). Furthermore, at 90 °C, an irregularly structured CoC2O4/gRGO was formed (Fig. S5a). These show how important is the degree of reduction of GO during the nucleation and growth of the CoC2O4 particles.


image file: c5ra09956k-f6.tif
Fig. 6 Representative (a) SEM images and (b) TEM image of CoC2O4/gRGO reduced at 25 °C for 6 h. (c) X-Ray diffractograms of CoC2O4/gRGOs reduced at two reduction conditions in comparison with CoC2O4 and gRGO only. (d) Pore size distribution of the CoC2O4/gRGOs reduced at two reduction conditions in comparison with CoC2O4 and gRGO only.

In order to look at the crystal structure of the composites, we performed X-ray diffraction (XRD) studies. As shown Fig. 6c, the diffractograms of CoC2O4/gRGO catalysts follow the peaks corresponding to CoC2O4 (JCPDS no. 470797). At the same Co loading, it should be noted that the intensity of the (202) diffraction plane at around 19° was higher in CoC2O4/gRGO-25 °C-6 h than CoC2O4/gRGO-90 °C-6 h and CoC2O4 only. This could mean enhanced crystallinity in CoC2O4 in CoC2O4/gRGO-25 °C-6 h that could lead to improved catalytic activity.43 Further, additional minor diffraction peaks between 20° and 55° were observed (JCPDS no. 470797 and 370719), demonstrating the simultaneous formation of CoC2O4 and β-CoC2O4. Although the characteristic GO peak at around 12° disappeared, the graphitic carbon peak at 24° corresponding to RGO did not appear, proving that GO is only partially reduced.

Furthermore, the BET surface area and the pore size distribution (PSD) of gRGOs and CoC2O4/gRGOs were measured. For instance, the specific surface area of gRGO-90 °C-6 h and gRGO-25 °C-6 h were 284 m2 g−1 and 230 m2 g−1, respectively. As shown in Fig. 6d, the N2 adsorption–desorption isotherms and BJH pore size distribution of gRGO-25 °C-6 h and gRGO-90 °C-6 h showed typical isotherm plots of nanoporous structure that are usually found on partially reduced GO.44,45 In contrast, after the combination with CoC2O4, the BET surface areas of CoC2O4/gRGO-25 °C-6 h drastically decreased to 54 m2 g−1, and its isotherm plot approaches to that of pure CoC2O4. This signifies the formation of the CoC2O4 microrods that are in good contact with gRGO sheets. The PSD of CoC2O4/gRGO-25 °C-6 h confirmed the decrease in the pore sizes of the composite. This occurrence, however, was not observed in CoC2O4/gRGO-90 °C-6 h, which had less remaining oxygen functional groups. This supports our assertion on the positive influence of the oxygen functional groups in gRGO during the formation of the composite. It can be said as well that the surface area is not the determining factor in the excellent OER activity and stability of CoC2O4/gRGO-25 °C-6 h, but the synergistic activity between the components.

Conclusions

Overall, our results show that the right combination of the oxygen functional groups in mildly reduced graphene oxide is key in the successful formation and incorporation of cobalt oxalate microstructures, which can lead to excellent OER activity. Although the reduction of GO at 90 °C leads to gRGOs with enhanced electronic conductivity and specific capacitance, its catalytic activity is the lowest among the temperature levels considered. Since the CoC2O4/gRGO-25 °C-6 h electrocatalyst does not show enhanced surface area and porosity, the apparent increase in activity can only come from the enhanced interfacial interaction between its individual components, as proven by the modest activity of the physical combination of the gRGO and CoC2O4. Our simple approach of optimizing the catalytic activity of metal–graphene composites can lead to reevaluation of the role of graphene in these catalysts, as most of these composites have used graphene-like RGO. In fact, the facile mild synthesis of gRGOs can be done using more environmentally friendly reductants, such as ammonia and weak acids (e.g. L-ascorbic acid). In addition, eliminating the need for full reduction of GO to improve its electrochemical properties can save energy and protect the environment considering that the popular techniques are either performed using high temperature reduction or done using strong reducing agents. While the optimized cobalt–graphene composite presented here shows higher activity than commercial Ir/C catalysts, its activity can still be improved by enhancing the surface area and porosity via decreasing the size to the nanoscale. This can lead to metal–graphene composites, which can be synthesized using a simple one-pot method, with the potential to be alternative OER catalysts in regenerative fuel cells, secondary metal–air batteries, and water electrolyzers.

Acknowledgements

This work was supported by Korea Ministry of Environment through the project entitled, “The development of capacitive electrode module and treatment processing for reusing wastewater”.

Notes and references

  1. A. S. Arico, P. Bruce, B. Scrosati, J.-M. Tarascon and W. V. Schalkwijk, Nat. Mater., 2005, 4, 366 CrossRef CAS PubMed.
  2. D. S. Su and R. Schlogl, ChemSusChem, 2010, 3, 136 CrossRef CAS PubMed.
  3. M. I. Hoffert, K. Caldeira, G. Benford, D. R. Criswell, C. Green, H. Herzog, A. K. Jain, H. S. Kheshgi, K. S. Lackner, J. S. Lewis, H. D. Lightfoot, W. Manheimer, J. C. Mankins, M. E. Mauel, L. J. Perkins, M. E. Schlesinger, Y. Volk and T. M. L. Wigley, Science, 2002, 298, 981 CrossRef CAS PubMed.
  4. M. S. Dresselhaus and I. L. Tomas, Nature, 2011, 414, 332 CrossRef PubMed.
  5. J. M. Tarascon and M. Armand, Nature, 2001, 414, 359 CrossRef CAS PubMed.
  6. B. C. H. Steele and A. Heinzel, Nature, 2001, 414, 345 CrossRef CAS PubMed.
  7. R. Subbaraman, D. Tripkovic, K.-C. Chang, D. Strmcnik, A. P. Paulikas, P. Hirunsit, M. Chan, J. Greeley, V. Stamenkovic and N. M. Markovic, Nat. Mater., 2012, 11, 550 CrossRef CAS PubMed.
  8. J. Lee, B. Jeong and J. D. Ocon, Curr. Appl. Phys., 2013, 13, 309 CrossRef PubMed.
  9. Y. Matsumoto and E. Sato, Mater. Chem. Phys., 1986, 14, 397 CrossRef CAS.
  10. S. Trasatti, Electrochim. Acta, 1984, 29, 1503 CrossRef CAS.
  11. J. O'M. Bockris and T. Otagawa, J. Phys. Chem., 1983, 87, 2960 CrossRef CAS.
  12. R.-N. Singh, M. Hamdani, J.-F. Koenig, G. Poillerat, J. L. Gautier and P. Chartier, J. Appl. Electrochem., 1990, 20, 442 CrossRef CAS.
  13. M. E. G. Lyons, Int. J. Electrochem. Sci., 2008, 3, 1425 CAS.
  14. V. Artero, M. Chavarot-Kerlidou and M. Fontecave, Angew. Chem., Int. Ed., 2011, 50, 7238 CrossRef CAS PubMed.
  15. C. Bocca, A. Barbucci, M. Delucchi and G. Cerisola, Int. J. Hydrogen Energy, 1999, 24, 21 CrossRef CAS.
  16. G. Mattioli, P. Giannozzi, A. A. Bonapasta and L. Guidoni, J. Am. Chem. Soc., 2013, 135, 15353 CrossRef CAS PubMed.
  17. Y. Liang, Y. Li, H. Wang, J. Zhou, J. Wang, T. Regier and H. Dai, Nat. Mater., 2011, 10, 780 CrossRef CAS PubMed.
  18. J. W. Kim, J. K. Lee, D. Phihusut, Y. Yi, H. J. Lee and J. Lee, J. Phys. Chem. C, 2013, 117, 23712 CAS.
  19. Y. Liang, H. Wang, J. Zhou, Y. Li, J. Wang, T. Regier and H. Dai, J. Am. Chem. Soc., 2012, 134, 3517 CrossRef CAS PubMed.
  20. C. Huang, C. Li and G. Shi, Energy Environ. Sci., 2012, 5, 8848 CAS.
  21. S. Chen, J. Zhu and X. Wang, J. Phys. Chem. C, 2010, 114, 11829 CAS.
  22. J. Wu, D. Zhang, Y. Wang, Y. Wan and B. Hou, J. Power Sources, 2012, 198, 122 CrossRef CAS PubMed.
  23. Y.-S. He, D.-W. Bai, X. Yang, J. Chen, X.-Z. Liao and Z.-F. Ma, Electrochem. Commun., 2010, 12, 570 CrossRef CAS PubMed.
  24. D. Phihusut, J. D. Ocon, B. Jeong, J. W. Kim, J. K. Lee and J. Lee, Electrochim. Acta, 2014, 140, 404 CrossRef CAS PubMed.
  25. B. Zhao, P. Liu, Y. Jiang, D. Pan, H. Tao, J. Song, T. Fang and W. Xu, J. Power Sources, 2012, 198, 423 CrossRef CAS PubMed.
  26. Y. Wang, Z. Shi, Y. Huang, Y. Ma, C. Wang, M. Chen and Y. Chen, J. Phys. Chem. C, 2009, 113, 13103 CAS.
  27. C. Zhu, S. Guo, Y. Fang and S. Dong, ACS Nano, 2010, 4, 2429 CrossRef CAS PubMed.
  28. D. Li, M. B. Müller, S. Gilge, R. B. Kaner and G. Wallace, Nat. Nanotechnol., 2008, 3, 101 CrossRef CAS PubMed.
  29. S. Yang, W. Yue, D. Huang, C. Chen, H. Lin and X. Yang, RSC Adv., 2012, 2, 8827 RSC.
  30. J. Yu, N. Grossiord, C. E. Koning and J. Loos, Carbon, 2007, 45, 618 CrossRef CAS PubMed.
  31. S. Pie and H.-M. Cheng, Carbon, 2012, 50, 3210 CrossRef PubMed.
  32. G. E. Pike and C. H. Seager, Phys. Rev. B: Solid State, 1974, 10, 1421 CrossRef.
  33. C.-C. Teng, C.-C. M. Ma, C.-H. Lu, S.-Y. Yang, S.-H. Lee, M.-C. Hsiao, M.-Y. Yen, K.-C. Chiou and T.-M. Lee, Carbon, 2011, 49, 5107 CrossRef CAS PubMed.
  34. X. Xia, Q. Hao, W. Lie, W. Wang, H. Wang and X. Wang, J. Mater. Chem., 2012, 22, 8314 RSC.
  35. X. Fan, W. Peng, Y. Li, X. Li, S. Wang, G. Zhang and F. Zhang, Adv. Mater., 2008, 20, 4490 CrossRef CAS PubMed.
  36. J. Kleiman and Z. Iskanderova, Icpmse-6, Springer, Toronto, Canada, 2004 Search PubMed.
  37. B. Xu, S. Yue, Z. Sui, X. Zhang, S. Hou, G. Cao and Y. Yang, Energy Environ. Sci., 2011, 4, 2826 CAS.
  38. R. Rozada, J. I. Paredes, S. Villar-Rodil, A. Martines-Alonso and J. M. D. Tascon, Nano Res., 2013, 6, 216 CrossRef CAS.
  39. A. Ganguly, S. Sharma, P. Papakonstantinou and J. Hamilton, J. Phys. Chem. C, 2011, 115, 17009 CAS.
  40. X. Long, J. Li, S. Xiao, K. Yan, Z. Wang, H. Chen and S. Yang, Angew. Chem., 2014, 126, 7714 CrossRef PubMed.
  41. G. M. Scheuermann, L. Rumi, P. Steurer, W. Bannwarth and R. Mülhaupt, J. Am. Chem. Soc., 2009, 131, 8262 CrossRef CAS PubMed.
  42. J. Pyun, Angew. Chem., Int. Ed., 2011, 50, 46 CrossRef CAS PubMed.
  43. P. Aitchison, B. Ammundsen, D. J. Jones, G. Burns and J. Rozière, J. Mater. Chem., 1999, 9, 3125 RSC.
  44. Q. Du, M. Zheng, L. Zhang, Y. Wang, J. Chen, L. Zue, W. Dai, G. Ji and J. Cao, Electrochim. Acta, 2010, 55, 3897 CrossRef CAS PubMed.
  45. S. M. Unni, S. Devulapally, N. Karjule and S. Kurungot, J. Mater. Chem., 2012, 22, 23506 RSC.

Footnotes

Electronic supplementary information (ESI) available. See DOI: 10.1039/c5ra09956k
These authors contributed equally to this work.

This journal is © The Royal Society of Chemistry 2015
Click here to see how this site uses Cookies. View our privacy policy here.