Simultaneous nitrification and denitrification using a polypyrrole/microbial cellulose electrode in a membraneless bio-electrochemical system

Hooshyar Hossinia, Abbas Rezaee*a, Bita Ayatib and Amir Hossein Mahvic
aEnvironmental Health Department, Faculty of Medical Sciences, Tarbiat Modares University, Tehran, Iran. E-mail: rezaee@modares.ac.ir; Fax: +98 21 82883575; Tel: +98 21 82883575
bDepartment of Environmental Engineering, Faculty of Civil & Environmental Engineering, Tarbiat Modares University, Tehran, Iran
cCenter for Solid Waste Research, Institute for Environmental Research, Tehran University of Medical Science, Tehran, Iran

Received 24th May 2015 , Accepted 12th August 2015

First published on 12th August 2015


Abstract

In this study, the feasibility of ammonium and total nitrogen (TN) removal from aqueous solution using a simultaneous nitrification and denitrification process was studied in a membraneless (single chamber) bio-electrochemical system with a novel electrode. The main objectives were to synthesize a polypyrrole/microbial cellulose (PPy/MC) composite and utilize it as a novel electrode material. To determine the mechanical properties of PPy/MC, the tensile strength and Young’s modulus were investigated. A biofilm was prepared using the fabricated electrode during the first few weeks. Effective parameters such as initial ammonium concentrations (NH4+ ∼ 15–150 mg N L−1), HRT (6–72 h), carbon/nitrogen ratio (C/N ratio ∼ 0–4), current intensity (2–10 mA), and pH (6.5–8.5) were evaluated. The following optimum values were obtained: HRT, 24 h; C/N ratio, 2; electric current, 6 mA; and pH, 7–7.5 at a constant ammonium concentration of 77.77 mg N L−1. It can be concluded from the experimental data that under optimal conditions about 97.42 and 62.47% of ammonium and TN were removed successfully, respectively.

1. Introduction

Urbanization, industrialization, and the agricultural activities of humans have paved the way for large quantities of contaminants to mix with ecosystems and aquatic sources.1 Nitrogen compounds are among these contaminants, with ammonium/ammonia ions being the major ones. Water and wastewater containing large quantities of ammonium/ammonia ions can have adverse effects on human health (metabolic diseases) and the environment (such as eutrophication and plant overgrowth). However, to achieve efficient treatment methods, much research has been performed. Various techniques have been employed to remove nitrogen from water and wastewater, such as adsorption, ion exchange, reverse osmosis, air stripping, electrochemical and biological processes.2 A biological process was chosen in this study because of the environmentally friendly aspects. On the other hand, low growth rate and low cellular yields of bacteria in conventional treatments have prompted advanced treatment techniques to be investigated. In recent years, bio-electrochemical systems (BESs) have been proposed as a potentially interesting technology for the production of energy from wastewater3–5 and there are highly efficient ones compared to conventional processes. Depending on the usage of the systems (production of energy or hydrogen), BESs can be assigned to two categories: microbial fuel cells (MFCs) and microbial electrolysis cells (MECs). The performance of bio-electrochemical systems is accomplished by electrically coupling a microbial film and electrodes (anode/cathode). Electro-stimulation of this system occurs when the cellular configurations and microorganisms are exposed under electrochemical conditions or electrical fields. This phenomenon can cause enzyme activation, biopolymer synthesis, membrane transport, and proliferation.6 According to the literature review, bio-electrochemical treatment has been introduced as a highly efficient and promising technique for the removal of nitrogen from water and wastewater.7,8 Research has revealed that nitrogenous compounds can be removed from an aqueous matrix simultaneously.9,10 Also, similar studies have demonstrated that the simultaneous removal of carbon and nitrogen can occur during bio-electrochemical processes.11 In the case of simultaneous nitrification and denitrification, ammonium ions at the anode are converted to nitrate, and then nitrate and other byproducts formed via denitrification subsequently get converted to nitrogen gas at the biocathode.11 In a MEC process, carbon sources are degraded by microbes at the anode, and hydrogen is produced at the cathode as shown in the following equations:
 
10H2O + 10e → 5H2 + 10OH (1)
 
5H2O → 2.5O2 + 10H+ + 10e (2)

A clear mechanism of nitrification and denitrification in a bio-electrochemical system has not been described. But reaction mechanisms of ammonium to gaseous nitrogen and intermediates are proposed in the following equations:

 
image file: c5ra09771a-t1.tif(3)
 
image file: c5ra09771a-t2.tif(4)
 
2NO3 + 2H2 → 2NO2 + 2H2O (5)
 
2NO2 + 2H2 → N2O + H2O + 2OH (6)
 
N2O + H2 → N2↑ + H2O (7)

Recently, one topic of interest in bio-electrochemical systems is the development and fabrication of novel electrode materials. Various criteria such as large active surface areas, excellent biocompatibility and conductivity, and non-toxicity towards bacteria are a priority.12 Therefore, the introduction of a new electrode material may be of interest and could change the course of new studies. Cellulose is the most abundant biopolymer from renewable resources in the world and it is a basic component of all plant materials.13 Microbial cellulose (MC) can be extracellularly synthesized into nano-sized fibrils from some strains of bacterial genera such as Acetobacter, Agrobacterium, Gluconacetobacter, Rhizobium, and Sarcina, and this shows a desirable potential alternative to plant-based cellulose for use in specialized applications in medical, acoustic, and other industries.14–17 Accordingly, with regard to the ultra-fine network structure of MC, it represents physical and chemical advantages over other substances, such as mechanical stability, crystallinity, and hydrophilicity.18 These attractive characteristics allow MC to be used in conducting polymer composites. Polypyrrole is a promising intrinsically conducting polymer in optical, electronic, biological, and medical applications due to its environmental stability, ease of synthesis, cytocompatibility, low oxidation potential, and electrical conductivity.19 In this study, microbial cellulose was impregnated with polypyrrole for nitrogen removal in a bio-electrochemical system. The deposition of polypyrrole on fabrics and yarn surfaces have been widely investigated by researchers, among microbial cellulose those tested is an attractive material to be used as an insulation matrix in conducting polymer composites.18 To the best of our knowledge and based on the literature, there is no previous report on simultaneous nitrification and denitrification via a bio-electrochemical process using conductive microbial cellulose as a biopolymer. The aim of this study is to use a conductive biopolymer as an electrode material for rapid biofilm generation and to improve simultaneous nitrification and denitrification via bio-electrochemical processes.

2. Experimental

2.1. Materials

All materials used in this study were of analytical grade and were used without further purification. An aqueous stock solution of ammonia (from NH4Cl salt) was prepared with deionized distilled water. Different concentrations of ammonia were obtained by diluting the stock solution.

2.2. Microbial cellulose production

Acetobacter xylinum was obtained from the National Institute of Technology and Evaluation (NITE), in Japan. A Hestrin–Schramm culture medium was used for the production of the MC membrane.16 The harvested microbial cellulose membranes were boiled in 2% sodium dodecyl sulfate (CH3(CH2)11OSO3Na) and 4% NaOH solutions in a boiling water bath. The MC membranes were then rinsed with distilled water until their pH became neutral. The MC sheet was then dried at 70 °C for 24 h in an electric oven prior to use.

2.3. MC/PPy preparation

For the preparation of MC/PPy, the method used by Müller et al. (2011) was considered.19 MC was cut into 6 × 15 cm pieces and used as a base in the polymerization. A prepared MC sheet with a 2 mm diameter was coated with polypyrrole (PPy) through surface polymerization. The MC sheet was immersed in aqueous pyrrole solution with concentrations varying from 0.03 mol L−1 at 25 °C. Then, this solution was exposed to MC for 10 min under stirring. Iron chloride hexahydrate (FeCl3·6H2O) as an oxidizing agent was used in a 2[thin space (1/6-em)]:[thin space (1/6-em)]1 molar ratio with pyrrole. The surface polymerization of MC was carried out for 4 h. Finally, after complete polymerization, the white MC sheet appeared black.20 To remove excess PPy, byproducts and residues of the polymerization reaction from the surface, black MC was rinsed with aqueous pyrrole solution and distilled water. For electrode preparation, the MC/PPy composite sheet was dried at 60 °C.19

2.4. Electrode fabrication

Steel mesh (mesh 18) was used as a conductive frame to minimize electrical resistance. The steel mesh was cut into 6 × 15 cm pieces similar to the MC sheets and was cleaned to remove impurities and grease using acetone solution and distilled water. Then, the MC/PPy composite sheet was covered by the steel mesh, bilaterally.

2.5. Nitrifying bacteria

Inoculum mass for the growth and enrichment of nitrifying bacteria was collected from returned activated sludge of a wastewater treatment plant in Tehran, Iran. For enrichment, the following synthetic medium was used: 0.3 g L−1 KH2PO4, 1 g L−1 Na2HPO4·12H2O, 0.1–0.5 g L−1 NaCl, 2 g L−1 NaHCO3, 0.1 g L−1 MgSO4·7H2O, and 0.1–0.4 g L−1 NH4Cl.

2.6. Denitrifying bacteria

For the biofilm generation, the sludge (from the returned activated sludge) was collected from a wastewater treatment plant in Tehran, Iran. The feed wastewater was prepared by dissolving a certain amount of KNO3 as a nitrogen source, and bicarbonate/acetate as a carbon source for autotrophic/heterotrophic denitrification. The C/N ratio (stoichiometric carbon/NH4+–N) was adjusted to about 1.5 in the primary operation. The pH of the influent was normally around 7.5. The following synthetic growth medium was used: 0.3 g L−1 KH2PO4, 1 g L−1 Na2HPO4·12H2O, 0.1 g L−1 NaCl, 2 g L−1 NaHCO3, 0.1 g L−1 MgSO4·7H2O, 10 mM acetate, and trace elements were provided using tap water.21

2.7. Bio-electrochemical system start up and operation

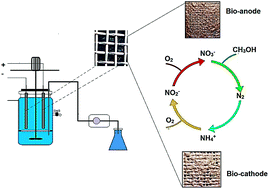
A 2 L glassy vessel (with an effective volume of 1.8 L) was employed for the bio-electrochemical system. A schematic of the bio-electrochemical cell with related compartments is illustrated in Fig. 1. The anode and cathode were placed vertically at a fixed distance of 5.5 cm without any separated membrane. A DC power supply was set up for the startup process. The flow rate and hydraulic retention time (HRT) were maintained at approximately 0.9 L min−1 and 24 h, respectively. The temperature of the bio-electrochemical cell was adjusted using an online thermometer. The enriched nitrifying/denitrifying bacteria for the biofilm formation were inoculated into the reactor with a primary MLSS of about 7000 mg L−1 (approximately, about 20% of the reactor). The bio-electrochemical reactor was operated in a batch wise mode as follows: feeding by a peristaltic pump (Heidolph, Germany) for about 18 min, reaction (depending on the HRT), and a discharge step. First, the reactor was launched with an ammonium load of 38.88 mg of N per L (50 mg NH4+ per L), 5 mA, a C/N ratio of 2 with a HRT 24 h for 3 weeks. The bio-electrochemical system was fed with a growth medium containing: 0.45 g L−1 Na2HPO4, 0.15 g L−1 KH2PO4, 0.1 g L−1 MgSO4·7H2O, 0.015 g L−1 CaCl2·7H2O, and a 1 mL L−1 trace nutrient solution of 1.5 g L−1 FeCl3·6H2O, 0.15H3BO3, 0.03 g L−1 CuSO4·5H2O, 0.18 g L−1 KI, 0.12 g L−1 MnCl2·4H2O, 0.06 g L−1 Na2MoO4·2H2O, 0.12 g L−1 ZnSO4·7H2O, 0.15 g L−1 CoCl2·6H2O, and 10 mM acetate. According to Table 1, the main parameters such as the effect of ammonium concentrations, HRT, C/N ratio, applied current, and effect of initial pH were analyzed. This table is considered for the operating conditions of the bio-electrochemical process, as shown in Table 2).
image file: c5ra09771a-f1.tif
Fig. 1 Schematic plan of the single chamber bioelectrochemical system (a) [1 – DC power supply, 2 – aerator pump, 3 – bioreactor, 4 –electromotor, 5 – propeller, 6 – diffuser, 7 – peristaltic pump, 8 – feeding tank, 9 – discharge value, 10 – anode, 11 – cathode, 12 – steel mesh, 13 – ammonia oxidizing bacteria, 14 – polypyrrole layer, 15 – microbial cellulose, 16 – denitrifying bacteria], and MC/PPy/SSM electrodes before and after biofilm generation (b).
Table 1 Performance of bioelectrochemical systems for nitrogen removal
Bio-electrochemical reactor type Objectives Wastewater Nitrogen removal Reference
Microbial fuel cell (MFC) Simultaneous removal of carbon and nitrogen Synthetic wastewater NH4+–N removal rate of 97.4%, TN removal of 97.3% 11
Microbial fuel cell (MFC) Promote nitrification denitrification Synthetic wastewater Ammonium >86.9%, nitrogen removal of 86.9%, nitrogen removal rate of 3.39 mg of N L−1 h−1 43
Microbial fuel cell (MFC) Organic matter and nitrogen removal Synthetic domestic wastewater Nitrate removal of 294 g of NO3–N m−3 per day 44
Microbial electrolysis cell (MEC) Nitrate removal Synthetic wastewater Nitrate removal of 92.7% 2
Microbial fuel cell (MFC) Nitrite removal, decreases the energy demand and the carbon requirements Synthetic domestic Nitrite removal of 37 ± 5%, nitrogen removal rate of 135 g of N m−3 per day 45
Microbial electrolysis cell (MEC) Nitrate removal Drinking water NO3–N removal of 90–100% 36
Microbial electrolysis cell (MEC) Nitrate removal Synthetic wastewater Denitrification efficiency of 84% 46
Microbial fuel cell (MFC) Simultaneous nitrification and denitrification, without extra energy input Synthetic wastewater (acetate and ammonium) Ammonia removal of >96.8% 10
Microbial fuel cell (MFC) Simultaneous carbon and nitrogen removal Piggery wastewater Nitrogen removal rate of 0.194 kg of N m−3 per day 9


Table 2 Operating conditions of the bioelectrochemical process
Operation parameter Operation type Ammonium conc. HRT (h) C/N ratio Electrical current (mA) pH Temp. (°C)
NH4+ (mg L−1) N (mg L−1)
Influence of NH4+ conc. Batch 20–200 15.5–155.5 24 2 5 ∼7.8
Influence of HRT Batch 100 77.76 8–72 2 5 ∼7.8 Controlled (23 ± 2 °C)
Influence of C/N ratio Batch 100 77.76 24 0–4 5 ∼7.8 Controlled (23 ± 2 °C)
Influence of electrical current Batch 100 77.76 24 2 2–10 ∼7.8 Controlled (23 ± 2 °C)
Influence of initial pH Batch 100 77.76 24 2 6 6.5–8.5 Controlled (23 ± 2 °C)


2.8. Analysis

Samples were analyzed according to the standard methods for water and wastewater. To determine the ammonium content, the Phenate method at λmax = 640 nm was used. The nitrate content was measured at λmax = 220 and 275 nm, spectrophotometrically. Also, the nitrite content was analyzed with a colorimetric method using sulfanilamide and naphthylethylenediamine dihydrochloride reagents at λmax = 543 nm. TN removal was calculated from the remaining nitrate, nitrite, and ammonium. To determine the mechanical properties of the bacterial cellulose sheet, ASEM method D 636 (Instron tensile test) was used. The oxidation–reduction potential and dissolved oxygen content were measured using an ORP meter (ORPmeter, Eutch) and a DO meter (Hach, USA). Scanning electron microscopy (SEM) images were taken on an X′Pert MPD (Philips, Holland).

3. Results and discussion

3.1. Mechanical properties of PPy/MC

For the PPy/MC to be used as a biofilm electrode base, it is imperative that the mechanical properties are evaluated. The tensile strength is one of the essential criteria for estimating the strain of a material. Based on the tensile testing, the Young’s modulus is calculated to find the resistance of a material to deformation. As can be seen in Fig. 2a and b, the stress–strain curve and its initial linear region are illustrated. The slope from the linear region (Fig. 2b) was used to estimate the Young’s modulus. Accordingly, the ultimate tensile strength (UTS) for the PPy/MC composite was 0.09 mm. The UTS is the maximum load the specimen sustains during the tensile test. The mechanical properties of the PPy/MC sheets such as Young’s modulus, tensile strength, and elongation at break are shown in Table 3. It can be found that the Young’s modulus of the PPy/MC composite is obtained at 30 MPa. This result demonstrates that the PPy/MC composite is a resistant material as an electrode against force stress in solution.
image file: c5ra09771a-f2.tif
Fig. 2 Stress–strain curve (a) and its linear region (b) for the PPy/MC composite sheet.
Table 3 Representative mechanical properties of the PPy/MC composite
Young’s modulus (MPa) Breaking strain (%) Ultimate tensile strength (mm)
30 60.229 0.090


3.2. Experimental setup

The primary startup of the bio-electrochemical process at certain conditions was performed for about 3 weeks, and the ammonium removal efficiency and TN were controlled daily. At the end of this period, ammonium removal was up to 78%, but TN removal efficiency was below 27% (data not shown). This end point was selected when the ammonium removal percentage arrived at a variation of less than 5% (a quasi-steady-state condition). During the start up, a biofilm was formed on the PPy/MC/SSM electrodes. As shown in Fig. 3a–h, the SEM and graphical images of rinsed and polymerized bacterial cellulose, the abiotic-electrode, biofilm-electrode, and attached bacteria are illustrated. During the startup period, a rapid generation of biofilm on the PPy/MC sheets was observed. The graphical images (after the biofilm generation in Fig. 1) illustrate the bioelectrode preparation.
image file: c5ra09771a-f3.tif
Fig. 3 (a–h) SEM and graphical images of the electrode and its materials: graphical image of rinsed and polymerized MC (a), SEM image of polymerized MC (b), SEM image of the raw stainless steel mesh surface (c), SEM image of the MC/PPy/SSM electrode (d), SEM images of the biofilm (e and f), and SEM images of the attached bacteria on the electrode (g and h).

3.3. Influence of ammonium concentration

Different concentrations of ammonium can affect the biological activities and internal ohmic resistance during bioelectrochemical nitrification and denitrification. An increase in ammonium concentration stimulates the growth of nitrifying bacteria. This fact was observed when a sequence analysis of Nitrosomonas eutropha C-91 (SSU rRNA sequence) at increased concentrations of ammonium was investigated.22 In addition, the ammonium concentration gradient will influence the charge transport in MFCs.23 On the other hand, the amount of converted ammonium from water/wastewater depends on the mass transfer coefficient. The mass transfer of a pollutant or nutrient into a biofilm happens by two main mechanisms. These mechanisms are advection-movement and diffusion-movement, such that the concentration gradients affect the diffusion mechanism.

As can be seen in Fig. 4a, the effect of different concentrations on ammonium removal and TN removal efficiency was investigated with six influent concentrations in the bio-electrochemical reactor, 15.55, 31.11, 46.66, 77.77, 116.66, and 155.56 mg N-NH4+ per L. The bioelectrochemical reactor was operated for about 28 days after the start-up period. During the different ammonia loading stages, overall a significant decrease in ammonium removal and TN was observed (except at low ammonium concentrations). The mean removal percentages were determined for 20–200 mg L−1 of ammonium to be 97.96 ± 0.19%, 95.6 ± 3.47%, 94.66 ± 4.03%, 90.07 ± 5.95%, 69.07 ± 3.09%, and 63.91 ± 5.34%, respectively. The related TN removal percentages were 18.37 ± 1.5%, 23.21 ± 2.37%, 29.4 ± 6.2%, 37.92 ± 3.94%, 38.95 ± 8.62%, and 42.84 ± 5.67%, respectively. A lower TN removal efficiency during the early days can happen due to a small population of nitrite oxidizing bacteria and the accumulation of nitrite. Nitrite accumulation was observed at about 10–27 mg L−1 from the first operating day of experiment till the 28th day of operation. Because of a low specific growth rate (low growth yield) and the small energy gain, a small TN removal from nitrite accumulation occurs. The accumulation phenomenon was associated with the inhibition of denitrifying bacteria by a nitrite intermediate (hydroxyl amine, NH2OH),24 and this can have an effect on the TN removal percentage. Also, the growth of ammonia and nitrite oxidizing bacteria in lower ammonium concentrations as a supernatant source is limited. However, dissolved oxygen levels in the liquid matrix become saturated and the denitrification pathway will be impaired. Moreover, environmental condition variables known to affect nitrification rates include toxicity, temperature, salinity, amounts of dissolved oxygen, pH, and ammonium ion availability.25 The ORP and the final pH of the ammonium loading stages are represented in Fig. 4b. The variation of dissolved oxygen (DO), pH and ORP were recorded at about 1.2–1.5 mg L−1 (data not shown), 7.2–8.34 and 150–269 mV, respectively. These parameters have been considered as indicators for nitrification/denitrification. An ORP between 123 (DO = 1 mg L−1) and 208 mV for nitrification was suggested by Li and Irvin in 2007,26 and they also reported an ORP of about 173–175 mV is indicative of a dissolved oxygen level of 3 to 5.5 mg L−1. Similar research has demonstrated that nitrification fails when ORP values are lower than 50–150 mV.27 Generally, there is an inverse relationship between pH and the ORP, regardless of the oxidant type (such as oxygen) or concentration and this trend can be seen from the results. The pH value can affect the reductive reaction of oxygen as demonstrated in the following equation:

 
O2 + 2H2O + 4e ↔ 4OH (8)


image file: c5ra09771a-f4.tif
Fig. 4 Chemical variation tracking for bioelectrochemical nitrification and denitrification: effect of different concentrations of ammonium (a) and end point data of pH and ORP changes (b).

3.4. Kinetics study

One of the parameters that can have large effects on a biological process is the provision of an adequate reaction time between the biomass/biofilm and the substrate material. Fig. 5a displays the effect of reaction time on bio-electrochemical nitrification and denitrification. The performance of the ammonium removal system was tested at HRTs of 6, 12, 18, 24, 32, 48, and 72 h. Depending on the HRT, from 6 to 72 h, the average ammonium and TN removal percentage were determined to be around 10.62 ± 1.5%, 29.58 ± 3.37%, 45.66 ± 3.6%, 77.37 ± 7.03%, 98.62 ± 0.56%, 98.76 ± 0.57%, 99.89 ± 0.09% and 2.09 ± 0.68%, 9.58 ± 2.12%, 23.65 ± 2.38%, 39.4 ± 1.25%, 55.82 ± 7.21%, 67.71 ± 0.56%, 70.91 ± 0.85% respectively. It can be seen from Fig. 5a that a large amount of ammonium and TN has been removed at a HRT of 24 h . When the HRT was higher than 24 h, a >90% ammonium removal efficiency with 34% TN removal was achieved. From the results it can be seen that a long HRT is required to treat the higher ammonium concentrations. This can occur due to the very slow growth of autotrophic nitrifiers.28 In the case of Nitrobacter sp. (as a dominant species of nitrite oxidizing bacteria), generation times have been reported at about 18 and 69 h,29 and this can provide a low cell yield. On the other hand, during short HRTs, a small amount of ammonia is converted to nitrite and other intermediates, which implies that the denitrifying bacteria has limited access to electron sources. As can be concluded from Fig. 5a, improved nitrogen depletion is observed with a sufficient hydraulic retention time.
image file: c5ra09771a-f5.tif
Fig. 5 Effect of hydraulic retention time (HRT) (a) and nitrogen removal kinetics (b) on bioelectrochemical nitrification and denitrification.

The nitrogen removal kinetics during nitrification and denitrification are shown in Fig. 5b. In order to evaluate the results, Michaelis–Menten kinetics were used. According to this equation, the ammonia oxidation process resembles a first-order reaction (eqn (9)):30

 
ln[thin space (1/6-em)]Ct = −kt + ln[thin space (1/6-em)]C0 (9)
where C0 and Ct are the ammonium/TN concentrations (mg L−1) at the beginning and at the end of each experiment, t is the time in hours (h), and k is the ammonium/TN removal rate constant, which is determined using the slope of the kinetics plot (h−1).

With regard to the linear equations of ammonium/TN removal and their slopes, the kinetic constants were calculated to be about 0.1085 and 0.0131 per hour. High correlation coefficients (R2) indicate a good fit between the model kinetics and experimental ammonium/TN data.

3.5. Influence of effective factors

To evaluate the influence of the C/N ratio, synthetic wastewater with C/N ratios of 0, 0.5, 1, 2, and 4 was considered by using sodium bicarbonate as the inorganic carbon source. The ammonium and TN removal efficiencies under the conditions of 77.77 mg of N per L of ammonium, 24 h HRT, and an electric current of 5 mA in the bio-electrochemical cell are shown in Fig. 6a. The results show that when a C/N balance is available, the nitrifying and denitrifying bacteria operate successfully. This was evident from the balanced C/N ratio that was set at 2. At the C/N ratio of 2, desirable conditions for nitrogen removal (ammonium ∼ 81.71%, TN ∼ 46.65%) via nitrification and denitrification pathways were provided while for poor C/N ratios the overall nitrogen removal declined. This is the result of a lower amount of available carbon source (eqn (1) and (2), carbon dioxide in the case of autotrophic bacteria). Aside from improving the ammonia removal efficiency with increasing C/N ratio, a ratio of more than 2 caused an accumulation of nitrification byproducts, and consequently a decrease in nitrogen removal was observed. As a result of an insufficient C/N ratio, improper denitrification can occur, while a high C/N ratio may cause accumulation of nitrite or extra production of nitrous oxide other than nitrogen gas.1 In the case of bicarbonate or carbonate as carbon sources, there is an increase in pH with an increase in C/N ratios. The reaction of sodium bicarbonate in aqueous solution is shown in eqn (10) and (11).
 
NaHCO3 + H2O ↔ H2CO3+ OH (10)
 
H2CO3 ↔ CO2 + H2O (11)

image file: c5ra09771a-f6.tif
Fig. 6 Effect of the main parameters on bioelectrochemical nitrification and denitrification: C/N ratio (a), electrical current (b), and pH (c).

With regard to this, alkalinity occurs. However, an increase in pH occurs with a higher dosage of bicarbonate with an increase in C/N ratio. In turn, higher pH levels can block nitrification and denitrification pathways through the accumulation of nitrite. Okhravi (2015) has reported that with an increasing C/N ratio in biofilms, competition between heterotrophic and nitrifying bacteria occurs for dissolved oxygen and space, and this fact can lead to a decrease in the nitrifying population.31 A lower growth rate and yield of nitrifying bacteria (including AOB and NOB) compared to heterotrophic and denitrifying bacteria means that nitrifying bacteria are more vulnerable to this competition.32 Ballinger et al. (2002) reported a single sludge reactor fed with C/N ratios of 2 and 5, and they reported a desirable activity of AOB at a C/N ratio of 2, whereas the activities of both AOB and heterotrophic bacteria were not detected at a C/N ratio of 5 due to the competition.33 An optimum C/N ratio of 1 was reported by Zhao et al. (2012) using mixotrophic denitrifiers.34 As can be seen in Fig. 6b, different ranges of electric current intensity (2, 4, 6, 8, and 10 mA) with 77.77 mg of N per L−1 of ammonium, 24 h HRT, and a C/N 2 were investigated, and the ammonium and TN removal rates (%) were also determined. The results demonstrated that nitrogen could be removed successfully by increasing the current intensity from 2 to 6 mA, and a loss in efficiency was observed at 10 mA. The ammonium and TN removal percentages were around 49.81, 64.94, 98.01, 92.62 and 65.90%, and 16.43, 19.24, 59.44, 35.86 and 27.67%, respectively. A significant ammonium removal efficiency was achieved at 6 mA, and also, the highest TN removal rate was achieved. This occurred due to the inactivation of the nitrifying and denitrifying population in a high electrical current. Many researchers have investigated the effect of current intensity on the magnitude of bioelectrochemical nitrogen removal. A varied applied current intensity was used from 0 to 1000 mA.35,36 Accordingly, lower ranges of current intensity, always below 30 mA, have been determined to be the optimum applied electrical charge. Adding to this space has also been associated with adverse effects. Calzia et al. (2009) studied the structural modification of proteins using a direct electric current and reported that when the voltage was higher than 3.5 V, enzyme activity failed.37 These results confirmed that a higher electrical current (or an increase in applied voltage) can destroy nitrifying and denitrifying enzymes and consequently impair nitrogen depletion. On the other hand, a decrease in TN removal efficiency by increasing the current intensity may arise as a result of excess hydrogen gas production at the cathode. Wan et al. (2010) reported that when the electrical current was higher than 30 mA, the cathode was saturated with hydrogen gas and the hydrogenotrophic denitrifiers could not use the hydrogen gas as an electron donor.38 Also, Islam and Suidan (1998) showed that at high current intensity, hydrogen gas inhibits denitrification pathways.39 The pH is a key factor for biological processes, and achieving an optimum value between two bacteria communities is necessary. With this intent, a pH range of 6.5–8.5 was tested. Under certain conditions (77.77 mg of N per L of ammonium in the influent, 24 h HRT, C/N ratio of 2, and an electric current of 6 mA) the influence of initial pH on the nitrogen removal rate is shown in Fig. 6c. Under constant conditions, and initial pH values of 6.5, 7.0, 7.5, and 8.5, the ammonium and TN removal efficiencies were 42.81, 78.67, 97.42, 61.3% and 2.43, 38.77, 62.47, 36.65, 12.06%, respectively. It can be concluded from the pH data that slightly alkaline (pH 7.5) conditions are better for simultaneous ammonium and TN removal. The AMO enzyme is activated in the presence of large concentrations (20 mM) of nitrite, and more inactivity happens under alkaline than under acidic conditions.40 When the pH value is higher than 8.6, nitrite accumulation occurs.41 This result confirms that a narrow pH range of about 7–7.5 is essential for permanent nitrification and denitrification. Researchers have also proposed that an optimal pH for bio-electrochemical nitrogenous compound reduction is between 7 and 8.42

4. Conclusion

This study addressed simultaneous nitrification and denitrification using PPy/MC electrodes in a bio-electrochemical system. With regard to the Young’s modulus of the PPy/MC composite, it was demonstrated that PPy/MC is a resistant material as an electrode against force stress. Using the fabricated electrode, we saw biofilm generation during the first few weeks. Nitrogen depletion was most effective at a HRT of 24 h, C/N ratio of 2, an electric current of 6 mA, and pH 7–7.5 for an ammonium concentration of 77.77 mg of N per L. It can be concluded that ammonium and TN were removed successfully with the PPy/MC composite as a novel electrode in a bio-electrochemical system.

References

  1. S. Ghafari, M. Hasan and M. K. Aroua, Bioresour. Technol., 2008, 99, 3965–3974 CrossRef CAS PubMed.
  2. A. H. Mahvi, S. J. A. D. Ebrahimi, A. Mesdaghinia, H. Gharibi and M. H. Sowlat, J. Hazard. Mater., 2011, 192, 1267–1274 CrossRef CAS PubMed.
  3. B. Zhang and Z. He, RSC Adv., 2012, 2, 10673–10679 RSC.
  4. M. Sharma, P. M. Sarma, D. Pant and X. Dominguez-Benetton, RSC Adv., 2015, 5, 39601–39611 RSC.
  5. R. A. Rozendal, H. V. M. Hamelers, K. Rabaey, J. Keller and C. J. N. Buisman, Trends Biotechnol., 2008, 26, 450–459 CrossRef CAS PubMed.
  6. I. Hönes, A. Pospischil and H. Berg, Bioelectrochem. Bioenerg., 1998, 44, 275–277 CrossRef.
  7. D. Xie, C. Li, R. Tang, Z. Lv, Y. Ren, C. Wei and C. Feng, Electrochem. Commun., 2014, 46, 99–102 CrossRef CAS PubMed.
  8. Y. Tong and Z. He, RSC Adv., 2014, 4, 10290–10294 RSC.
  9. J. Ryu, H. Lee, Y. Lee, T. Kim, M. Kim, D. Anh, H. Tran and D. Ahn, Process Biochem., 2013, 48, 1080–1085 CrossRef CAS PubMed.
  10. H. Yan, T. Saito and J. M. Regan, Water Res., 2012, 46, 2215–2224 CrossRef CAS PubMed.
  11. S. Xie, P. Liang, Y. Chen, X. Xia and X. Huang, Bioresour. Technol., 2011, 102, 348–354 CrossRef CAS PubMed.
  12. T. H. Pham, P. Aelterman and W. Verstraete, Trends Biotechnol., 2009, 27, 168–178 CrossRef CAS PubMed.
  13. D. Shen, R. Xiao, S. Gu and K. Luo, RSC Adv., 2011, 1, 1641–1660 RSC.
  14. H. M. N. Iqbal, G. Kyazze, T. Tron and T. Keshavarz, Polym. Chem., 2014, 5, 7004–7012 RSC.
  15. R. Quintana, O. Persenaire, L. Bonnaud and P. Dubois, Polym. Chem., 2012, 3, 591–595 RSC.
  16. H. Godini, A. Rezaee, A. Khavanin, A. Ahmadabadi, S. Rastegar and H. Hossini, J. Polym. Environ., 2011, 19, 283–287 CrossRef CAS.
  17. J. Yuan, X. Huang, P. Li, L. Li and J. Shen, Polym. Chem., 2013, 4, 5074–5085 RSC.
  18. S. Banerjee, T. K. Paira and T. K. Mandal, Polym. Chem., 2014, 5, 4153–4167 RSC.
  19. D. Müller, C. Rambo, D. Recouvreux, L. Porto and G. Barra, Synth. Met., 2011, 161, 106–111 CrossRef PubMed.
  20. H. E. Cingil, J. A. Balmer, S. P. Armes and P. S. Bain, Polym. Chem., 2010, 1, 1323–1331 RSC.
  21. N. Pous, C. Koch, J. Colprim, S. Puig and F. Harnisch, Electrochem. Commun., 2014, 49, 93–97 CrossRef CAS PubMed.
  22. A. Prinčič, I. Mahne, F. Megušar, E. A. Paul and J. M. Tiedje, Appl. Environ. Microbiol., 1998, 64, 3584–3590 Search PubMed.
  23. P. Kuntke, M. Geleji, H. Bruning, G. Zeeman, H. V. M. Hamelers and C. J. N. Buisman, Bioresour. Technol., 2011, 102, 4376–4382 CrossRef CAS PubMed.
  24. C. Glass and J. Silverstein, Water Res., 1998, 32, 831–839 CrossRef CAS.
  25. J. M. Caffrey, N. Bano, K. Kalanetra and J. T. Hollibaugh, ISME J., 2007, 1, 660–662 CrossRef PubMed.
  26. B. Li and S. Irvin, Biochem. Eng. J., 2007, 34, 248–255 CrossRef CAS PubMed.
  27. Y. Hamamoto, S. Tabata and Y. Okubo, Water Sci. Technol., 1997, 35, 145–152 CrossRef CAS.
  28. H.-S. Joo, M. Hirai and M. Shoda, J. Biosci. Bioeng., 2007, 103, 66–73 CrossRef CAS PubMed.
  29. L. Belser, Appl. Environ. Microbiol., 1984, 48, 1100–1104 CAS.
  30. Y. Dong, Z. Zhang, Y. Jin, Z. Li and J. Lu, J. Environ. Sci., 2011, 23, 366–371 CrossRef CAS.
  31. A. Okhravi, Master thesis, Lund University, Sweden, W 15007, 2015.
  32. S. Okabe, Y. Oozawa, K. Hirata and Y. Watanabe, Water Res., 1996, 30, 1563–1572 CrossRef CAS.
  33. S. Ballinger, I. Head, T. Curtis and A. Godley, Water Sci. Technol., 2002, 46, 543–550 CAS.
  34. Y. Zhao, B. Zhang, C. Feng, F. Huang, P. Zhang, Z. Zhang, Y. Yang and N. Sugiura, Bioresour. Technol., 2012, 107, 159–165 CrossRef CAS PubMed.
  35. D. Wan, H. Liu, J. Qu, P. Lei, S. Xiao and Y. Hou, Bioresour. Technol., 2009, 100, 142–148 CrossRef CAS PubMed.
  36. H. Wang and J. Qu, Water Res., 2003, 37, 3767–3775 CrossRef CAS.
  37. D. Calzia, I. Panfoli, S. Ravera, E. Dazzi, S. Gandolfo, I. M. Pepe, L. Vergani and A. M. Morelli, J. Biochem. Mol. Toxicol., 2009, 23, 309–317 CrossRef CAS PubMed.
  38. D. Wan, H. Liu, J. Qu and P. Lei, J. Chem. Technol. Biotechnol., 2010, 85, 1540–1546 CAS.
  39. S. Islam and M. T. Suidan, Water Res., 1998, 32, 528–536 CrossRef CAS.
  40. L. Y. Stein and D. J. Arp, Appl. Environ. Microbiol., 1998, 64, 4098–4102 CAS.
  41. M. Zhou, W. Wang and M. Chi, Bioresour. Technol., 2009, 100, 4662–4668 CrossRef CAS PubMed.
  42. P. Clauwaert, J. Desloover, C. Shea, R. Nerenberg, N. Boon and W. Verstraete, Biotechnol. Lett., 2009, 31, 1537–1543 CrossRef CAS PubMed.
  43. B. Virdis, K. Rabaey, R. A. Rozendal, Z. Yuan and J. Keller, Water Res., 2010, 44, 2970–2980 CrossRef CAS PubMed.
  44. J. Cha, C. Kim, S. Choi, G. Lee, G. Chen and T. Lee, Water Sci. Technol., 2009, 60, 1409–1418 CrossRef CAS PubMed.
  45. S. Puig, M. Serra, A. Vilar-Sanz, M. Cabré, L. Bañeras, J. Colprim and M. D. Balaguer, Bioresour. Technol., 2011, 102, 4462–4467 CrossRef CAS PubMed.
  46. M. Safari, A. Rezaee, B. Ayati and A. Jonidi-Jafari, J. Taiwan Inst. Chem. Eng., 2014, 45, 2212–2216 CrossRef CAS PubMed.

This journal is © The Royal Society of Chemistry 2015
Click here to see how this site uses Cookies. View our privacy policy here.