Lulu Pana,
Jianfeng Banc,
Shaorong Lu*a,
Guoxin Chenb,
Jin Yanga,
Qiyun Luoa,
Linyan Wua and
Jinhong Yu*ab
aKey Laboratory of New Processing Technology for Nonferrous Metals and Materials, Ministry of Education, School of Material Science and Engineering, Guilin University of Technology, Guilin 541004, China. E-mail: lushaor@163.com; yujinhong@glut.edu.cn
bKey Laboratory of Marine Materials and Related Technologies, Zhejiang Key Laboratory of Marine Materials and Protective Technologies, Ningbo Institute of Materials Technology and Engineering, Chinese Academy of Sciences, Ningbo 315201, China
cKey Laboratory of Optoelectronic Devices and Systems of Ministry of Education and Guangdong Province, College of Optoelectronic Engineering, Shenzhen University, Shenzhen 518060, Guangdong Province, China
First published on 2nd July 2015
Perylene tetracarboxylic anhydride (PTCDA) was reacted with 6-aminocaproic acid to form the corresponding perylene bisimide (PBI). PBI was used as the foundation for oligomerisation of glycidol in a ring-opening reaction of glycidol leading to a hyper branched, water-soluble glycidol derivative of perylene (PBI-HPG). PBI-HPG was bound to the reduced graphene oxide via π–π stacking resulting in a compound termed PBI-HPG/RGO. The structure and morphology of PBI-HPG/RGO were investigated by infrared spectroscopy (FT-IR), wide angle X-ray diffractometry (WAXD), transmission electron microscopy (TEM), atomic force microscopy (AFM) and X-ray photoelectron spectroscopy (XPS). PBI-HPG/RGO was blended at different loadings in order to improve the thermal and mechanical properties of epoxy composites. The maximum Tg of the epoxy composites was about 20 °C and the decomposition temperature (Td) was 26 °C higher than that of neat epoxy. The incorporation of PBI-HPG/RGO yields a material with an impact strength of 39.6 kJ m−2 and a tensile strength at 0.7 wt%. It increased by 50.8% and 62.3%, respectively, compared to the neat epoxy.
Reduced graphene oxide (RGO) is comprised of a single layer of aromatic carbon atoms. RGO has attracted considerable attention in recent years due to its mechanical strength, thermal conductivity and electrical mobility properties.4,5 RGO has been applied in various fields, such as microelectronic devices, energy-storage materials and fillers for conductive materials.6,7 The main features of composites involving RGO are their strength, quasi-static fracture toughness and electrical and thermal properties compared to the neat polymer.7 The bottleneck in the application of RGO is its tendency for irreversible aggregation induced by strong van der Waals forces.8 To ensure full use is made of the properties of RGO, chemical modifications of RGO become necessary to improve the dispersion and interfacial forces between RGO and the polymer matrix.9 For example, covalent or non-covalent modification of the RGO can prevent their aggregation. However, covalent functionalization can alter the electronic structure of RGO. Therefore, non-covalent modification, such as π–π stacking interactions are preferred.6 In order to explore the cooperative π–π assembly between RGO and a planar aromatic molecule we choose perylene bisimide (PBI) as the organic molecule. The use of PBI is justified due to its chemical structure and thermal stability.10
Perylene bisimides have attracted attention in theoretical and applied research.11 PBI have been used in n-type semiconductor materials, light collection, organic light-emitting devices and supramolecular self-assembly due to PBI’s good thermal stability, chemical inertness and high fluorescence quantum yield.12 Some attention has been focused on the modification of the structure of perylene bisimide in order to improve the chemical and physical properties, such as its poor water-solubility.13 The perylene bisimide has a planar, benzene ring structure, thus it tends to assemble via noncovalent interactions, such as hydrogen bonding, van der Waals and π–π stacking interactions.10,14 Consequently it could bind well to RGO. However, the solubility of PBI is a hurdle in this application. A solution is offered by Haag and coworkers, who bound hyper-branched polyglycerol (HPG) onto the imide functionality of PBI to form fluorescent and water-soluble PBI dyes. Their approach provides opportunities to fabricate compounds based on RGO and perylene bisimide in aqueous media.15 This pathway is especially promising, as hyper-branched polyglycerol can be used to improve the toughness of cured epoxy resin in its own right due to the number of terminal groups/potential binding sites in HPG. The hydroxylic terminal groups can interact with epoxy, without sacrificing the intrinsic properties of HPG.16
Hyperbranched polyglycerols (HPGs) belong to a group of macromolecules known as dendrimers or dendritic polymers. The distinctive characteristics of HPG dendrimers is their highly branched structure containing many hydroxyl groups on the surface, which not only increases their solubility but also decreases their intrinsic viscosity.16,17 They have attracted considerable attention over the past few years due to their unique molecular structure and properties.18 HPGs can be synthesized via the anionic ring-opening reaction of glycidol. The advantages of this synthesis method are a simple “one-step” reaction, good control of the course of reaction, a narrow polydispersity and the ease with which HPGs can be modified with functional groups.19,20 In addition, HPGs have excellent water solubility and biocompatibility.18
We aimed to combine HPGs and perylene bisimides to prepare a hybrid material that can be used to bind to RGO and address its tendency to agglomerate. Such material brings to the compound the water-solubility of perylene bisimides and the combined chemical and physical properties of both HPGs and PBI.21 The PBI-HPG was reacted with RGO by self-assembly of functional groups on the RGO nanosheets via π–π stacking interactions. The resulting product was named PBI-HPG/RGO. PBI-HPG/RGO was incorporated into the epoxy resin and the mechanical and thermal properties of the composite were studied and compared to neat.
:
1. After that, the mixture was refluxed in a three-necked flask under nitrogen protection at 100 °C for 24 h. After completion of the reaction, the product was washed with DMF–ethanol several times and centrifuged at 9500 rpm to remove unreacted PBI-HPG. The dark solid product marked as PBI-HPG/RGO was dried overnight under vacuum at 60 °C. The synthetic route is shown in Scheme 1.
O stretching. Upon reaction of perylene tetracarboxylic anhydride with 6-aminocaproic acid to form PBI, absorbance bands of the hydroxyl functional group (3428 cm−1) and the aliphatic C–H group (2926 cm−1 and 2856 cm−1) can be observed. The band at 3428 cm−1 can be explained by the overlap between a free hydrogen bond and N–H stretching vibration. Thus, these characteristic absorption bands indicated the reaction between perylene and 6-aminocaproic acid. Several new peaks were observed in the FT-IR spectrum of the PBI-HPG. The band at 1726 cm−1 corresponded to an ester bond which was formed by the reaction of the hydroxyl group of glycidol and carboxylic groups at the end of PBI.26 The typical absorbance peaks appearing at 1120–1075 cm−1 could be attributed to C–O bonds. This confirmed that glycidol had successfully reacted with PBI via a ring opening reaction.27 In the spectra of the RGO the absorbance band of aromatic C
C bonds of graphene was in the 1570–1690 cm−1 region. The presence of RGO was confirmed by FT-IR where there was no oxygen functionality except for the –OH group which might be due to incomplete reduction of GO as shown in spectra at 3431 cm−1.28 Comparing the spectra of PBI-HPG and PBI-HPG/RGO it can be seen that the intensity of the peaks at 1729 cm−1 and 1120–1075 cm−1 region gradually became weaker due to the π–π stacking interactions between the RGO and PBI-HPG.27 The bulk of the RGO impeded some further groups, which decreased the intensity of the signals associated with their bonds. Other absorbance peaks didn’t change or shift too much compared to the spectrum for PBI-HPG. This indicated that PBI-HPG/RGO was successfully synthesized.
Thermal stability is an important property for potential applications. The TGA curve of each product is scrutinized and shown in Fig. 1(b). It can be seen from Fig. 1(b) that the initial decomposition temperature of the PBI was about 300 °C, which was attributed to the loss of the alkyl chain segment of 6-aminocaproic acid. This indicated that the addition of the alkyl chain segment could reduce the decomposition temperature. The final decomposition temperature was around 500 °C, which was the decomposition of the benzene ring of perylene bisimide. RGO kept stable over a wide temperature range, and exhibited good thermal stability. RGO lost only 8.3% weight due to the pyrolysis of the residual oxygen-containing functional groups at 400 °C. From the curve of PBI-HPG it can be seen that the major weight loss occurred between 200 °C and 480 °C. This could be attributed to the loss of glycidol units from the HPG units of PBI-HPG.29 The main degradation stage ended at about 500 °C and the residue yield calculated at 700 °C was about 40 wt%. As shown in the TGA curve of PBI-HPG/RGO, addition of RGO had a stabilising effect on PBI-HPG. PBI-HPG/RGO decomposed at higher temperatures than PBI-HPG. As can be seen in Fig. 1(b) the main weight loss occurred between 230 °C and 480 °C and the residue yield calculated at 700 °C was about 70 wt% of its total weight. These changes suggested that the product PBI-HPG/RGO was successfully synthesised.
The wide-angle X-ray diffraction (WAXD) patterns of RGO, PBI-HPG and PBI-HPG/RGO are shown in Fig. 1(c). The WAXD results indicated interlayer spacing and stacking between the PBI-HPG and RGO. The RGO pattern showed four reflections at 2θ = 24.4°, 2θ = 42.0–43.6°, 2θ = 48.9–50.8° and 2θ = 72.6°. This pattern confirmed that the RGO had a crystalline structure and ordered arrangement. The weak broad reflection at around 24° was characteristic for RGO.30,31 The value at about 2θ = 43° could be assigned to the [100] plane of the graphene nanosheets.32 The PBI-HPG pattern showed a broad reflection at about 2θ = 24.6°, which suggested that PBI-HPG was disordered and X-ray amorphous or polycrystalline. This conformed to the structural properties of a hyperbranched polymer.4
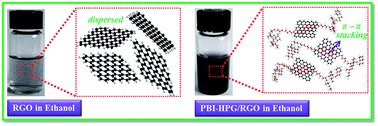
The pattern of PBI-HPG/RGO was a combination of patterns of RGO and PBI-HPG. The intensity of some reflections was distinctly weakened compared to RGO, which showed that the amorphous PBI-HPG had stacked onto the RGO nanosheets and the hyperbranched polymer might weaken the diffraction intensity through the dilution effect of polymer chains.28,33 So, the PBI-HPG was less crystalline than RGO. The wide-angle X-ray diffraction experiment proved the successful stacking of PBI-HPG and RGO. The optical photographs of PBI-HPG and PBI-HPG/RGO solution are shown in Fig. 1(d). The PBI-HPG dissolved well in distilled water and DMSO. Fig. 1(e) shows the RGO and PBI-HPG/RGO dispersion in ethanol. From the images it could be concluded that the dispersion of RGO could be improved by the joining of PBI-HPG via π–π stacking force.
The 1H-NMR spectrum provided more detailed evidence to prove that PBI and PBI-HPG were synthesised successfully, as depicted in Fig. 2. As can be seen in Fig. 2(a), the characteristic peaks in the chemical shift region 7.89–8.23 ppm from the aromatic protons were clearly detected in the 1H-NMR spectra of PBI. The signal at 11 ppm associated with the carboxylic acid proton is weak, as expected for an exchangeable proton. The 1H NMR results were compared with the literature data, thereby this further confirmed the correct structure.23,34 The characterization data of PBI were as follows: 1H NMR (ppm, DMSO): 10.99 (s, 2H, COOH), 7.89–8.23 (s, 8H, ArH), 2.43–2.94 (s, 16H, –CH2–), 1.28 (s, 4H, –CH2–). The 1H-NMR spectrum of PBI-HPG, as shown in Fig. 2(b), shows that the proton resonances belonging to –OH of the PBI-HPG could be found at 2.09 ppm and the proton resonances of –CH2– and –CH– of hyperbranched polyglycidyl were observed at 3.49–4.23 ppm.24 In addition, the aromatic proton peaks of the PBI-HPG at 8.46 ppm and 7.95 ppm were very weak. The protons of –CH2– belonging to 6-amino caproic acid were at 1.30–2.38 ppm. The 1H NMR results confirmed the correct structure. The characterization data of PBI-HPG were as follows: 1H NMR (δ, ppm, D2O): 8.46–7.95 (s, 8H, ArH), 3.49–4.23 (s, 88H, –OCH2– and –CH–), 2.09 (s, 20H, –OH), 1.30–2.38 (s, 20H, –CH2–).
Fig. 3(a) shows the zeta potential of the PBI-HPG/RGO measured at different pH values in distilled water. The zeta potential of PBI-HPG/RGO was recorded in the range from about −3 mV (acidic conditions) to about −40 mV (alkaline conditions). The curve indicated that the surface of PBI-HPG/RGO was negatively charged when dispersed in distilled water even at low pH values. With the increase in alkalinity the quantity of negative charge increased. This was attributed to the high ionization of the hydroxyl groups originating from the PBI-HPG.35 This suggested that the formation of stable PBI-HPG/RGO colloids in aqueous solution was due to electrostatic repulsion.
![]() | ||
| Fig. 3 (a) Zeta potential of PBI-HPG/RGO dispersion in distilled water. (b) UV-vis spectra of PBI-HPG, RGO and PBI-HPG/RGO. (c and d) XPS wide scan and C 1s core-level spectra of the PBI-HPG/RGO. | ||
Fig. 3(b) shows a comparison of UV-vis absorption spectra of PBI-HPG, PBI-HPG/RGO and RGO dispersed in aqueous solution. The spectrum of the PBI-HPG in distilled water showed three characteristic absorption peaks at 470, 499 and 547 nm, which corresponded to the electronic transitions of PBI-HPG.36 However, the three characteristic absorption peaks in the spectrum of PBI-HPG/RGO had a slight shift, and these peaks did not appear in the spectrum of the RGO. The peaks were red shifted by about 10 nm compared to the spectrum of PBI-HPG. This was consistent with the presence of π–π stacking interactions between the PBI-HPG moieties and the RGO nanosheets.2 Thus it further evidenced that the RGO had successfully stacked with PBI-HPG via π–π intermolecular forces.
The X-ray photoelectron spectroscopy (XPS) spectra of the PBI-HPG/RGO showed peaks corresponding to the binding energies of about 284 eV, 399 eV and 531 eV which were attributed to C 1s, N 1s and O 1s energy levels, respectively (Fig. 3(c) and (d)). A strong O 1s signal appeared in Fig. 3(c), suggesting that the PBI-HPG/RGO contained oxygen, which is most likely located in the glycidol groups. The XPS spectrum shows no other elements to be present, indicating the by-products had been washed out during processing.37 The C 1s core-level spectrum of PBI-HPG/RGO (Fig. 3(d)) could be fitted into five components with BEs at about 283.6, 285.0, 285.8, 287.0 and 288.3 eV. These could be attributed to the sp2 hybridized carbon, C–C/C–H, C–O–C/C–OH, N–C
O and O–C
O species, respectively.37,38 The C–O–C/C–OH originated from the hyperbranched polyglycerols moieties of PBI-HPG. The N 1s signal (shown in inset of Fig. 3(d)) was consistent with the PBI-HPG/RGO. The XPS data confirmed that PBI-HPG covered the surface of RGO nanosheets.
Fig. 4(a) shows typical AFM images and the height profiles of RGO and PBI-HPG/RGO dispersed in ethanol, cast onto cleaved mica dried under vacuum at room temperature. The average thickness of RGO was determined to be about 3.5 nm from the height profile of the AFM image suggesting a single layer structure.39 However, the thickness was still larger than the theoretical value of a perfect carbon–carbon bond (sp2) thickness in graphene.40 The result was attributed to the inherent deformation of graphene as well as the instrumental offset of the AFM probe within the range of allowable error.41 The thickness of PBI-HPG/RGO was tested by AFM and the image is shown in Fig. 4(b). In the microscope image a cross-section of a flake could be observed showing RGO with thickness of about 8.5 nm, which indicated the RGO had two or three layers stacked together. In the literature this was assumed to be due to the interactions between PBI-HPG units.27 Because the perylene bisimide has a benzene ring structure, it could bind to RGO via π–π stacking. Thus, the thickness of the PBI-HPG/RGO is not only due to stacking but also due to the added PBI-HPG. From the height profiles of PBI-HPG/RGO it could be seen, that the height increases were much larger than expected for a single or stacked sheet of RGO. The thickness difference between the stacked and un-stacked area was about 16 nm on average,42 which was the thickness of PBI-HPG. The irregularity of the hyperbranched polymer resulted in the rough topology of the PBI-HPG/RGO.43 Hence, we could confirm that the PBI-HPG/RGO had been successfully π–π stacked on the surface of RGO, while the edges of the RGO nanosheets were free.
Fig. 4(b) shows the transmission electron microscopy (TEM) image of RGO and PBI-HPG/RGO. The samples were dissolved in ethanol and distilled water, respectively. Then, one drop of the ethanol suspension was placed on a micro-grid. From the RGO picture can be seen, that the edge of the RGO sheet appeared to be rolled up and crumpled, which was attributed to its intrinsic nature.28,44 The morphology of PBI-HPG/RGO looked folded, indicating the π–π stacking interactions between RGO and PBI-HPG didn’t alter the morphology of nanosheet RGO.2 Some irregular dark shadows were noted (indicated by arrows) on the surface of nanosheet RGO. These could be interpreted as traces of PBI-HPG stacked on RGO via strong π–π interaction.24,38
![]() | ||
| Fig. 5 SEM images of fractured surface of composites with different enlargement fractions: (a and b) neat epoxy, (c and d) 0.1 wt%, (e and f) 0.5 wt%, (g and h) 0.7 wt%, (i and j) 1.0 wt%. | ||
| The content of PBI-HPG/RGO | Temperature at weight loss of 5% (T5) | Temperature at weight loss of 50% (T50) | Char yield at 600 °C (%) |
|---|---|---|---|
| 0.0 wt% | 350 | 396 | 12% |
| 0.1 wt% | 360 | 411 | 24% |
| 0.5 wt% | 376 | 415 | 22% |
| 0.7 wt% | 375 | 409 | 5% |
| 1.0 wt% | 371 | 408 | 7% |
The glass transition temperatures of epoxy composites filled with PBI-HPG/RGO could be derived from DSC heating scans shown in Fig. 7. The Tg of neat epoxy was lower than that of epoxy composites. The highest value 182.9 °C (0.7 wt% epoxy composite) and the lowest value 162.5 °C (neat epoxy) varied by about 20 °C. This was due to the fact that the hyperbranched polymer had lots of functional groups which could react with the groups of epoxy resin. From the curves, Tg increased up to the maximum value when the filler content was 0.7 wt% and then decreased afterwards. RGO with its sheet morphology was an important factor for improving Tg at low filler loading. This was because both the wrinkled structure and large specific surface area of RGO sheets likely induced strong interfacial interactions with polymer chains and larger influence on the thermal properties of the epoxy composites.45 Furthermore, good dispersion of RGO sheets led to the formation of an interphase around each sheet in which the mobility of the chains was constrained. Thus, addition of PBI-HPG/RGO improved the Tg of the epoxy matrix. Otherwise, when filler content exceeded 0.7 wt%, the Tg decreased slightly. This might be due to localized clustering, which allowed the chain segments to move easily and thus decreased the Tg. Another reason was that the decreased degree of cross-linking induced by partial reaction of the curing agent led to a drop in Tg.49 Thus these factors affected the glass transition temperature. The thermal properties of epoxy composites were improved by the PBI-HPG/RGO compound.
The thermal conductivity and diffusivity of the fabricated epoxy composites containing PBI-HPG/RGO were examined as a function of the PBI-HPG/RGO content and the results are shown in Fig. 8. It was evident that the thermal conductivity increased steadily with the incorporation of the PBI-HPG/RGO. The thermal diffusivity of the epoxy composites showed a similar trend. This tendency of increase promised higher thermal conductivity higher loadings of PBI-HPG/RGO.
The thermal conductivity of neat epoxy was around 0.24 W m−1 K−1. The thermal conductivity of epoxy composites with the 1 wt% PBI-HPG/RGO was 0.33 W m−1 K−1, which is slightly higher than that of the neat epoxy. It is known that the thermal conductivity is related to the loading and dispersion of fillers and the thermal resistance of the interface between the fillers and matrix.50 This phenomenon might be attributed to filler loading factors. The PBI-HPG/RGO filler were well dispersed in the epoxy composites, resulting in a strong interface thermal resistance between the fillers and the epoxy matrix. Further comparison of the heat dissipation between the neat epoxy and its composites was performed using infrared imaging technology, as shown in Fig. S2 and S3.†
Fig. 9 exhibits the dynamic mechanical spectrum of different mass fraction epoxy composites, which shows the storage modulus and tan
δ. The storage modulus and tan
δ rose with increasing amounts of filler. As can be seen in Fig. 9(a), it was found that storage modulus of neat epoxy was lower than that of the epoxy composites. The storage modulus of the epoxy composites decreased with an increase in temperature. This was attributed to the energy dissipation due to the mobility and movement of the polymer chains.51 However, the storage modulus increased with the addition of the filler’s content over the whole temperature range, and the storage modulus curves of composites shifted to higher temperatures after addition of the PBI-HPG/RGO. The addition of 0.7 wt% PBI-HPG/RGO produced a significant increase of 35.8% from 1233.7 to 1674.8 MPa in the storage modulus at about 137 °C. It can be surmised that the filler was conducive to improve the storage modulus of epoxy composites.
![]() | ||
Fig. 9 (a) The storage modulus and (b) tan δ of epoxy composites at 1 Hz frequency. (c and d) Different frequency testing of epoxy composites with 0.7 wt% PBI-HPG/RGO. | ||
Fig. 9(b) shows tan
δ values of epoxy composites. In a sense, the tan
δ was equivalent to glass transition temperature (Tg). From the curves we can see that the Tg of the neat epoxy and its composite with 0.7 wt% PBI-HPG/RGO were 158.8 °C and 201.4 °C, respectively, which increased by about 42.6 °C. The storage modulus and Tg both followed the trend of reaching a maximum with increasing filler content. This could be attributed to the following two factors: the cross-linking density was an important indicator for the impact strength and thermal performance, because the cross-linking density dampened the motion of the polymer chain and reduced the free volume, it could increase the storage modulus and tan
δ. However, once the cross-linking density exceeded a critical value it resulted in phase separation and the formation of reactive sites. Thereby it impaired the cross-linking reaction between epoxy resin and compound PBI-HPG/RGO.52 The second factor is the dispersion of the filler in the resin. The dispersion was good at low filler contents, but declined when the content exceeded 0.7 wt% due to the agglomeration of excess filler particles. Fig. 9(c) and (d) displays the dynamic mechanical performance under different frequencies of epoxy composites with 0.7 wt% PBI-HPG/RGO. The energy storage modulus increased with increasing frequency, but the amplitude of growth was not very consistent. Thus, the conclusion was that the influence of frequency on the storage modulus was not as important as the dispersion and the cross-linking. Based on these findings, it was suggested that a low amount (0.7 wt%) of the compound PBI-HPG/RGO could improve the thermodynamic performance of epoxy resin.
![]() | ||
| Fig. 10 (a) Typical stress–strain curves, (b) Young’s modulus and toughness, (c) impact strength and tensile strength and (d) flexural strength and modulus of the epoxy composites. | ||
The bending performance of the samples is shown in Fig. 10(d). From the graph in the Figure could be concluded that the flexural strength and modulus of epoxy composites were increased compared to neat. The flexural strength of neat epoxy was 79.5 MPa and up to 121.6 Mpa for the composites. The trend of flexural modulus was the same as for the flexural strength, with the modulus value ranging from 1840.0 MPa to 2195.0 MPa. The addition of 0.7 wt% of PBI-HPG/RGO resulted in the maximum value in bending performance and tensile properties. The data showing the mechanical properties of neat samples and their composites are summarized in Table 2.
| PBI-HPG/RGO content | Impact strength/kJ m−2 | Tensile strength/MPa | Flexural strength/MPa | Flexural modulus/MPa |
|---|---|---|---|---|
| 0.0 wt% | 26.3 ± 0.9 | 55.4 ± 1.3 | 79.5 ± 2.5 | 1840.0 ± 40.0 |
| 0.1 wt% | 30.3 ± 1.3 | 63.8 ± 0.6 | 102.9 ± 0.4 | 2075.0 ± 35.0 |
| 0.5 wt% | 37.7 ± 0.4 | 75.7 ± 0.7 | 114.6 ± 1.7 | 2140.0 ± 28.0 |
| 0.7 wt% | 39.6 ± 0.5 | 90.0 ± 0.3 | 121.6 ± 1.3 | 2195.0 ± 23.0 |
| 1.0 wt% | 35.0 ± 0.8 | 82.5 ± 0.6 | 117.4 ± 0.3 | 2180.0 ± 31.0 |
Footnote |
| † Electronic supplementary information (ESI) available. See DOI: 10.1039/c5ra09410k |
| This journal is © The Royal Society of Chemistry 2015 |