Study on coating growth characteristics during the electrolytic oxidation of a magnesium–lithium alloy by optical emission spectroscopy analysis

Zhongping Yao*, Qixing Xia, Han Wei, Dongqi Li, Qiu Sun and Zhaohua Jiang
School of Chemical Engineering and Technology, State Key Laboratory of Urban Water Resource and Environment, Harbin Institute of Technology, Harbin 150001, PR China. E-mail: yaozhongping@hit.edu.cn

Received 19th May 2015 , Accepted 28th July 2015

First published on 28th July 2015


Abstract

The aim of this study is to analyze the composition, structure and growth characteristics of plasma electrolytic oxidation (PEO) coatings through optical emission spectroscopy (OES). The PEO coatings were prepared on a magnesium–lithium alloy in a phosphate system at various frequencies. The composition and structure of the coatings were examined using X-ray diffraction (XRD), X-ray photo-electron spectroscopy (XPS) and scanning electron microscopy (SEM), as well as energy-dispersive X-ray (EDX). The discharge sparks of the PEO process were measured by optical emission spectroscopy. The results show that the PEO coating prepared at 50 Hz is composed of crystalline MgO and crystalline Mg3(PO4)2, and that the coating at 500 Hz is composed of crystalline MgO and amorphous Mg3(PO4)2. The coating prepared at 50 Hz has a greater degree of roughness than that prepared at 500 Hz, and the sizes of the micropores on the coating prepared at 50 Hz are considerably larger than that at 500 Hz, whereas the numbers of the micropores at various frequencies change in opposition to the pore sizes. The plasma temperature (Te) calculated with OES at 50 Hz is about 3100 K higher than that at 500 Hz. This means that more energy generated per cycle was applied to the electrode surface at 50 Hz than 500 Hz, which consequently influenced the structure and composition of the coatings. Based on the OES analysis, the growth characteristic of the PEO coatings was proposed to explain the changes of the coating roughness and the formation mechanism of crystalline or amorphous Mg3(PO4)2 at various working frequencies by the Te and the liquid-cooling effect, which was further proven by the experiments designed by changing the electrical parameters of the PEO process. This study also illustrates that the adjustment of the phase composition and structure by the electrical parameters can be well explained by OES. Besides, the corrosion resistance of the MAO coatings was evaluated by the polarization curves in 3.5 wt% NaCl solution. The corrosion resistance of the coatings is mainly determined by thickness and roughness, and the coatings prepared under 500 Hz generally present better corrosion resistance than those prepared under 50 Hz.

1. Introduction

Plasma electrolytic oxidation (PEO), also known as micro-arc oxidation (MAO) or anodic spark deposition (ASD), is one of the electrochemical coating techniques used in proper electrolytes by plasma discharges on the valve metals, including Al, Ti, and Mg and their alloys.1,2 The PEO coatings have excellent properties such as anti-abrasion, corrosion resistance and numerous other functional properties, which present promising application prospects in fields such as aerospace, biomaterial3,4 and catalysis.5,6 The PEO process is composed of a series of complex reactions, including ionic migration, dielectric breakdown and formation and dissolution of oxide layers, especially for spark discharges,7,8 which have a significant influence on the structure, composition and phase formation of PEO coatings.

Recently, optical emission spectroscopy (OES) method has attracted considerable popularity for studying spark discharges during the PEO process in various electrolytes on aluminum,9–11 tantalum,12 magnesium9,13,14 and titanium.15 By detecting the feature lines in OES, the plasma temperature (Te) and electron concentration (Ne) can be calculated.10,16 Li Wang17 examined OES in the PEO process on Mg alloys in various electrolytes and determined that the electron temperature of the excited hydrogen was between 6 × 10³ K and 3 × 10⁴ K by Hβ lines. Hussein et al.10 calculated the Te of PEO reactions on pure Al and observed that the Te (by Al I lines) increases with increasing current density. Jovović et al.13,18 studied the PEO spectra on Mg, Al and Ta alloys, and the spectra were divided into discharging luminescence and discharging strong ionic/atomic emission. Therefore, the OES technique presents a unique advantage over PEO process and mechanism investigations, and much more work is urgently needed to disclose the coating formation mechanisms by this technique, especially the proper combination of OES technique with the traditional analytical methods.

The change in the phase composition is one important aspect to reveal the PEO process and growth mechanism, which are influenced by the substrate, the electrolytes and the technique parameters.19–21 As reported, under higher working frequencies, the composition of PEO coatings on a Mg alloy in the phosphate-based electrolyte consists of only crystalline MgO phase with a large amount of amorphous P.22–24 Conversely, a crystalline Mg3(PO4)2 phase was detected under lower working frequencies.14,24–27 However, the reason for this phase composition change is not further well explained in the aforementioned studies due to their different research targets. In this study, the coatings with various compositions were prepared in the phosphate electrolyte on Mg–Li alloys. The OES technique was used to obtain the spectra during the PEO process, and the growth mechanism was proposed to explain the changes in the phase composition and structure, which was further proved by the experiments designed by changing the electrical parameters of the PEO process.

2. Experimental details

2.1. Preparation of ceramic coatings

Plate specimens with a size of 40 mm × 40 mm × 2 mm were obtained from a Mg–Li alloy with a nominal composition of 4% lithium and 96% magnesium in mass fraction. They were mechanically polished with 240-, 600-, 1000- and 2000-grit SiC sandpaper and cleaned with distilled water before PEO treatment. A homemade single-pulse power of 10 kW was used for plasma electrolytic oxidation of a sample in a phosphate-based electrolyte composed of sodium hexametaphosphate (4 g L−1), sodium polyphosphate (0.8 g L−1), sodium hydroxide (4 g L−1) and sodium fluoride (1 g L−1). The cleaned specimens served as anodes in a water-cooled electrochemical bath made of stainless steel, which was used as a cathode. The coating on the Mg–Li substrate was prepared at a constant current density i of 5 A dm−2. The PEO treatments were carried out for different times ranging from 300 s to 500 s at 50 Hz and 500 Hz, respectively. The duty ratios of both pulses were both equal to 20%. The temperature of the electrolyte was controlled within a range of 10–20 °C with a cooling water flow. After PEO treatment, the obtained specimens were cleaned with distilled water and dried in air.

2.2. Analysis of composition and structure of the PEO coatings

The thickness and roughness of the PEO coating were investigated using a thickness gauge (CTG-10, Time Company, China) and a roughness tester (TR200, Time Group Inc., China), respectively. The morphology and elemental distribution of the surface and cross-section were analyzed by a field emission scanning electron microscope (FE-SEM, FEI, QUANTA-200F, USA) equipped with an energy dispersive X-ray spectrometer (EDS, Oxford Model 7537, England). D/Max-2400 X-ray diffraction was used to characterize the phase composition. The composition and chemical states of the elements on the PEO coating surface were investigated by X-ray photoelectron spectroscopy (XPS; PHI 5700 ESCA System, Al Kα, 1486.6 eV, USA).

2.3. Optical emission spectroscopy

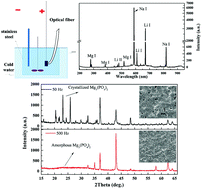
Ocean Optics Sensor OES (QE6500, Ocean Optics, USA) was used to characterize the spectrum within the wavelength range of 200–900 nm in the PEO process. The total spectrum was collected every 3 seconds with an integral time of 500 ms. The plasma temperature was calculated based on the calculated equation shown in eqn (1),10,12 where I(1) and I(2) are the relative line intensities of the lines of the same species under investigation, Amn(i) are the transition probabilities, m(i) are the upper level of the respective lines, gm(i) are the statistical weights of the upper levels, λ0(i) are the wavelengths of the line centers in vacuum, Em(i) are the energies of the upper levels of lines and kBT is the thermal energy.28
 
image file: c5ra09378c-t1.tif(1)

2.4. Evaluation of corrosion resistance

Corrosion resistance of the coatings was evaluated in a conventional three-electrode electrochemical cell (a Pt plate was used as the counter electrode, a calomel electrode was used as the reference electrode, and the coated sample with an area of 1 cm2 was used as the working electrode) using an CHI660B electrochemical analyzer (Chenhua, Shanghai, China) in 3.5 wt% NaCl solution at room temperature. The samples were soaked in a NaCl solution for about 60 min to ensure that the open-circuit potential (OCP) of the samples was stabilized before electrochemical measurement was conducted. The Tafel curve was measured from −250 mV to +250 mV of OCP with a sweep rate of 1.0 mV s−1.

3. Results and discussion

3.1. Voltage–time curves

The voltage–time curves in the course of the PEO process at 50 Hz and 500 Hz are shown in Fig. 1. According to the changing trend of voltage–time curves, the entire PEO process is divided into three stages. At stage A (0–60 s), the frequency exerts negligible influence over the breakdown voltage and the voltage rate increases, and dense, tiny white sparks emerge on the substrate electrode surface at around 330 V. At stage B (60–540 s), the voltage curve at 50 Hz increases slowly, whereas the voltage at 500 Hz increases at a relatively high rate of 19 V min−1. Subsequently, the voltages of both frequencies increase more slowly with a similar growth rate of 3 V min−1 at stage C, and the voltage difference between two frequencies was maintained at about 70 V at this stage.
image file: c5ra09378c-f1.tif
Fig. 1 Voltage–time responses during PEO processing of Mg–Li alloy at 50 Hz and 500 Hz.

3.2. Morphologies and composition of the PEO coatings

The prepared ceramic coatings are white and uniform on the macro scale. Fig. 2 shows that the prepared ceramic coatings exhibit typical porous morphology. The sizes of micropores on the coating prepared for 300 s at 50 Hz is uniform from 5 μm to 20 μm. On increasing the PEO time to 1200 s, the size of pores further increased to 50–100 μm. Moreover, the micro cracks emerge on the coating surface. The coatings prepared at 500 Hz are considerably smoother than those prepared at 50 Hz. When the PEO time is 1200 s, the sizes of the pores are slightly increased, whereas the coating smoothness is reduced. This is consistent with the results of the roughness measurement, as shown in ESI Fig. 1. ESI Table 1 shows that the coating is composed of large amounts of Mg, O and P and small amounts of Na and F, and that the relative content of each element on the surface of the PEO coating is similar for both types of coatings.
image file: c5ra09378c-f2.tif
Fig. 2 The surface morphologies of the coatings prepared at (a) 300 s, 50 Hz; (b) 1200 s, 50 Hz; (c) 300 s, 500 Hz; and (d) 1200 s, 500 Hz. The insets of (c) and (d) are the corresponding high-magnification images.

The cross-sectional morphologies of ceramic coatings are shown in Fig. 3. The thickness increased with PEO time for the coatings prepared at two frequencies, which is consistent with the results of the thickness measurement in ESI Fig. 1. At the short working time (less than 900 s), two types of coatings have similar thicknesses. When the PEO time is more than 900 s, the coatings at 500 Hz are thicker than those at 50 Hz. There are many micropores and fissures along the coating section images. For the coating prepared for 300 s at 50 Hz, some micropores are penetrated to the inner layer, even to the substrate. Fig. 4 shows the relative content of the main elements along the cross sections of the PEO coatings. The elemental distribution differences are focused on the interface between the substrate and the coating. Otherwise, the relative contents of all the elements are stable along the cross section of the coatings, except for the large decreases in the positions with numerous defects, such as pores or cracks, within the coating.


image file: c5ra09378c-f3.tif
Fig. 3 Cross-sectional SEM images of the ceramic coatings.

image file: c5ra09378c-f4.tif
Fig. 4 The relative content of elemental distribution on the cross sections of the PEO coatings prepared at (a) 50 Hz and (b) 500 Hz.

Fig. 5 shows the X-ray diffraction patterns of the coatings. The peaks corresponding to Li0.92Mg4.08 (pdf: 65-4080) were evidently characterized. By extending the PEO time, the peaks of Li0.92Mg4.08 were gradually decreased due to increase in the thickness of the coatings. In addition to Li0.92Mg4.08, the coatings obtained at 50 Hz are composed of crystalline Mg3(PO4)2 (pdf: 75-1491) and MgO (pdf: 77-2179). No peaks of crystalline Mg3(PO4)2 are detected for the coatings obtained at 500 Hz. The mound peaks in the 2θ range of 20–40° show that there may be some amorphous compound in the coatings, which may be related to the phosphate from the electrolyte.


image file: c5ra09378c-f5.tif
Fig. 5 XRD patterns of the ceramic coating prepared at various times with the PEO frequencies of (a) 50 Hz and (b) 500 Hz.

To further investigate the composition of the coatings, XPS analysis was conducted, and the full XPS spectrum is shown in ESI Fig. 2, which indicates that the coating is composed of Mg, P, O, F and Na, which is same as the results of the EDS analysis. Fig. 6 shows the high-resolution spectra of major elements in the PEO coatings. As shown in Fig. 6(a) and (b), the typical Mg 1s spectra is fitted to two types of chemical states for peaks at 1304.4 eV and 1305.3 eV, which correspond to magnesium hydroxide and magnesium phosphate,29 respectively. The typical P 2p spectra shown in Fig. 6(c) and (d) can be fitted into two peaks at 133.4 eV and 134.1 eV. The peak at 133.4 eV corresponds to PO43−, and another peak at 134.1 eV corresponds to PO3, which might come from the electrolytic solution.30,31 The typical O 1s spectra shown in Fig. 6(e) and (f) can be fitted into three peaks. The fitted peaks for O 1s at 531.4 eV, 532.10 eV and 533.3 eV correspond to PO43−, MgO and PO3, respectively.29,31 According to the XPS analyses, both the coatings have similar composition. Combined with the XRD analyses, it can be proven that the crystalline MgO is formed in both coatings, and the crystalline Mg3(PO4)2 is generated in the coatings prepared at 50 Hz, whereas amorphous Mg3(PO4)2 is generated in the coatings prepared at 500 Hz.


image file: c5ra09378c-f6.tif
Fig. 6 The high-resolution spectra of major elements in the PEO coatings: (a) Mg 2p, 50 Hz; (b) Mg 2p, 500 Hz; (c) P 2p, 50 Hz; (d) P 2p, 500 Hz; (e) O ls, 50 Hz; and (f) O 1s, 500 Hz.

3.3. OES spectra and OES analysis of the PEO growth process

Fig. 7 shows the emission spectroscopy of PEO process at (a) 50 Hz and (b) 500 Hz. ESI Table 2 shows the main spectral lines observed in the spectroscopy at the corresponding wavelength.28 The PEO spectroscopy demonstrates sodium, hydrogen (α and β), oxygen (Na, H and O, from the electrolyte), and lithium and magnesium (Li and Mg from the substrate). During the entire PEO process, the emission spectra at 500 Hz are obviously stronger than those at 50 Hz. The yellow spark corresponds to the emission line of Na I (589.0 nm), which is the strongest in the entire spectroscopic observation.
image file: c5ra09378c-f7.tif
Fig. 7 Plasma spectroscopy of the PEO process at (a) 50 Hz and (b) 500 Hz for 900 s and typical time variation of the emission line intensity during the PEO process at 50 Hz (c) and 500 Hz (d).

The typical time variation of different plasma emission intensities during the PEO process at 50 Hz and 500 Hz is shown in Fig. 7(c) and (d). In the spectra, the intensity of all the typical emission spectra presents the same changing trends as the PEO time. Combined with the results of the voltage–time curves, the emission lines could scarcely be detected for up to 300 s, and the intensities in the spectrum then rapidly increase. The intensities in all emission spectra at 50 Hz continuously increase for up to 850 s and then slightly decrease subsequently. This means that the PEO reaction at 50 Hz become weak after 850 s; thus, the growing speed of the prepared coating slows down, whereas the emission spectra at 500 Hz first increase until around 400 s and then remain stable at a high strength with the growing speed of the prepared coating larger as compared to that at 50 Hz, as shown in ESI Fig. 1.

Fig. 8 shows typical time variation of Te (by Na I lines) and Na (589.0 nm)/Li (670.8 nm) ratios (b) at 50 Hz and 500 Hz. The Te was calculated to be 8300 ± 830 K to 16[thin space (1/6-em)]000 ± 1600 K at 50 Hz and the Te was 5200 ± 520 K to 14[thin space (1/6-em)]000 ± 1400 K at 500 Hz, as shown in Fig. 8(a); the former is about 3100 K higher than the latter, which is related to the duration time per cycle. At 50 Hz, the duration time per cycle is 4 ms, which is 10 times longer than that (0.4 ms) at 500 Hz; this means that more continuous energy from the power source is applied to the electrode surface each cycle. Consequently, a more severe discharge and larger sparks or micro arcs were observed in the experimental process at 50 Hz, which leads to increases in the roughness and the pore size on the coating surface compared with the coating prepared at 500 Hz. This agrees with the results from the SEM analysis and the roughness measurement.


image file: c5ra09378c-f8.tif
Fig. 8 Typical time variation of Te by Na I lines (a) and Na 589.0 nm/Li 670.8 nm ratios (b) at 50 Hz and 500 Hz.

In addition, the excitation of Li from the substrate is attributed to the high Te; therefore, considerably more Li joined the plasma discharge process at 50 Hz than at 500 Hz, as the results shown in Fig. 8(b). However, the contents of Na and Li in the coating are considerably lower than those of O, Mg and P based on the EDS and XPS analyses. Therefore, the main role of Na and Li in the PEO process is to fulfill the electrical discharge, which forms the electron current during the PEO process. Their contribution to coating growth is considerably smaller than that of O, Mg and P elements. This is consistent with the literature.10,12 Interestingly, the strength of the spectrum line of H is also considerably lower, which is different from many other studies.10,17 This may be related to the element Li from the alloys.

During the PEO process, the formation of the crystalline substances is dependent on the plasma temperature and the quick-cooling effect of the electrolyte. At 50 Hz, the higher Te melts the micro reaction zone sufficiently, and the higher duration time with the high energy levels of each cycle weakens the quick-cooling effect of the electrolyte, which provides sufficient phase transmission time from the amorphous state to the crystalline. Therefore, crystalline Mg3(PO4)2 is formed in the coating. However, the sizes and the lifetime of spark discharges at 500 Hz are relatively smaller and shorter; thus, the amorphous state still remains without sufficient phase transmission time due to the quick-cooling effect. MgO with a higher melting point (3073 K) has a considerably higher formation rate of crystallization nuclei than Mg3(PO4)2 during the PEO process; thus, the crystalline MgO is formed in the coating at both frequencies, as shown in Fig. 9.


image file: c5ra09378c-f9.tif
Fig. 9 XRD patterns of the PEO coating prepared (a) at various frequencies under duty ratio of 20% and current density of 5 A dm−2 and (b) at various current densities and duty ratios at 80 Hz.

Therefore, the formation of the crystalline Mg3(PO4)2 is related to the Te, the duration time per cycle and the liquid-cooling effect, which are determined by the electrical parameters of the PEO process. To verify this, the effects of various electrical parameters in the PEO process on the phase composition were investigated, and the results are shown in Fig. 9. Furthermore, Fig. 9(a) shows that the diffraction peaks of Mg3(PO4)2 become progressively weaker with increasing working frequency, and the crystalline Mg3(PO4)2 does not appear in the coating prepared at 100 Hz. Fig. 9(b) presents that the increase of the duty cycle and the current density give rise to the formation of crystalline Mg3(PO4)2. In fact, decreasing the working frequency, increasing the duration time per cycle or improving the current density is beneficial for the increase of Te (confirmed in ESI Fig. 4) and the reduction of the liquid-cooling effect, which is liable for the formation of crystalline Mg3(PO4)2.

3.4. Corrosion resistance of the coatings

Fig. 10 shows the polarizing curves of the MAO coatings and Mg–Li alloy substrate in 3.5 wt% NaCl solution. The fitting values of the corrosion potential (Ecorr), corrosion current density (Icorr) and polarization resistance (Rp) are shown in Table 1. By comparison of Icorr and Rp, it can be suggested that the corrosion resistance of the MAO coatings is considerably better than that of the substrate, and the MAO coatings prepared under 500 Hz are better than those prepared under 50 Hz.
image file: c5ra09378c-f10.tif
Fig. 10 Tafel polarization curves of the MAO coatings and Mg–Li alloy substrate: (a) 50 Hz and (b) 500 Hz.
Table 1 Fitting results of the polarization curves of the coatings and the Mg–Li alloy substrate
Samples Time/min Ecorr/V Icorr/A cm−2 Rp/Ω cm2
Mg–Li alloy 0 −1.547 4.54 × 10⁻⁴ 87.1
50 Hz 5 −1.440 1.84 × 10⁻⁵ 1379.8
10 −1.387 9.36 × 10⁻⁶ 2785.8
15 −1.353 4.80 × 10⁻⁶ 5363.5
20 −1.338 1.44 × 10⁻⁵ 1969.7
500 Hz 5 −1.182 2.40 × 10⁻⁶ 15[thin space (1/6-em)]656.6
10 −1.150 1.96 × 10⁻⁶ 19[thin space (1/6-em)]168.2
15 −1.066 2.02 × 10⁻⁶ 20[thin space (1/6-em)]122.2
20 −0.860 1.58 × 10⁻⁶ 22[thin space (1/6-em)]522.4


Combined with the aforementioned characterization and OES analysis, it can be concluded that the corrosion resistance of the coatings is not mainly determined by the crystallized or un-crystallized composition of the coatings but by the coating thickness and roughness. The greater the thickness and the lower the roughness are, the better the corrosion resistance is. Under 50 Hz, the coating prepared for 15 min has the best corrosion resistance, which is due to the opposite effects of the thickness and roughness of the coatings. Under 500 Hz, by increasing the reaction time, the coating thickness increases greatly, whereas the roughness does not improve apparently compared with the thickness; therefore, the corrosion resistance of the coatings is gradually increased with the reaction time under the experimental conditions.

4. Conclusions

(1) The PEO coatings on the Mg–Li alloy have typical porous structures. With increasing frequency, pore sizes decrease, while pore numbers increase. The coatings prepared at 50 Hz are composed of crystalline Mg3(PO4)2 and MgO, whereas the coatings at 500 Hz are composed of crystalline MgO and amorphous Mg3(PO4)2.

(2) The PEO conditions are mainly provided by the Na and Li discharges based on the OES, and the plasma temperature of the PEO process at 50 Hz is higher at 3100 K than at 500 Hz, which has been calculated by Na lines. The electrical discharges of Na and Li in the PEO process form the electron current but contribute less to the growth of the PEO coating.

(3) Based on the OES analysis, the phase composition of the coatings is related to the plasma temperature and the duration per cycle, which can be adjusted using the electrical parameters. Decreasing the working frequencies, increasing the duty cycle or the current density is beneficial for the formation of crystalline Mg3(PO4)2.

(4) The MAO coatings greatly improved the corrosion resistance of the Mg–Li alloy substrate, and the corrosion resistance of the MAO coatings prepared under 500 Hz is better than that under 50 Hz. Under 50 Hz, the coating prepared for 15 min exhibits the best corrosion resistance. Under 500 Hz, the corrosion resistance of the coatings is gradually increased with the reaction time under the experimental conditions.

Conflicts of interest

The authors have declared no conflicts of interest.

Acknowledgements

This work was supported by Shanghai Aerospace Science and Technology Innovation Fund Projects (Grant No. SAST201431) and the State Key Laboratory of Urban Water Resource and Environment (Harbin Institute of Technology; No. 2015DX07).

References

  1. A. Yerokhin, X. Nie, A. Leyland, A. Matthews and S. Dowey, Surf. Coat. Technol., 1999, 122, 73–93 CrossRef CAS.
  2. F. Walsh, C. Low, R. Wood, K. Stevens, J. Archer, A. Poeton and A. Ryder, Transactions of the IMF, 2009, vol. 87, pp. 122–135 Search PubMed.
  3. M. Montazeri, C. Dehghanian, M. Shokouhfar and A. Baradaran, Appl. Surf. Sci., 2011, 257, 7268–7275 CrossRef CAS PubMed.
  4. D. Sreekanth and N. Rameshbabu, Mater. Lett., 2012, 68, 439–442 CrossRef CAS PubMed.
  5. K. Kageyama, J.-I. Tamazawa and T. Aida, Science, 1999, 285, 2113–2115 CrossRef CAS.
  6. Y. Yoshida, S. Matsui and T. Fujita, J. Organomet. Chem., 2005, 690, 4382–4397 CrossRef CAS PubMed.
  7. A. Yerokhin, L. Snizhko, N. Gurevina, A. Leyland, A. Pilkington and A. Matthews, J. Phys. D: Appl. Phys., 2003, 36, 2110 CrossRef CAS.
  8. A. Yerokhin, X. Nie, A. Leyland and A. Matthews, Surf. Coat. Technol., 2000, 130, 195–206 CrossRef CAS.
  9. S. Stojadinovic, R. Vasilic, I. Belca, M. Petkovic and B. Kasalica, Corros. Sci., 2010, 3258–3265 CrossRef CAS PubMed.
  10. R. Hussein, X. Nie, D. Northwood, A. Yerokhin and A. Matthews, J. Phys. D: Appl. Phys., 2010, 43, 105203 CrossRef.
  11. M. Sarvan, J. Radic-Peric, B. Kasalica, I. Beica, S. Stojadinovic and M. Perice, Surf. Coat. Technol., 2014, 254, 270–276 CrossRef CAS PubMed.
  12. S. Stojadinović, N. Tadić and R. Vasilić, Electrochim. Acta, 2015, 152, 323–329 CrossRef PubMed.
  13. J. Jovović, J. Phys.: Conf. Ser., 2014, 565, 012013 CrossRef.
  14. J. Liang, P. B. Srinivasan, C. Blawert, M. Störmer and W. Dietzel, Electrochim. Acta, 2009, 54, 3842–3850 CrossRef CAS PubMed.
  15. R. O. Hussein, X. Nie and D. O. Northwood, Mater. Chem. Phys., 2012, 134, 484–492 CrossRef CAS PubMed.
  16. J. Jovović, S. Stojadinović, N. M. Šišović and N. Konjević, J. Quant. Spectrosc. Radiat. Transfer, 2012, 113, 1928–1937 CrossRef PubMed.
  17. L. Wang, L. Chen, Z. Yan and W. Fu, Surf. Coat. Technol., 2010, 205, 1651–1658 CrossRef CAS PubMed.
  18. J. Jovović, S. Stojadinović, N. M. Šišović and N. Konjević, Surf. Coat. Technol., 2011, 206, 24–28 CrossRef PubMed.
  19. S. Stojadinović, R. Vasilić, M. Petković, I. Belča, B. Kasalica, M. Perić and L. Zeković, Electrochim. Acta, 2012, 59, 354–359 CrossRef PubMed.
  20. S. Stojadinović, R. Vasilić, M. Petković and L. Zeković, Surf. Coat. Technol., 2011, 206, 575–581 CrossRef PubMed.
  21. H. Li, V. Rudnev, X. Zheng, T. Yarovaya and R. Song, J. Alloys Compd., 2008, 462, 99–102 CrossRef CAS PubMed.
  22. A. Da Forno and M. Bestetti, Surf. Coat. Technol., 2010, 205, 1783–1788 CrossRef CAS PubMed.
  23. R. Zhang, D. Shan, R. Chen and E. Han, Mater. Chem. Phys., 2008, 107, 356–363 CrossRef CAS PubMed.
  24. P. Bala Srinivasan, J. Liang, R. Balajeee, C. Blawert, M. Störmer and W. Dietzel, Appl. Surf. Sci., 2010, 256, 3928–3935 CrossRef CAS PubMed.
  25. Q. Cai, L. Wang, B. Wei and Q. Liu, Surf. Coat. Technol., 2006, 200, 3727–3733 CrossRef CAS PubMed.
  26. S. Yagi, A. Sengoku, K. Kubota and E. Matsubara, Corros. Sci., 2012, 57, 74–80 CrossRef CAS PubMed.
  27. A. M. Kumar, S. H. Kwon, H. C. Jung and K. S. Shin, Mater. Chem. Phys., 2015, 149–150, 480–486 CrossRef PubMed.
  28. J. E. Sansonetti, W. C. Martin and S. Young, J. Phys. Chem. Ref. Data, 2005, 34, 1559–2260 CrossRef CAS PubMed.
  29. X. Cui, Q. Li, Y. Li, F. Wang, G. Jin and M. Ding, Appl. Surf. Sci., 2008, 255, 2098–2103 CrossRef CAS PubMed.
  30. Y. Barbaux, M. Dekiouk, D. Le Maguer, L. Gengembre, D. Huchette and J. Grimblot, Appl. Catal., A, 1992, 90, 51–60 CrossRef CAS.
  31. H. Zhang, G. Yao, S. Wang, Y. Liu and H. Luo, Surf. Coat. Technol., 2008, 202, 1825–1830 CrossRef CAS PubMed.

Footnote

Electronic supplementary information (ESI) available. See DOI: 10.1039/c5ra09378c

This journal is © The Royal Society of Chemistry 2015
Click here to see how this site uses Cookies. View our privacy policy here.