Graphene oxide nanoparticle attachment and its toxicity on living lung epithelial cells†
Linnea Ahlinderab,
Jiří Henychc,
Susanne Wiklund Lindströma,
Barbro Ekstrand-Hammarströma,
Václav Stenglc and
Lars Österlund*b
aFOI, Division for CBRN Defence and Security, Cementvägen 20, SE-901 82, Umeå, Sweden
bDepartment of Engineering Sciences, The Ångström Laboratory, Uppsala University, P.O. Box 534, SE-751 21, Uppsala, Sweden. E-mail: lars.osterlund@angstrom.uu.se
cDepartment of Material Chemistry, Institute of Inorganic Chemistry AS CR v.v.i., 250 68 Husinec-Rez, Czech Republic
First published on 1st July 2015
Abstract
Since its discovery, graphene and its oxidized form, graphene oxide (GO), have attracted interest in a wide range of technical applications. Concerns about their potential toxicity calls for scrutinized studies, but hitherto conflicting results have been reported which partly may be due to variations of synthesis and exposure procedures. Here we report on the attachment and toxicity of contamination-free graphene oxide nanoparticles (GONP) in living lung epithelial cells. The synthesis of chemically pure GONP was made by an improvement of the Hummer's method based on graphene exfoliated from graphite using high-intensity ultrasonication, resulting in two dimensional sheets with a lateral dimension in the range 200 nm to 3 μm and thickness of 0.9 nm. Confocal Raman spectroscopy combined with multivariate analysis was used to study the interaction of GONP and living cells. It is shown that overlapping Raman bands due to GONPs and biomolecules in the cells can clearly be separated with this approach. Orthogonal partial least squares discriminant analysis was used to compare spectral data collected from cells exposed to GONP with spectral data collected from non-exposed control cells, and spectral data from cells exposed to a surfactant known to induce apoptosis. Our analyses show that GONP readily attach to the cells, forming sheets which cover a large fraction of the cell surfaces, and induce small chemical changes. In particular, chemical modifications of proteins and lipids in lung epithelial cells are inferred. GONPs do not, however, decrease cell viability. In contrast, enhanced cell proliferation is observed. Our results shed new light on the interactions of GO, and in contrast to some previous reports, suggest that GO is not toxic. The hyperspectral Raman spectroscopy analysis employed here should be applicable for other fields in nanomedicine as a label-free non-perturbing analytical method.
Introduction
Graphene, and its oxidized form, graphene oxide (GO), is a new innovative material with many promising applications,1–4 following the awareness that nanomaterials such as GO may possess unique different physicochemical properties compared to their bulk counterpart has, however, raised concerns about their health effects.5 Recent studies have suggested that GONPs can have toxic effects on living organisms,6,7 which calls for careful evaluation of their toxicity, and attention to human exposure and environmental fate.8 In contrast to these very few in vivo studies, GONPs have been subject to a number of in vitro studies. Most of them show that GONPs do not induce toxic effects.5 When measuring the membrane integrity, Chang et al. found that GONPs even produced a slightly lower leakage of intracellular LDH molecules compared to control cells.9 Morphology, cell attachment, as well as ultrastructure were reported to be unaffected by GONPs.9 Reports of cell attachment properties deviate however considerably, and has been shown to be strongly impeded at high GONP concentrations (100 μg ml−1),10 while other studies have reported improved attachment properties.11 A decreased cell viability has only been observed at high concentrations (typically ca. 100 μg ml−1),9,10,12–14 and found to be size dependent.9 A majority of studies suggest that GONPs do not give rise to increased apotosis,9,13 or necrosis,9 for cells exposed to GONPs at concentrations up to 100 μg ml−1,13 or up to 200 μg ml−1.9 One study report, however, apoptosis after exposure to 20 μg ml−1 for 72 h.10 Several studies show that GONPs induce reactive oxygen species (ROS);9,14,15 also at rather low concentrations, 10 μg ml−1.9 GONPs have also been reported to give rise to a dose and size dependent induction of cytokines.13,16 In the study by Matesanz et al. cell cycle alterations was inferred,15 but others report that protein coated GONPs do not affect cell proliferation,11,12 not even at high concentrations (100 μg ml−1).12 Like many other nanomaterials, GONPs can interact with proteins and change their conformation and activity,17 and they can interact with reagents used in toxicity tests,14 although some studies do not show any dependence on culture medium.9 Interaction with cell media is expected to change the GONP stability and their transport properties, which in turn will determine their biodistribution in living organisms. Similar, apparently contradictory, observations have been made upon interaction of GONPs with natural organic matter in aqueous, which either decrease or increase the stability of GONP depending on whether humic acid or polysaccharides are present in the environments.8 Parts of the contradictory results can maybe be explained by differences in particle characteristics, cell lines and/or the particular GONPs being used. It is known that GO contaminated with manganese from the manufacturing process is both cytotoxic, reduces the metabolic activity and causes membrane injury.16 It is currently not known whether the deviating reports on GONP interactions with cells is due to GONP, synthesis residues, or exposure conditions.The uptake of GONPs has been studied in vitro with methods such as transmission electron microscopy (TEM),9,10,12,13 scanning electron microscopy (SEM),12 fluorescence-activated cell sorting,16 and confocal microscopy.12,15 Uptake studies are complicated since GONPs are difficult to discern in TEM,12 and also quenche fluorescence,12,16 and thus must be protein coated in order to be visible in confocal microscopes. The uptake is reported to be dependent on surface coating,15 cell type,15 and exposure time,10,12 Both a particle size dependent,12,15 and independent,16 GONP uptake have been reported. TEM images show particles in cytoplasm, as well as small amounts in the cell nucleus,10 and signs of autophagy,13 while in the study by Chang et al. no observations of particle uptake were seen.9 In the study by Matesanz et al. only a small uptake of PEG coated GONPs were observed in macrophages, and a higher uptake was seen in non-phagocytic cells.15 In the study by Yue et al. a much larger concentration of non-coated GONPs were observed inside macrophages than non-phagocytic cells.16 A suggested explanation for the small uptake of GONPs in non-phagocytes is that the particles are repelled by the negatively charged cell membranes;16 an effect which is reduced by PEG coating.15 On the other hand, the mechanism behind the uptake of GONPs in macrophages has been explained by active phagocytosis, which is relatively insensitive to particle charge.16 It has been suggested that protein-coated GONPs with different sizes are taken up by different mechanisms. Small particles are reported to be taken up mainly by clathrin-mediated endocytosis, while larger particles by a combination of both clathrin-mediated endocytosis and phagocytosis.12
Thus, although there are already a number of toxicology studies of GONPs, many of these show contradictory results. This may be due to variations of synthesis and exposure conditions being employed; in particular, the issue of GONP contamination remains to be settled. Compared to other nanomaterials such as nano-sized titanium dioxide, or carbon nanotubes, the number of studies are, however, still rather few, and more studies are needed to resolve apparent discrepancies in the literature.5 The reports on intracellular uptake are few, and since the particles are both difficult to label with fluorescent dyes and to discern in TEM,12,16 there is an obvious need of a label-free method which facilitates complementary spatially resolved measurements of GONP.
Confocal Raman spectroscopy has been shown to be a promising method for nanoparticle measurements in cells.18–20 The method requires minimal sample preparation and it is non-destructive. Raman spectroscopy is a vibrational spectroscopy method and provides detailed chemical information from molecules and solid particles.18–20 Raman spectra contains chemical fingerprints which can be used to detect of particles or molecules.18–20 Furthermore, Raman spectra of biomolecules can be used in classification models to identify the location of particles in cells,19–23 and also to quantify possible particle-induced chemical changes.24–33 This makes Raman spectroscopy a tool for not only measurements of the number of cells with internalized particles or particles attached to the cell surface, but also for analysis of possible biochemical alterations induced by the particles.
Synthesis of large amounts of GO has so far been limited, but new techniques, including ultrasonication,34 liquid phase exfoliation,35–37 liquid phase-intercalation38–40 and using strong alkaline environment,41 appear promising to overcome this limitation. The first reported procedure to prepare graphene oxide is due to Brodie,42 where graphite was heated in presence of potassium chlorate (KClO3) and fuming nitric acid (HNO3). This procedure was modified by Hummers and Olefman 100 years later43 to yield a faster and more efficient process, using sodium nitrate (NaNO3), sulfuric acid (H2SO4), and potassium permanganate (KMnO4). Various modifications of the Hummer's method are currently the common way to prepare graphene oxide.44–46 The main problem with this method is the formation of manganese heptoxide (Mn2O7) produced by the reaction of H2SO4 and KMnO4,34 viz.
| KMnO4 + 3H2SO4 → K+ + MnO3+ + H3O+ + 3HSO4− | (1) |
| MnO3+ + MnO4− → Mn2O7 | (2) |
Mn2O7 is an unstable compound, which decomposes at a temperature above 55 °C, or when it comes in contact with organic compounds. The reaction of H2SO4 and potassium permanganate, KMnO4, is very exothermic, and may easily exceed safe reaction temperature conditions. Another disadvantage of the Hummer's method is formation of toxic nitrogen oxides. Thus graphene prepared by the Hummer's method may contain chlorate and nitrate anions bonded to its backbone structure, which may affects its physicochemical properties, and in particular its toxicological properties. In this study we employ a completely different method. We use GONP prepared from graphene instead of graphite. With this approach the amount of H2SO4 and KMnO4 can be reduced significantly. Furthermore, to avoid toxic gaseous nitrogen oxides, NaNO3 was replaced by phosphoric acid (phosphorus is a biogenic element) to avoid nitrate anion contamination.
The purpose of this study was to use confocal Raman spectroscopy to study the interaction of lung epithelial A549 cells and chemically pure GONPs. The A549 cell line was A549 was used as a model for cells that can be affected by inhaled particles. The lung is as an important model since inhalation is considered the most likely exposure scenario and since the lung is considered to be the main entry route for nanoparticles.47 Nanoparticle attachment, and possible uptake, was studied with Raman spectroscopy and principal component analysis (PCA). PCA was used to identify Raman spectra with spectral contribution from GONP. Orthogonal partial least squares discriminant analysis (OPLS-DA) was used to compare the spectral profile of biomolecules inside cells and hence study the effect of nanoparticle exposure. The effects of exposure to GONP was also compared to the effect of exposure to Triton X-100, a surfactant that induce apoptosis, by using OPLS-DA and shared and unique structures (SUS) plots.
We show that confocal Raman spectroscopy allows detection of low concentration of GONPs; lower than what currently is reported with TEM and we show that GONPs induce small chemical changes of protein and lipids.
Results and discussion
Particle characterization
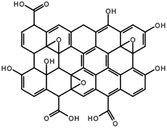
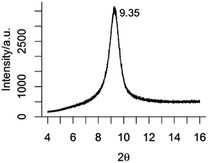
The GONP composition deduced from combustion elemental analysis was typically 41.5 wt% C, 55.5 wt% O and 3.0 wt% H. Similarly, only C and O were detected in energy dispersive X-ray spectroscopy (EDS). No other elements were detected; in particular, no nitrates and phosphates were observed. Complementary solid state 13C NMR (Fig. S1†) and IR analyses41 confirmed the occurrence of hydroxyl C–OH and epoxide C–O–C groups, while no, or very small amounts of, carboxyl C–OOH groups were resolved in the NMR spectra, and no carbonyl C![[double bond, length as m-dash]](https://www.rsc.org/images/entities/char_e001.gif) O groups, supporting the atomic force microscopy (AFM) and SEM/TEM data of large defect free graphene oxide sheets, where carboxyl groups are bonded to edge sites. An example of a graphene oxide structure is in Fig. 1. Fig. 2 shows XRD pattern of GONP showing the characteristic peak at 2θ = 9.35° corresponding to an interlayer spacing of 0.945 nm, indicating the presence of oxygen and oxygen containing functional groups (–OH, –O–) in the interlayer spaces after oxidation.48
O groups, supporting the atomic force microscopy (AFM) and SEM/TEM data of large defect free graphene oxide sheets, where carboxyl groups are bonded to edge sites. An example of a graphene oxide structure is in Fig. 1. Fig. 2 shows XRD pattern of GONP showing the characteristic peak at 2θ = 9.35° corresponding to an interlayer spacing of 0.945 nm, indicating the presence of oxygen and oxygen containing functional groups (–OH, –O–) in the interlayer spaces after oxidation.48
Fig. 3 shows a Raman spectrum of dry GO obtained from the synthesis. The G band at 1587 cm−1 is common to all sp2 carbon forms, and is due to in-plane vibration of sp2-bonded carbon atoms, whereas the D band at 1359 cm−1 indicates the presence of sp3 defects.49
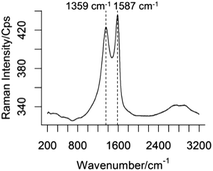 | ||
| Fig. 3 Raman spectra of dry GONPs. The spectrum is a mean spectrum of seven spectra acquired from different positions of a sample of dried GONP on CaF2. | ||
Fig. 4 shows the topography of GONP obtained from AFM, and line scans across the sheets indicted by white lines in the AFM image. The thickness of GONP sheets is determined to be about 0.9 nm and the size is between 300 nm to 3 μm. SEM images show the nanoscale morphology of the GONPs illustrating the atomic-scale flat structure of the sheets and sub-micron grain size of individual GONP (Fig. S2†).
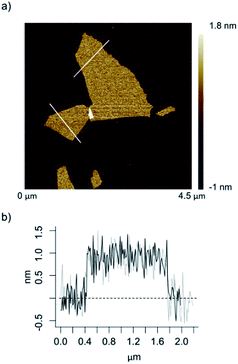 | ||
| Fig. 4 (a) AFM image of GONP sheets, and (b) line scans across the sheets indicated with white lines. | ||
Cell viability
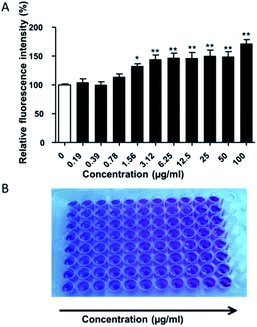
The toxicity of the GONPs was examined using the AlamarBlue assay. The results are in Fig. 5. This assay is based on the ability of living metabolically active cells to reduce the non-fluorescent blue dye, resazurin, to a reduced, fluorescent dye, resorufin. The reduction takes place continuously in viable cells and a decrease in fluorescence intensity thus indicates that the metabolic activity, and hence viability, is decreased. Exposure of GONPs to the alveolar lung epithelial cells (A549) for 30 h resulted in a dose-dependent increase of the fluorescence intensity. Interestingly, this indicates that the GONP sample promotes cell proliferation. We note that the same observation was reported by Ruiz et al., also using purified graphene oxide.11 The lowest exposure level with significant difference to the control, in this case an increased cell viability, was observed at 1.56 μg ml−1 (p < 0.05).Nanoparticle attachment
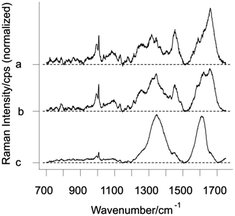
Dry GO has two characteristic Raman bands at ca. 1359 cm−1 and 1587 cm−1 due to the well-known D- and G-bands of sp2-bonded carbon atoms, respectively. In phosphate buffered saline (PBS) solution, these bands were located at ca. 1343 cm−1 and 1609 cm−1. These Raman bands overlap with several Raman bands from biomolecules in cells. The GONP Raman band at 1343 cm−1 overlaps in particular with CH deformations in proteins and Raman bands from DNA/RNA at 1320 cm−1 and 1342 cm−1.31 The GONP Raman band at 1587 cm−1 overlaps with Raman band from the PBS buffer solution, DNA/RNA (1578 cm−1),31 C![[double bond, length as m-dash]](https://www.rsc.org/images/entities/char_e001.gif) C (1607 cm−1, 1617 cm−1)31 and amide I α helix (1660 cm−1).31 Examples of typical Raman spectra from cells exposed to GONPs are shown in Fig. 6. Raman spectra from measurement spots with high amounts of GO are completely dominated by the two strong Raman bands from GO (Fig. 6c). In these cases, the Raman bands from biomolecules in the cells are almost completely obscured. There are also cases when spectral contributions from both biomolecules and GO are apparent (Fig. 6b) and cases when only typical Raman bands from cells are visible (Fig. 6a). Fig. 6a shows a typical Raman spectrum from an unexposed control cell.
C (1607 cm−1, 1617 cm−1)31 and amide I α helix (1660 cm−1).31 Examples of typical Raman spectra from cells exposed to GONPs are shown in Fig. 6. Raman spectra from measurement spots with high amounts of GO are completely dominated by the two strong Raman bands from GO (Fig. 6c). In these cases, the Raman bands from biomolecules in the cells are almost completely obscured. There are also cases when spectral contributions from both biomolecules and GO are apparent (Fig. 6b) and cases when only typical Raman bands from cells are visible (Fig. 6a). Fig. 6a shows a typical Raman spectrum from an unexposed control cell.
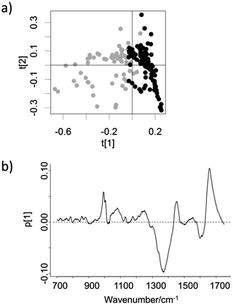
Most measurement spots in cells exposed to 10 μg ml−1 or 15 μg ml−1 were observed to contain large amounts of GONPs, and spectra were thus completely dominated by Raman bands from GO (Fig. 6c). At lower concentrations, 2 μg ml−1, PCA was used for spectral identification of the GONPs. Fig. 7a shows the score plot for component 1, describing 50.9% of the variance in data, and component 2, describing 20.4% of the variance in data in a PCA model of Raman spectra of cells exposed to 2 μg ml−1 GO. Fig. 7b shows the loading plot for component 1. Loading 1 shows strong negative loading values for the two GO bands, i.e. measurements with low score values in component 1 have spectral contribution from GO. Loading 2 (data not shown) describes mainly variation in the intensity of bands from the PBS buffer solution. Guided by the score values in component 1, spectra with GO bands, which overlap with spectral information from biomolecules, were identified.
Fig. 8 shows a bar chart which summarizes the percentage of Raman spectra with spectral contribution from GONP. Raman spectroscopy reveals that a large fraction, 98% of measurements from cells exposed to 15 μg ml−1 GONP, and 94% of measurements from cells exposed to 10 μg ml−1 GONP, show spectral contributions from GONPs, indicating that GONPs are located in the measurement volume; either inside the cell or attached to the cell membrane. In contrast, only 35% of Raman spectra from cells exposed to 2 μg ml−1 GONP showed spectral contribution from GONP.
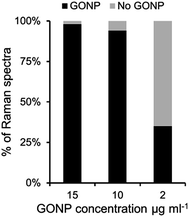 | ||
| Fig. 8 Percentage of acquired spectra from cells exposed to GONPs which show spectral contribution from GONPs. | ||
The Raman spectroscopy results do not conclusively show whether GONPs are internalized after high exposures >10 μg ml−1, or if the particles are attached to the cell membrane, despite the fact that the confocal Raman spectroscopy measurement volume is fairly small (∼90 μm3) in comparison with the cell volume (∼520 μm3, ∼10 μm in diameter and slightly flattened in the Z-direction). The spatial resolution is limited to a few μm under our experimental conditions, and the depth resolution slightly larger.50 The true spatial resolution is, however, difficult to define for transparent samples, such as cells, since out of focus light scattering can contribute to the signal.50 The spectral contributions from a few number of scattering centers outside the confocal depth, such as possible small amounts of NPs left in PBS after rinsing, are, however, negligible, as we previously has shown with in-depth resolved measurements performed on cells exposed to TiO2 nanoparticles.19 Here, a large fraction of the measurement spots from cells exposed to high concentrations of GONPs showed Raman bands due to GONP, suggesting that thin GONP sheets, in contrast to the TiO2 nanoparticles that were studied previously, are attached along the cell membrane, and thus cover a large fraction of the cell surface. In order to quantify this hypothesis TEM measurements were performed on cell sections.
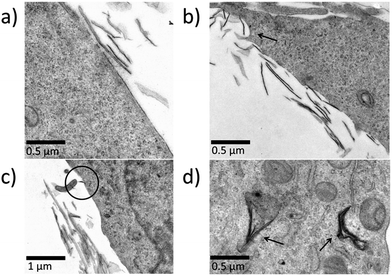
Fig. 9 shows TEM images of cells exposed to GONPs. At low concentration, 2 μg ml−1, no particles were seen; neither inside cells, or attached to the cell surface. TEM of cells exposed to 10 μg ml−1 GONPs showed, however, that GONPs are attached at the cell membrane and, in some cases also are located inside cells. Fig. 9a and b shows GONP sheets attached on the outside of the membrane with their c-axis perpendicular to the membrane, thus lying flat on the membrane. Signs of endocytosis are visible in Fig. 9b (marked by an arrow). In Fig. 9c, a small GONP is seen to penetrate the cell membrane. Fig. 9d shows nanoparticles located inside a cell.
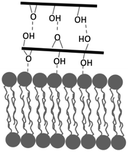
It is not possible to deduce from TEM or Raman how the particles are attached to the cell surfaces. We suggest that hydrogen bonding is involved in the cell–nanoparticle interaction, which may explain the flat arrangement of particles on the cell surface. GONP attachments can also be driven by strong van der Waals forces and –O⋯H–O interactions which favour GONP sheets to attach parallel to each other. In this manner it is probable that cells are covered by GONP multilayer sheets at high concentrations (Fig. 9a). A few small GONP may however bind in different configurations (cf. Fig. 9b and c), which triggers endocytosis and GONP internalization in the cells (Fig. 9d). Fig. 10 shows a schematic picture of suggested GONP attachment on the cells.
Comparison of cells exposed to GO nanoparticles, apoptotic cells and control cells
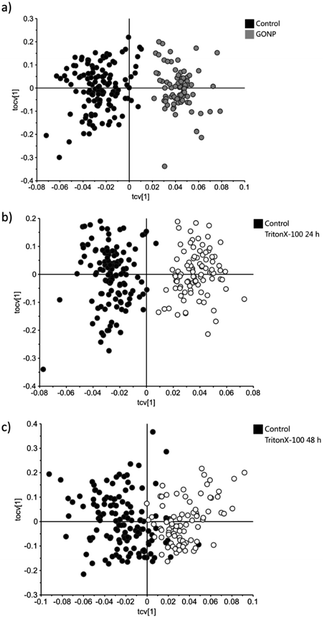
Biochemical modifications induced by GONP were investigated with orthogonal PLS-DA (OPLS-DA), i.e. spectra of biomolecules, such as proteins, lipids and DNA/RNA, acquired from unexposed control cells were compared to spectra of biomolecules from cells exposed to GONP. PLS is a regression method which is based on latent variables. The discriminant analysis method PLS-DA tries to use the Raman spectral information to model class membership, which is a vector of ones (member) and zeroes (non-member). The latent variables, or scores, can be used to study differences and similarities in the spectra and there are loadings that can be used to understand and explain the spectral data. OPLS-DA is an extension of PLS as the algorithm separate predictive information from orthogonal information and thus improves the interpretation.51 With this method, it is possible to identify Raman bands that have changed as an effect of particle exposure and hence identify changes in biochemical composition after particle exposure. In addition, the effect of particle exposure on the Raman spectra of biomolecules was compared to the effects induced by Triton X-100, a surfactant known to induce apoptosis.52 Three separate OPLS-DA models were calculated for the control cells versus cells exposed to GO (referred to as “Control vs. GONP”), control cells versus cells exposed to Triton X-100 for 24 h (referred to as “Control vs. Triton24”) and control cells versus cells exposed to Triton X-100 for 48 h (referred to as “Control vs. Triton48), respectively.Table 1 shows the results of diagnostics obtained from the models. All models have high Q2Y, R2Y and R2X values, indicating that the data fit is good and that the models have a high predictive ability. Control vs. Triton24 was able to correctly classify all spectra in the test set, while Control vs. GONP made one incorrect classification and Control vs. Triton48 gave inconclusive classification of 5 spectra, i.e. these spectra were classified as members of both the control group and the group of cells exposed to Triton X-100 for 48 h.
| Control vs. GONP | Control vs. Triton24 | Control vs. Triton48 | |
|---|---|---|---|
| No. predictive components | 1 | 1 | 1 |
| No. orthogonal components | 5 | 5 | 5 |
| R2Y | 92.1% | 90.6% | 72.7% |
| R2X | 89.4% | 92.3% | 92.9% |
| Q2Y | 82.9% | 86.6% | 63.7% |
| Correct classification | 11 | 10 | 4 |
| Incorrect classification | 1 | 0 | 0 |
| Not classified | 0 | 0 | 5 |
The plots of the cross validated scores in Fig. 11 show that there is a good separation between control cells and cells exposed to GONPs or Triton X-100 for 24 h. The separation is slightly worse for Control vs. Triton48, but it is still evident that most spectra from control cells have negative score values in predictive component 1. For all OPLS-DA models, control cells have low score values in this component.
Fig. 12 shows loading plots, which demonstrate how the Raman bands contribute to the separation seen in the score plots in Fig. 11. In all three models, the Raman band at ca. 1660 cm−1, assigned to amide I α helix and C![[double bond, length as m-dash]](https://www.rsc.org/images/entities/char_e001.gif) C stretches in lipids,31 is correlated to high score values, i.e. exposure to GONP or Triton X-100 for 24 h or 48 h. This band is typically strong in lipid rich regions. A very plausible explanation for the strong Raman band at 1660 cm−1 in spectra from cells exposed to Triton X-100 is that this surfactant alters the lipid conformation. Other studies have reported on similar observations in apoptotic cells after exposure to an anticancer drug.30 GONP, on the other hand, does not decrease the cell viability, as measured with the AlamarBlue assay, and it is not likely that it will give the same biochemical alterations as Triton X-100. Our results suggest that GONP actually promotes cell proliferation, which also has been reported by others.11 TEM and Raman spectra suggest that nanoparticles are adhered to the cell membrane, which is clearly visible at GONP concentrations above 10 μg ml−1. GONPs adhered to the cell membrane was not observed in TEM at the low concentrations (2 μg ml−1) employed in the Raman experiments where OPLS-DA analysis was performed. It is well-known that it is difficult to discern GONP in TEM and therefore, it is probable that small amounts are difficult to discern in TEM.12 However, based on the similar Raman spectral signatures obtained at different concentrations, it is likely that small amount of GO also are adhered to the cell membrane in a similar fashion as seen for higher concentrations. Thus the collected analysis of our data suggests that GONPs accumulates and adhere to the cell membranes at all concentrations, and give rise to detectable modifications of the Raman band at 1660 cm−1. This adhesion does not lead to cell death, as verified by the AlamarBlue assay. We can thus conclude that Raman spectroscopy can be used to measure subtle biochemical modifications in living cells.
C stretches in lipids,31 is correlated to high score values, i.e. exposure to GONP or Triton X-100 for 24 h or 48 h. This band is typically strong in lipid rich regions. A very plausible explanation for the strong Raman band at 1660 cm−1 in spectra from cells exposed to Triton X-100 is that this surfactant alters the lipid conformation. Other studies have reported on similar observations in apoptotic cells after exposure to an anticancer drug.30 GONP, on the other hand, does not decrease the cell viability, as measured with the AlamarBlue assay, and it is not likely that it will give the same biochemical alterations as Triton X-100. Our results suggest that GONP actually promotes cell proliferation, which also has been reported by others.11 TEM and Raman spectra suggest that nanoparticles are adhered to the cell membrane, which is clearly visible at GONP concentrations above 10 μg ml−1. GONPs adhered to the cell membrane was not observed in TEM at the low concentrations (2 μg ml−1) employed in the Raman experiments where OPLS-DA analysis was performed. It is well-known that it is difficult to discern GONP in TEM and therefore, it is probable that small amounts are difficult to discern in TEM.12 However, based on the similar Raman spectral signatures obtained at different concentrations, it is likely that small amount of GO also are adhered to the cell membrane in a similar fashion as seen for higher concentrations. Thus the collected analysis of our data suggests that GONPs accumulates and adhere to the cell membranes at all concentrations, and give rise to detectable modifications of the Raman band at 1660 cm−1. This adhesion does not lead to cell death, as verified by the AlamarBlue assay. We can thus conclude that Raman spectroscopy can be used to measure subtle biochemical modifications in living cells.
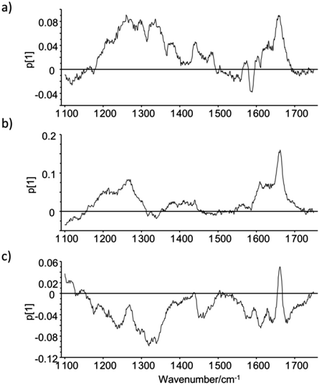 | ||
| Fig. 12 Loading plots for the first predictive loading in component 1 for (a) Control vs. GONP, (b) Control vs. Triton24 and (c) Control vs. Triton48. | ||
Other important spectral differences between control cells and cells exposed to GONP are the region ca. 1190 cm−1 to 1400 cm−1, which is correlated to GONP exposure. In this region there are many overlapping Raman bands from proteins, lipids and DNA/RNA. Examples of Raman bands that are associated with GONP exposure are 1266 cm−1, 1301 cm−1 (CH2 twist in lipids31) and 1335 cm−1. The Raman band at 1587 cm−1, on the other hand, is associated with control cells. Several of these bands are not assigned in the literature, but, again, it seems like GONP affect the lipid structure.
SUS-plots are diagrams of the predictive loadings, scaled as a correlation coefficient between the data matrix and the score vector, for each OPLS-DA model, viz.53
 | (3) |
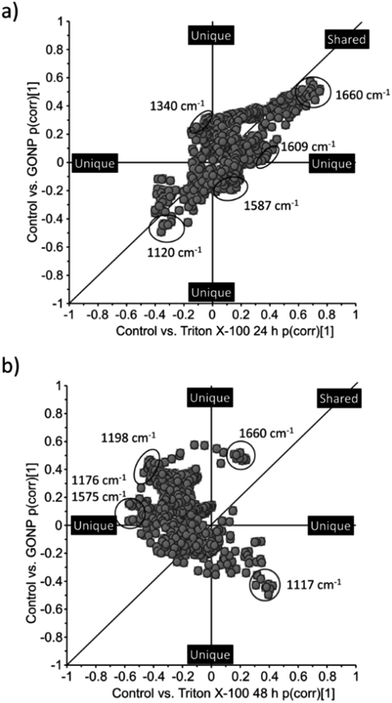
They are tools to compare models and identify the shared and unique structures (Fig. 13).53 High and low p(corr) values correspond to high and low effects, i.e. Raman bands that either contribute to high or low score values. The spectral region ca. 1660 cm−1 is for example high in all models and is thus located in the upper right part of the plots, close to the diagonal. This is an example of a shared structure, i.e. a Raman band that has the same effect in the compared models. Fig. 13 shows SUS-plots where Control vs. GONP is compared to Control vs. Triton24 and Control vs. Triton 48.
Fig. 13a shows the comparison of Control vs. GONP to Control vs. Triton24. Most wavenumbers are located along the diagonal, which indicates that exposure of GONP and Triton X-100 have similar effects. The spectral region ca. 1660 cm−1 has high positive values in both models, while the region ca. 1120 cm−1 has negative values in both models. Wavenumbers that are deviating from the diagonal, and hence have different effects in the two models, are the region ca. 1340 cm−1 (close to Raman band assigned to DNA/RNA and CH deformations in proteins31 and also close to Raman band for GONP), 1587 cm−1 and 1609 cm−1 (close to Raman band assigned to C![[double bond, length as m-dash]](https://www.rsc.org/images/entities/char_e001.gif) C Phe, Tyr in proteins).31 The two former have very little impact in the Control vs. Triton24 model, i.e. they have p(corr) values close to 0, but have greater effect in the Control vs. GONP model. 1340 cm−1 is associated with high p(corr) values, i.e. this Raman band is strong in spectra from cells exposed to GONP. The Raman band at 1587 cm−1 is associated with low score values, indicating that this Raman band is strong in spectra from control cells. The Raman band at 1609 cm−1 is associated with cells exposed to Triton X-100 for 24 h in the Control cells vs. Triton24 model, while it is not associated with any of the groups in the Control vs. GONP model.
C Phe, Tyr in proteins).31 The two former have very little impact in the Control vs. Triton24 model, i.e. they have p(corr) values close to 0, but have greater effect in the Control vs. GONP model. 1340 cm−1 is associated with high p(corr) values, i.e. this Raman band is strong in spectra from cells exposed to GONP. The Raman band at 1587 cm−1 is associated with low score values, indicating that this Raman band is strong in spectra from control cells. The Raman band at 1609 cm−1 is associated with cells exposed to Triton X-100 for 24 h in the Control cells vs. Triton24 model, while it is not associated with any of the groups in the Control vs. GONP model.
The SUS-plot for Control vs. GONP and Control vs. Triton48 in Fig. 13b has almost opposite appearance to the SUS-plot in Fig. 13a. Here, many wavenumbers deviate from the diagonal, i.e. represents the unique structure. 1660 cm−1 has high p(corr) values in both models. The 1198 cm−1 and 1117 cm−1 regions have different contributions to the two models. 1198 cm−1 is correlated to cells exposed to GONP in Control vs. GONP and is correlated to control cells in Control vs. Triton48, while 1117 cm−1 is correlated to control cells in Control vs. GONP and is correlated to cells exposed to Triton X-100 in Control vs. Triton48. An important unique structure in Control vs. Triton48 is 1176 cm−1 (assigned to C–H in plane bend Tyr31) and 1575 cm−1 (close to Raman band assigned to DNA/RNA31), which have p(corr) values close to 0 in Control vs. GONP but are correlated to control cells in Control vs. Triton48.
The SUS-plot in Fig. 13a shows that most wavenumbers are located along the diagonal, i.e. the spectral modifications induced by GONP have similarities to spectral modifications after exposure to Triton X-100 for 24 h. Spectral alterations after exposure to GONPs are, however, partly the opposite to spectral alterations after exposure to Triton X-100 for 48 h (Fig. 13b). All models also show dissimilarities, as expected, since GONP are non-toxic, while Triton X-100 induces apoptosis.52 The difference between exposure to Triton X-100 for 24 h or 48 h can probably be explained by the exposure time. Others have reported on apoptosis after 24 h and 48 h exposure to the same concentration of Triton X-100 that has been employed in this study.52 Cytoplasm retraction was in this study even more pronounced after 48 h exposure.52 It is therefore expected that cells exposed to Triton X-100 for 48 h are more affected by the surfactant than the cells exposed for 24 h and hence, they will have different spectral signature.
Experimental
Synthesis of graphene oxide nanoparticles
Graphene oxide was prepared by an improved Hummer's method.43 The use of graphene instead of graphite makes it possible to decrease the amount of acids used in the synthesis; in particular KMnO4. In addition, since graphene is readily oxidized all graphene is converted to graphene oxide. In a typical synthesis, 60 ml 96% H2SO4, 10 ml 85% H3PO4, 0.75 g graphene and 3 g KMnO4 were mixed in a round-bottom flask. The mixture was heated to 40 °C and stirred for 6 h until a dark pink suspension is formed. The suspension was then poured into a mixture of ice and 200 ml 30% H2O2, and the pink suspension quickly turned bright yellow. The product was purified by dialysis (Spectra/Por 3 dialysis membrane) and centrifuged. Purified GO product was obtained as a brown, honey-like viscous suspension. The oxidation was quantitative when the theoretical yield was assumed to equal the starting graphite mass.Nanoparticle characterization
X-ray diffraction was performed with a Bruker D2 diffractometer equipped with a conventional X-ray tube (CuKαI radiation, 30 kV, 10 mA), employing 0.6 mm primary divergence slit module width, Soller Module 2.5, 2 mm Airscatter screen module, 0.5 mm Ni Kbeta-filter, 0.00405° step-size, 3 s counting time per step, and a LYNXEYE 1-dimensional detector. SEM and TEM were performed with a high resolution FEI Nova NanoSEM, and a FEI Talos F200X allowing for combined high-resolution S/TEM and TEM, EDS signal detection and 3D chemical characterization with compositional mapping. Specimens for SEM investigations were prepared by droplet evaporation of samples dispersion on a Si-supported SEM grid. The specimens were imaged in the low-vacuum mode using 30 kV accelerating voltages. The chemical composition was also determined by combustion elemental analysis (PE 2400 Series II CHNS/O Analyzer, Perkin Elmer). AFM images were obtained using a Bruker Dimension ICON FastScan microscope. AFM samples were prepared by a spin-coating method consisting of pipetting an aqueous suspension of GONP samples onto an atomically smooth support of synthetic mica. The suspension was spin coated on the mica substrate at 6000 rpm. For AFM analysis, a silicon tip on a nitride cantilever was used with ScanAsyst air contact mode (resonance frequencies 50/90 kHz).Cell culture
A549 cells for Raman measurements were cultured on CaF2 substrates in cell media (RPMI-1640, 10% fetal calf serum, 50 mg ml−1 gentamicin) at 37 °C in a humidified atmosphere with 5% CO2. The cells were allowed to attach overnight, and were thereafter exposed to 2 μg ml−1, 10 μg ml−1 or 15 μg ml−1 GONPs for 24 h. The aim of the Raman measurements was to detect small amounts of nanoparticles attached to or internalized in cells and to measure subtle biochemical alterations introduced by the GONPs. High GONP concentrations were therefore not employed in these experiments. Some cells were exposed to 100 μM Triton X-100, which is known to induce apoptosis,52 for 24 h or 48 h. Additional cells were not exposed and were used as negative controls (referred to as control cells). Before Raman spectroscopy measurements cells were washed 3 times and placed in a Petri dish with PBS.Cell viability
Cell viability was measured using the AlamarBlue assay (Serotec Scandinavia, Kidlington, UK). Cells cultured with an initial density of 3 × 10³ in flat-bottomed 96-well plates were exposed to GONPs preparation in 8 replicates at concentrations ranging from 0.19 μg ml−1 to 100 μg ml−1 and incubated for 24 h. Thereafter 20 μl of AlamarBlue was added to each well and the cells were incubated for an additional 6 h, after which their fluorescence was measured by means of fluorescence spectroscopy (560 nm excitation wavelength, and 590 nm emission wavelength) using a Fluorostar plate reader (BMG Labtechnologies GmbH, Hilden, Germany). Unstimulated cells were used as controls. The AlamarBlue assay was also used on GONP suspensions at concentrations ranging from 0.19 μg ml−1 to 100 μg ml−1 to rule out possible nanoparticle–dye interaction. No significant increase in fluorescence intensity was observed (data not shown).All results are expressed as mean values ± standard error of the mean. Data were analyzed by one-way-ANOVA followed by Dunnett's post-test. Data were considered significant at p < 0.05. (*p < 0.05, **p < 0.01). GraphPad Prism Version 3.02 (GraphPad Software, San Diego, CA, USA) for Microsoft, Windows, was used for the statistical analyses.
Transmission electron microscopy
Cell section with 80 nm thicknesses prepared from cells exposed to 10 μg ml−1 or 2 μg ml−1 were contrasted with uranyl acetate and lead citrate, and analyzed with a JEOL 1230 transmission electron microscope and a Gatan MSC 600CW camera, as described elsewhere.32Confocal Raman spectroscopy
All measurements were performed with a Horiba JobinYvon HR 800 confocal Raman spectroscope (Horiba, Villeneuve d’Ascq, France) equipped with a Newton EMCCD detector (Andor, Belfast, UK), and employing a 600 groove mm−1 grating, a 514 nm Ar ion laser (yielding about 13 mW on the sample), and a 60× water immersion objective (NA = 0.9). Each cell was measured at 2–5 positions, randomly selected, with a measurement time of 4 × 30 s. The confocal hole was set to 200 μm, yielding about 5.5 μm axial resolution. A summary of the measured groups and the number of spectra is shown in Table S1 (ESI†). All spectra were background corrected by using a background correction algorithm based on least-squares polynomial curve fitting,54 implemented in the R software v. 3.1.0 (ref. 55) with the hyperSpec56 and Baseline packages.57 Spectra were frequency calibrated against the 1005 cm−1 peak due to the symmetric ring breathing mode of phenylalanine,31 and normalized against the Euclidean norm before analysis. Raman spectra of dry GONP samples were performed with a 100× objective (NA = 0.9) and 60 × 1 s measurement time.Multivariate analysis
PCA58 was employed in Evince ver. 2.5.5 (UmBio, Umeå, Sweden) on mean centered data as a tool to identify spectra with spectral contribution from GO.Spectral variations between control cells and cells exposed to GONP as well as spectral variations between control cells and cells exposed to Triton X-100 for 24 h or 48 h were analyzed by OPLS-DA in Simca ver. 13.0.3.0 (Umetrics, Umeå, Sweden) on mean centered data. The spectral region <1100 cm−1 was excluded because of disturbing spectral signature from the PBS solution. Spectra with low signal-to-noise ratio (intensity < 0.03 cps, after vector normalization, for the 1450 cm−1 Raman band) were excluded. Raman spectra with low S/N ratio most probably originate from measurement volumes which partly contain regions outside cells. Spectra from cells exposed to GONP that had spectral contribution from nanoparticles were also excluded. The spectral signature from GONP overlaps with the Raman bands from biomolecules inside cells and it is therefore not possible to include these data in analysis. The data set contained 91 spectra from cells exposed to 2 μg ml−1 GONPs, 137 (unexposed) control cells, 94 cells exposed to Triton X-100 for 24 h and 92 spectra from cells exposed to Triton X-100 for 48 h. Of these, 20 randomly selected spectra: 5 spectra from control cells, 5 spectra from cells exposed to Triton X-100 for 24 h, 3 spectra from cells exposed to Triton X-100 for 48 h and 7 spectra from cells exposed to GONP, were excluded from the analysis and put in a test set for evaluation of the predicative ability of the model. R2, the explained variance, and Q2, the predicative ability of the model, calculated by cross validation, were also used to evaluate the models.
Separate OPLS-DA models were calculated for cells exposed to GONPs versus control cells, cells exposed to Triton X-100 for 24 h versus control cells and cells exposed to Triton X-100 for 48 h versus control cells. Similarities and dissimilarities between the effect of GONP and Triton X-100 were analyzed with SUS plots.
Conclusion
Confocal Raman spectroscopy shows that cells exposed to GONPs readily attach to lung epithelial cells, forming sheets which cover large fraction of the cell surfaces, and induce small chemical changes. TEM confirms that the GONPs lie flat on the cell surfaces after exposure to concentrations above 10 μg ml−1, whereas at lower concentrations no GONPs were detected. In contrast, Raman spectroscopy combined with PCA was able detect nanoparticles attached to cells at concentrations down to 2 μg ml−1. Multivariate classification with OPLS-DA shows that cells exposed to GONPs and cells exposed to Triton X-100, a surfactant that induces apoptosis, induce modifications of several Raman bands, in particular at 1660 cm−1, which can be assigned to proteins and lipids typically associated with lipid-rich regions, providing chemical evidence of direct chemical interaction between GONPs and the cell membrane. Few GONPs are internalized inside the cells, and no cytotoxic effects are observed as measured with AlamarBlue assay. In contrast, enhanced cell proliferation is observed.Acknowledgements
This study was financially supported by FOI (I44163), Czech Science Foundation No.14-05146S and NATO SfP project no. 984599. The authors thank Lenore Johansson, Umeå University, for TEM characterization, and Petra Ecorchard and Radek Pohl, Academy of Sciences of the Czech Republic, for NMR analysis.References
- V. Štengl, S. Bakardjieva, J. Henych, K. Lang and M. Kormunda, Carbon, 2013, 63, 537–546 CrossRef PubMed.
- V. Stengl, S. Bakardjieva, T. M. Grygar, J. Bludská and M. Kormunda, Chem. Cent. J., 2013, 7, 41 CrossRef PubMed.
- B. Wang, et al., Nanoscale, 2011, 3, 5059–5066 RSC.
- J.-L. Li, X.-L. Hou, H.-C. Bao, L. Sun, B. Tang, J.-F. Wang, X.-G. Wang and M. Gu, J. Biomed. Mater. Res., Part A, 2014, 102, 2181–2188 CrossRef PubMed.
- A. B. Seabra, A. J. Paula, R. de Lima, O. L. Alves and N. Durán, Chem. Res. Toxicol., 2014, 27, 159–168 CrossRef CAS PubMed.
- M. C. Duch, G. R. S. Budinger, Y. T. Liang, S. Soberanes, D. Urich, S. E. Chiarella, L. A. Campochiaro, A. Gonzalez, N. S. Chandel, M. C. Hersam and G. M. Mutlu, Nano Lett., 2011, 11, 5201–5207 CrossRef PubMed.
- F. Ahmed and D. F. Rodrigues, J. Hazard. Mater., 2013, 256–257, 33–39 CrossRef CAS PubMed.
- J. D. Lanphere, B. Rogers, C. Luth, C. H. Bolster and S. L. Walker, Environ. Eng. Sci., 2014, 31, 350–359 CrossRef CAS PubMed.
- Y. Chang, S.-T. Yang, J.-H. Liu, E. Dong, Y. Wang, A. Cao, Y. Liu and H. Wang, Toxicol. Lett., 2011, 200, 201–210 CrossRef CAS PubMed.
- K. Wang, J. Ruan, H. Song, J. Zhang, Y. Wo, S. Guo and D. Cui, Nanoscale Res. Lett., 2010, 6, 8 Search PubMed.
- O. N. Ruiz, K. A. S. Fernando, B. Wang, N. A. Brown, P. G. Luo, N. D. McNamara, M. Vangsness, Y.-P. Sun and C. E. Bunker, ACS Nano, 2011, 5, 8100–8107 CrossRef CAS PubMed.
- Q. Mu, G. Su, L. Li, B. O. Gilbertson, L. H. Yu, Q. Zhang, Y.-P. Sun and B. Yan, ACS Appl. Mater. Interfaces, 2012, 4, 2259–2266 CAS.
- G.-Y. Chen, H.-J. Yang, C.-H. Lu, Y.-C. Chao, S.-M. Hwang, C.-L. Chen, K.-W. Lo, L.-Y. Sung, W.-Y. Luo, H.-Y. Tuan and Y.-C. Hu, Biomaterials, 2012, 33, 6559–6569 CrossRef CAS PubMed.
- K.-H. Liao, Y.-S. Lin, C. W. Macosko and C. L. Haynes, ACS Appl. Mater. Interfaces, 2011, 3, 2607–2615 CAS.
- M.-C. Matesanz, M. Vila, M.-J. Feito, J. Linares, G. Gonçalves, M. Vallet-Regi, P.-A. A. P. Marques and M.-T. Portolés, Biomaterials, 2013, 34, 1562–1569 CrossRef CAS PubMed.
- H. Yue, W. Wei, Z. Yue, B. Wang, N. Luo, Y. Gao, D. Ma, G. Ma and Z. Su, Biomaterials, 2012, 33, 4013–4021 CrossRef CAS PubMed.
- Q. Shao, P. Wu, X. Xu, H. Zhang and C. Cai, Phys. Chem. Chem. Phys., 2012, 14, 9076–9085 RSC.
- K. Wilkinson, B. Ekstrand-Hammarström, L. Ahlinder, K. Guldevall, R. Pazik, L. Kępiński, K. O. Kvashnina, S. M. Butorin, H. Brismar, B. Önfelt, L. Österlund, G. A. Seisenbaeva and V. G. Kessler, Nanoscale, 2012, 4, 7383–7393 RSC.
- P. O. Andersson, C. Lejon, B. Ekstrand-Hammarström, C. Akfur, L. Ahlinder, A. Bucht and L. Österlund, Small, 2011, 7, 514–523 CrossRef CAS PubMed.
- L. Ahlinder, B. Ekstrand-Hammarström, P. Geladi and L. Osterlund, Biophys. J., 2013, 105, 310–319 CrossRef CAS PubMed.
- K. Meister, J. Niesel, U. Schatzschneider, N. Metzler-Nolte, D. A. Schmidt and M. Havenith, Angew. Chem., Int. Ed., 2010, 49, 3310–3312 CrossRef CAS PubMed.
- C. Krafft, M. A. Diderhoshan, P. Recknagel, M. Miljkovic, M. Bauer and J. Popp, Vib. Spectrosc., 2011, 55, 90–100 CrossRef CAS PubMed.
- C. Krafft, T. Knetschke, R. H. W. Funk and R. Salzer, Vib. Spectrosc., 2005, 38, 85–93 CrossRef CAS PubMed.
- E. Brauchle, S. Thude, S. Y. Brucker and K. Schenke-Layland, Sci. Rep., 2014, 4, 4698 Search PubMed.
- T. Tao, Q. Shen, X. Lu, Y. He and L. Zhong, Spectrosc. Lett., 2014, 47, 301–305 CrossRef CAS PubMed.
- M. Lasalvia, G. Perna and V. Capozzi, Appl. Spectrosc., 2014, 68, 1123–1131 CrossRef CAS PubMed.
- G. Perna, M. Lastella, M. Lasalvia, E. Mezzenga and V. Capozzi, J. Mol. Struct., 2007, 834–836, 182–187 CrossRef CAS PubMed.
- G. Pyrgiotakis, O. E. Kundakcioglu, K. Finton, P. M. Pardalos, K. Powers and B. M. Moudgil, Ann. Biomed. Eng., 2009, 37, 1464–1473 CrossRef PubMed.
- I. Notingher, C. Green, C. Dyer, E. Perkins, N. Hopkins, C. Lindsay and L. L. Hench, J. R. Soc., Interface, 2004, 1, 79–90 CrossRef CAS PubMed.
- A. Zoladek, F. C. Pascut, P. Patel and I. Notingher, J. Raman Spectrosc., 2011, 42, 251–258 CrossRef CAS PubMed.
- I. Notingher, S. Verrier, S. Haque, J. M. Polak and L. L. Hench, Biopolymers, 2003, 72, 230–240 CrossRef CAS PubMed.
- I. Notingher, J. Selvakumaran and L. L. Hench, Biosens. Bioelectron., 2004, 20, 780–789 CrossRef CAS PubMed.
- P. Knief, C. Clarke, E. Herzog, M. Davoren, F. M. Lyng, A. D. Meade and H. J. Byrne, Analyst, 2009, 134, 1182–1191 RSC.
- V. Stengl, Chem.–Eur. J., 2012, 18, 14047–14054 CrossRef CAS PubMed.
- M. Quintana, J. I. Tapia and M. Prato, Beilstein J. Nanotechnol., 2014, 5, 2328–2338 CrossRef CAS PubMed.
- L. Hu, Q. Cheng, D. Chen, M. Ma and K. Wu, J. Hazard. Mater., 2015, 283, 157–163 CrossRef CAS PubMed.
- D. K. Dang and E. J. Kim, Nanoscale Res. Lett., 2015, 10, 6 CrossRef PubMed.
- X. Hao, Y. Chen, Z. Wang, J. Liu, W. Zhang and Y. Li, Mater. Express, 2013, 3, 181–184 CrossRef CAS PubMed.
- M. Zhou, L. Qin, P. Cui and J. Tang, Chinese Pat., Patent no. CN 102583351 A, 2012.
- M. Zhou, L. Qin, P. Cui and J. Tang, Chinese Pat., Patent no. CN102583351 B, 2012.
- V. Štengl, J. Henych, J. Bludská, P. Ecorchard and M. Kormunda, Ultrason. Sonochem., 2015, 24, 65–71 CrossRef PubMed.
- B. C. Brodie, Philos. Trans. R. Soc. London, 1859, 149, 249–259 CrossRef.
- W. S. Hummers and R. E. Offeman, J. Am. Chem. Soc., 1958, 80, 1339 CrossRef CAS.
- J. Chen, B. Yao, C. Li and G. Shi, Carbon, 2013, 64, 225–229 CrossRef CAS PubMed.
- D. C. Marcano, D. V. Kosynkin, J. M. Berlin, A. Sinitskii, Z. Sun, A. Slesarev, L. B. Alemany, W. Lu and J. M. Tour, ACS Nano, 2010, 4, 4806–4814 CrossRef CAS PubMed.
- J. Chen, Y. Li, L. Huang, C. Li and G. Shi, Carbon, 2015, 81, 826–834 CrossRef CAS PubMed.
- H. F. Krug and P. Wick, Angew. Chem., Int. Ed., 2011, 50, 1260–1278 CrossRef CAS PubMed.
- D.-W. Wang, A. Du, E. Taran, G. Q. (Max) Lu and I. R. Gentle, J. Mater. Chem., 2012, 22, 21085 RSC.
- C. Chen, W. Cai, M. Long, B. Zhou, Y. Wu, D. Wu and Y. Feng, ACS Nano, 2010, 4, 6425–6432 CrossRef CAS PubMed.
- N. J. Everall, Analyst, 2010, 135, 2512–2522 RSC.
- M. Bylesjö, M. Rantalainen, O. Cloarec, J. K. Nicholson, E. Holmes and J. Trygg, J. Chemom., 2006, 20, 341–351 CrossRef PubMed.
- S. Verrier, I. Notingher, J. M. Polak and L. L. Hench, Biopolymers, 2004, 74, 157–162 Search PubMed.
- S. Wiklund, E. Johansson, L. Sjöström, E. J. Mellerowicz, U. Edlund, J. P. Shockcor, J. Gottfries, T. Moritz and J. Trygg, Anal. Chem., 2008, 80, 115–122 CrossRef CAS PubMed.
- C. A. Lieber and A. Mahadevan-Jansen, Appl. Spectrosc., 2003, 57, 1363–1367 CrossRef CAS.
- R: A Language and Environment for Statistical Computing 2.13.0, R Development Core Team, R Foundation for Statistical Computing, 2014.
- hyperSpec: a package to handle hyperspectral data sets in R. C. Beleites and V. Sergo, 2014.
- baseline: Baseline Correction of Spectra, K. Hovde Liland and B.-H. Mevik, 2014.
- S. Wold, K. Esbensen and P. Geladi, Chemom. Intell. Lab. Syst., 1987, 2, 37–52 CrossRef CAS.
Footnote |
| † Electronic supplementary information (ESI) available: A summary of the cells measured with Raman spectroscopy, NMR spectra of graphene oxide and SEM of graphene oxide. See DOI: 10.1039/c5ra09351a |
| This journal is © The Royal Society of Chemistry 2015 |

