Molecular insight into the dynamical adsorption behavior of nanoscale water droplets on a heterogeneous surface

Jun Zhang*ab, Jie Zhongab, Wen Liab, Muhan Wangab, Bing Liuab, Zhen Liab and Youguo Yan*ab
aCollege of Science, China University of Petroleum, 266580 Qingdao, Shandong, People’s Republic of China. E-mail: zhangjun.upc@gmail.com; yyg@upc.edu.cn
bKey Laboratory of New Energy Physics & Materials Science in Universities of Shandong, China University of Petroleum, 266580 Qingdao, Shandong, People’s Republic of China

Received 18th May 2015 , Accepted 27th May 2015

First published on 29th May 2015


Abstract

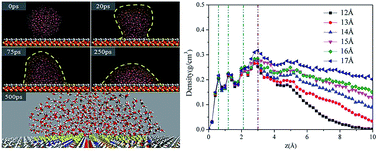
Owing to the outstanding and extraordinary wetting properties, heterogeneous surfaces have extensive and intriguing applications, such as microfluidic systems, inkjet printing and protein hydration. In this work, a heterogeneous surface is constructed by adding one hydrophilic patch at the center of a hydrophobic surface, and the dynamical adsorption process of nanoscale water droplets with different sizes on the heterogeneous surface is investigated adopting molecular dynamics simulations. The detailed adsorption processes and microscopic parameters including contact angle, density distribution profile, interaction energy, etc. are analyzed. The results present that as the droplet size increases, the water droplet would experience spreading, restricting, vibrating and slipping on the heterogeneous surface. In the process of spreading, all the water molecules spread on the hydrophilic patch under the hydrogen-bond interactions. As the droplet size increases, the pre-adsorbed water molecules play the role of an “anchor”, promoting the adsorption of the rest of the water molecules and restricting the water droplets within the hydrophilic patch. By increasing the droplet size further, some water molecules would get rid of the restriction from the pre-adsorbed water molecules and vibrate at the boundary of the hydrophilic patch. Finally, during the process of slipping, the wetting behaviors of the water droplet are dominated by the hydrophobic surface. The wetting behaviors discussed here are helpful for comprehensive exploration of the wetting behaviors of various solutions on the heterogeneous surface at the molecular level, and the present research might trigger further studies on the applications of the homogeneous surfaces.

1. Introduction

Heterogeneous surfaces have been widely used in microfluidic systems,1–4 inkjet printing5–7 and protein hydration,8–11 and most of these applications are tightly related to the unusual wettability of the heterogeneous surface. The wettability of the heterogeneous surface is commonly probed by the contact angle of a water droplet (θ). As to a macroscale droplet, it may stretch across many hydrophilic and hydrophobic blocks of the heterogeneous surface (Fig. 1a). In such cases, θ can be calculated by the Cassie and Baxter equation:12
 
cos[thin space (1/6-em)]θ = f1[thin space (1/6-em)]cos[thin space (1/6-em)]θ1 + f2[thin space (1/6-em)]cos[thin space (1/6-em)]θ2 (1)
herein, f1 and f2 are the fractional areas of the two blocks, and θ1 and θ2 denote the contact angles of water droplets on the heterogeneous surface of the two individual components, respectively.

image file: c5ra09296e-f1.tif
Fig. 1 (a) The macroscale droplet stretches across several blocks of the heterogeneous surface; (b) the nanoscale droplet sits on a single block of the heterogeneous surface. The two components of the heterogeneous surface are represented by red and blue blocks.

When the size of the droplet is small and comparable with the size of the heterogeneous blocks (Fig. 1b), the wetting behavior becomes complicated and intriguing.13–23 Lundgren et al.13 reported that when the size of water droplets and the length of surface heterogeneities were comparable, the contact angle of the water droplet would be similar to that on a homogeneous hydrophilic surface. Whereas the experimental results from Gao and McCarthy14 showed that the contact angle of a microscale water droplet was determined by the interactions of a liquid and solid at the three-phase contact line. Similarly, Ritchie et al.15 also found that the nanoscale wetting behaviors were related to the surface area adjacent to the three-phase contact line, and the contact angle could be predicted by the local Cassie–Baxter mixing relation. All of this research indicates that the wetting behaviors of the micro/nanoscale droplets on the heterogeneous surface are complicated involving various effects coming from different wettability surfaces besides their boundary. This has not been fully understood due to the lack of effective experimental facilities to detect the dynamical wetting process on the heterogeneous surface. Therefore, further studies are urgently needed to unveil the microscopic dynamical wetting mechanism on a heterogeneous surface.

In the past two decades, molecular dynamics simulations have been employed to investigate the interactions between water droplets and solid surfaces, which could depict detailed information about dynamical, energetic and structural properties at the molecular level.24–33 Dutta et al.,34 using molecular dynamics simulations, constructed different sizes of nanoscale water droplets and investigated the size effect of the water droplets on the contact angle at graphite and boron-nitride surfaces. Koishi et al.35 studied the contact angle hysteresis phenomenon of water nanodroplets on nanopillared surfaces. These investigations also indicate that the electrostatic interaction at the interface between water droplets and a solid surface plays an important role in the wetting behaviors of water nanodroplets.

However, it is recently known that special careful treatments for electrostatics are needed for the investigation of polar/point charge models at interfaces. So far, these past results might not be conclusive. Because most of these investigations used the regular Ewald sum method or PME method to calculate the electrostatic interaction at the interface. This might lead to incorrect or misleading results. For example, Hu et al.36 have shown that the use of the regular Ewald sum essentially violates the thermodynamics of the system and therefore leads to incorrect results when the surface is charged or has partial charges. In fact, electrostatics at interfaces in simulations should be treated by one of the following better methods: (i) a complicated but rigorous Ewald 2D method;37,38 (ii) new Ewald sum formulation, (not with tinfoil boundary condition);39 (iii) other approximated methods such as mean field type theories.36,40 Therefore, special attention should be paid to the selection of the computing method for the electrostatics at interfaces.

Even so, this research still proves that molecular dynamics simulations are a powerful method to study the wetting behavior of water nanodroplets. Therefore, in this work, we employ molecular dynamics simulations to investigate the wetting behaviors of nanoscale water droplets on a heterogeneous surface. Initially, the heterogeneous surface is constructed by adding one hydrophilic patch at the center of the hydrophobic surface, and the wettability of the two individual components of the heterogeneous surface (hydrophilic patch and hydrophobic surface) is first evaluated. Then, several water nanodroplets with different sizes are constructed, and the dynamical adsorption configurations of the water droplets on the heterogeneous surface are described in detail. Finally, four wetting processes are proposed as the droplet size increases: spreading, restricting, vibrating and slipping, and the mechanism for these four processes is also analyzed. Our research sheds illuminating light on the microscopic wetting mechanism of droplets on a heterogeneous surface, and these results pave the way for future applications. However, we should state that the present work follows the previously, widely used technique for the calculation of the electrostatics and therefore presents an initial and tentative study on this interesting and important topic. We will carry out much more careful simulations to check the validity of the present work in the future.

2. Theoretical models and methods

Molecular dynamics simulations were carried out with Discover and Amorphous Cell modules in Materials Studio of Accelrys Inc. The constructed model was composed of a heterogeneous surface and water droplets.41

As to the heterogeneous surface, it was constructed by adding one hydrophilic patch at the center of the hydrophobic surface. Firstly, the silica (quartz) lattice was derived from the structural database of Materials Studio. A repeat unit of silica with a depth of 14.1 Å was cleaved along the (001) crystallographic orientation. And then, the surface was completely methylated, and a 16 × 9 × 1 supercell was built to obtain a hydrophobic surface with dimensions of 78.6 × 76.5 × 14.1 Å3. After that, the center with a radius of 20.0 Å was selected, and –CH3 was replaced by –NH2 to obtain the hydrophilic patch.

The SPC/E water model was used in our simulations.35,42 For the water droplets, the radii of the droplets from 8 Å to 22 Å were considered in our simulations (see Table S1 in ESI for the number of water molecules in each droplet). Finally, the water droplet was placed onto the heterogeneous surface to produce the initial model (Fig. 2).


image file: c5ra09296e-f2.tif
Fig. 2 Preparation of the initial configuration of a water droplet adsorbed on a heterogeneous surface. The atoms are colored as follows: O, red; C, gray; N, blue; Si, orange; and H, white.

The condensed-phase-optimized molecular potentials for the atomistic simulation studies (COMPASS) force field was used in the whole simulation.43 The total potential is expressed as:

 
image file: c5ra09296e-t1.tif(2)

The non-bond interactions including the electrostatic interactions (Eele) and van der Waals interactions (EvdW) between the water droplet and the heterogeneous surface are represented by image file: c5ra09296e-t2.tif and image file: c5ra09296e-t3.tif respectively.

The canonical ensemble NVT was performed at 298 K for each system using the Velocity Verlet algorithm.44 The integration step was set as 1 fs. The temperature was controlled by the Andersen thermostat.45 The van der Waals interactions were calculated by the atom based method, and the cutoff distance was 12.5 Å. The electrostatic interactions were calculated by the Ewald method.

During the simulation, the silica surface was fixed because the vibration of these atoms was very small and could be neglected at room temperature. At the top of each model, a 55 Å thick vacuum slab was added to avoid any interaction coming from periodic images in the adjacent simulation box originated from three dimensional periodic boundary conditions. Finally, 1 ns simulations were conducted to relax the systems fully, and the last 100 ps of the trajectory was used for analysis.

3. Results and discussion

3.1 The wettability of the silica surface modified by –CH3 and –NH2

Firstly, we evaluated the wettability of the hydrophilic patch (–NH2) and the hydrophobic surface (–CH3). Snapshots of water droplets spreading on the two individual surfaces are summarized in Fig. 3. At the beginning, the water droplets are ball-shaped on both surfaces. As the simulation proceeds, the ball-shaped configuration of the water droplets is broken owing to the strong interactions between water and the –NH2 surface (see Table S2 in ESI), and water molecules spread rapidly onto the surface possessing an arc-shaped configuration. In contrast, the interactions between water and the –CH3 surface are weak (Table S2), and the equilibrium configuration of the water droplet is hemispherical.
image file: c5ra09296e-f3.tif
Fig. 3 The adsorption configurations of water droplets on the silica surface modified by –CH3 and –NH2.

The contact angle (θ) of a water droplet is a crucial parameter to characterize the wettability of surfaces. Herein, the method of Fan and Caģin46 is exploited for the calculation of θ. In this method, the θ could be calculated by the following equations:

 
image file: c5ra09296e-t4.tif(3)
 
image file: c5ra09296e-t5.tif(4)

The parameters in the above equations are depicted in Fig. 4 (The S corresponds to the contact area between a water droplet and a surface). Based on this method, the wetting angle θ on –CH3 and –NH2 surfaces are calculated as 90.51° and 25.81°, respectively. From these two contact angles, it can be judged that the –CH3 surface is hydrophobic, and the –NH2 surface is hydrophilic.


image file: c5ra09296e-f4.tif
Fig. 4 Geometrical parameters for the calculation of contact angle θ.

To quantitatively study the microscopic adsorption configuration of water molecules, the density distribution profiles of water molecules normal to the surface are diagrammed in Fig. 5, and the surface is set as point zero. It can be seen that the two surfaces have their own distinct characteristic density peak, and these characteristic peaks reflect the structure of water molecules close to the surface.47–50 From Fig. 5, the –CH3 surface has only one weak density peak at 3.58 Å while the –NH2 surface has three obvious density peaks at 0.78 Å, 1.38 Å and 2.18 Å. From the strength and position of these density peaks, it can be concluded that the –NH2 surface has stronger interactions with water molecules than that of the –CH3 surface, and the hydrophilicity of the –NH2 surface is larger than that of the –CH3 surface.


image file: c5ra09296e-f5.tif
Fig. 5 The density distribution profiles of water molecules along z axis on –CH3 and –NH2 surfaces.

3.2 The adsorption configurations of water droplets with different sizes on the heterogeneous surface

According to the above section, the wettability of –NH2 and –CH3 surfaces is evaluated. Using these two surfaces, the heterogeneous surface (Fig. 2) is constructed to investigate the wetting behaviors of nanoscale water droplets on it. Then, the contact angles of the water droplets with different sizes on the heterogeneous surface are calculated (Fig. 6) and the adsorption configurations of the water nanodroplets are also described.
image file: c5ra09296e-f6.tif
Fig. 6 The contact angles of water droplets with different sizes on heterogeneous surface.

From Fig. 6, the contact angle could be classified into three sections. First, when the radius of a water droplet is in the range of 8–11 Å, the contact angle changes a little and is approximately equal to 30°. It is slightly larger than the contact angle of 25.81° on an individual hydrophilic –NH2 surface. The difference could be ascribed to the boundary effect coming from the adjacent hydrophobic –CH3 surface. Second, when the radius of a water droplet is in the range of 12–19 Å, the contact angle increases quickly from 30° to 90°. Finally, after the radius of the water droplet reaches 19 Å, the contact angle changes a little again. It is noticeable that the final contact angle is similar to the contact angle of 90.51° on an individual –CH3 surface.

From these simulations, the configuration changes of water droplets with radius of 8 Å, 12 Å, 16 Å, 19 Å and 22 Å are described. Fig. 7 shows the side views of the water droplets on the heterogeneous surface and the top view of the water molecules near to the surface.


image file: c5ra09296e-f7.tif
Fig. 7 The top views of the water molecules near to the surface and the side views of water droplets on the heterogeneous surface. The radius of the water droplet is listed in the left corner of each snapshot. For the top view, the water molecules are colored as yellow. For the side view, the atoms are colored as follows: O, red; C, gray; Si, orange; and H, white.

From the top view of 8 Å in Fig. 7, all the water molecules are adsorbed on the hydrophilic patch, but do not fully cover it. When the droplet radius ascends to 12 Å, the whole hydrophilic patch is fully occupied by water molecules (top view of 12 Å in Fig. 7), and no water molecules spread over the boundary of the hydrophilic patch. The third typical one is the water droplet with a radius of 16 Å. From the top view of 16 Å in Fig. 7, a few water molecules are found crossing over the boundary of the hydrophilic patch, and these water molecules locate around the boundary. The last one is the water droplet with a radius of 19 Å. The top view of 19 Å in Fig. 7 shows that a large number of water molecules have slipped over the boundary and spread onto the hydrophobic surface, and most of them are far away from the hydrophilic boundary.

From the above analyses about the contact angles and the adsorption configurations, the wetting behaviors of water droplets could be defined as four processes. Firstly, when the radius of the water droplet is in the range of 8–11 Å, the hydrophilic patch has enough area for the water molecules to spread, and their wetting behaviors are similar to that on an individual hydrophilic surface. Therefore, the contact angle is comparable to that on an individual hydrophilic surface. And then, when the radius of the water droplets increases to 12–15 Å, the hydrophilic patch is not enough for so many water molecules to adsorb. Consequently, some water molecules attempt to spread onto the –CH3 surface. However, originating from the strong interactions between water molecules and the hydrophilic patch, the water molecules will be restricted within the hydrophilic area, which results in the ascent of the water droplet height. After that, when the radii of the water droplets reach the range of 16–18 Å, the increasing number of water molecules increases the capability of escaping out of hydrophilic area. Despite some water molecules crossing over the boundary of the hydrophilic patch, they cannot get rid of the restriction completely. As a result, these water molecules only vibrate around the boundary. Hence the contact area enlarges a little, and the increased water molecules mainly contribute to the increase of droplet height. So, the contact angle continues to increase in this range. Finally, when the radius of a water droplet is larger than 19 Å including 19 Å, abundant water molecules adsorb onto the hydrophobic surface. Then the contact angle changes a little with the increase of the water droplet radius. It is approximately equal to that on an individual hydrophobic surface.

Therefore, according to the radius, the wetting behaviors of the water nanodroplets on the heterogeneous surface could be divided into four stages: spreading (8–11 Å), restricting (12–15 Å), vibrating (16–18 Å), slipping (over than 19 Å).

3.3 The wetting mechanism of water droplets with different sizes

3.3.1 Spreading mechanism. First, the mechanism for the spreading process was studied. Generally, water molecules have stronger interactions with hydrophilic surfaces than hydrophobic surfaces owing to the electrostatic interaction (see Table S2 in ESI) and hydrogen bond (HB) interaction. Therefore, when the water droplets are small with radii of 8–11 Å, the water molecules prefer to adsorb on the hydrophilic patch rather than on the hydrophobic surface.

Further explanation about the spreading mechanism is obtained through observing the microscopic adsorption configurations of water molecules on the hydrophilic patch. Fig. 8 shows the top views of water molecules located at the bottom of the droplet with radii of 8–11 Å. It can be seen that the water molecules could form six-membered ring shaped structures on the surface. When the droplet size is small (see the top view of 8 Å), the well-formed structure of a six-membered ring is broken, and many vacancies of water molecules appear on the boundary of the hydrophilic patch. Therefore, there is still a lot of space for water molecules to spread on the hydrophilic patch. As the water droplet radius increases (increasing water molecules), the vacancies are gradually occupied by the water molecules. When the droplet size increases to 11 Å, only a small number of vacancies exist and the water molecules nearly spread over the hydrophilic patch.


image file: c5ra09296e-f8.tif
Fig. 8 The top view of water molecules located at the bottom of the droplet with radii of 8–11 Å.

Therefore, during the spreading process, the hydrophilic patch has enough space for water droplet spreading. As a result, the contact angle of water droplets on the heterogeneous surface is similar to that on an individual hydrophilic surface.

3.3.2 Restricting mechanism. When the radius of the water droplet increases further, the water molecules will be restricted on the hydrophilic patch. Fig. 9 shows the adsorption process of water droplets (15 Å) on the heterogeneous surface, which represents the typical adsorption behavior of water droplets with radii ranging from 12 Å to 15 Å. From Fig. 9, the initial configuration of the water droplet is ball-shaped. Because the water molecules at the bottom of the droplet have strong HBs and electrostatic interactions with the hydrophilic patch, they would rapidly adsorb onto the hydrophilic patch. Then, the water droplet forms a mushroom-shaped configuration (60 ps).
image file: c5ra09296e-f9.tif
Fig. 9 The adsorption process of a water droplet (15 Å) on a heterogeneous surface.

Due to the strong interactions between water molecules and the –NH2 surface, these adsorbed water molecules would be trapped and hard to move, this point could be validated by the diffusion coefficient (D) of these adsorbed water molecules (Table 1). For comparison, the D on –NH2 and –CH3 surfaces and in bulk are all calculated. The diffusion coefficient is described by following the equation:51

 
image file: c5ra09296e-t6.tif(5)
where Ri(t) is the position of atom i at time t, and Ri(0) is the initial position.

Table 1 The self-diffusion coefficients of water molecules on different surfaces
Water molecules D (10−9 m2 s−1)
Total X Y Z
On the –NH2 surface 0.0092 0.0023 0.0032 0.0036
On the –CH3 surface 1.52 0.74 0.48 0.31
Bulk 2.9683 0.93 1.0517 0.985


From Table 1, it can be seen that the D on the –NH2 surface is much smaller than that on the –CH3 surfaces and in bulk. This indicates that these water molecules are tightly adsorbed onto the –NH2 surface. After that, the pre-adsorbed water molecules act as the “anchor” promoting further adsorption of the rest of the water molecules through the nonbonding interactions among water molecules. Then, the mushroom-shaped water droplet finally forms a cambered droplet.

3.3.3 Vibrating mechanism. In order to reveal the vibrating mechanism, Fig. 10 exhibits the typical adsorption process of water droplets (18 Å) on a heterogeneous surface. It can be seen that the adsorption process of water droplets is similar to that in the restricting process. However, because there are more water molecules in a water droplet, the restriction coming from the hydrophilic patch is not enough to catch all of them. As a result, some water molecules spread to the hydrophobic (–CH3) surface. Detailed observation of the equilibrium configurations indicates that these unrestricted water molecules would vibrate at the boundary of the hydrophilic patch.
image file: c5ra09296e-f10.tif
Fig. 10 The adsorption process of a water droplet (18 Å) on a heterogeneous surface.

Why don’t these escaped water molecules adsorb onto the hydrophobic surface stably but vibrate around the boundary of hydrophilic patch? It could be ascribed to the competition between the spreading capability and shrinking capability of a water droplet. The spreading capability is mainly determined by the size of a water droplet. The larger the water droplet is, the higher the spreading capacity of the water droplet. The shrinking capacity could be ascribed to the heterogeneous structure, i.e. the centered hydrophilic patch and the surrounded hydrophobic surface. The hydrophilic patch has strong interactions with water molecules, which makes water molecules adsorb onto it. And, the hydrophobic surface has weak interactions with water molecules, which inhibits the spreading of water molecules on it. Hence, when these escaped water molecules spread onto the hydrophobic surface, they will suffer a strong attraction from the hydrophilic patch, inhibiting the spreading of water molecules. As a result, under the competition of spreading and shrinking, these escaping water molecules would locate around the boundary of the hydrophilic patch and keep vibrating to balance the adsorption configuration.

3.3.4 Slipping mechanism. When the radius of a droplet increases to 19 Å, a large number of water molecules slip over the boundary and adsorb onto the hydrophobic surface. As depicted in Fig. 6, the contact angles after 19 Å including 19 Å change a little and are almost equal to 90°, which is the contact angle on an individual hydrophobic surface. This indicates that the wetting behavior is dominated by the hydrophobic surface.

In order to demonstrate that the hydrophobic surface dominates the wetting behaviors during the slipping process, Fig. 11 shows the density distribution profiles of water molecules on the heterogeneous surface with water droplet radii of 17 Å and 21 Å. For the small droplet with a radius of 17 Å, the location of the characteristic density peaks is the same as that on an individual hydrophilic surface (the –NH2 surface in Fig. 5), which indicates that the hydrophilic patch dominates the wetting behavior. For the large droplet with a radius of 21 Å, the density distribution profile presents hybrid features of that on the –NH2 and –CH3 surfaces in Fig. 5. There is two typical peaks (0.78 Å and 1.38 Å) near the heterogeneous surface. However, compared with the –NH2 surface, the third peak (2.18 Å) almost disappears, and at the position of 3.58 Å, a distinct characteristic peak on the hydrophobic (the –CH3 surface in Fig. 5) surface emerges. Comparing the whole density distribution profiles including the main changing trend and peak strength, it can be concluded that the influence coming from the hydrophilic patch has been strongly weakened, and the wetting behavior is mainly dominated by the hydrophobic surface.


image file: c5ra09296e-f11.tif
Fig. 11 The density distribution profiles of water molecules along the z axis on a heterogeneous surface when the droplet radius is 17 Å and 21 Å.

4. Conclusions

In summary, the wetting behaviors of water nanodroplets with different sizes on a heterogeneous surface are investigated adopting molecular dynamics simulations. Four different wetting processes are observed as the water droplet radius increases. When the size of the water droplet is small (<12 Å), the area of the hydrophilic patch is enough for the spreading of water molecules, and the wetting behavior is similar to that on a hydrophilic surface. As the water droplet radius increases, the strong restricting effect originating from interactions between the hydrophilic surface and water molecules begins to play its role. All the water molecules are restricted within the hydrophilic patch, and the increasing droplet height raises the contact angle. After that, when the water droplet radius is in the range of 16–18 Å, some water molecules spread to the hydrophobic surface. However, under the comprehensive effects from the attraction of the centered hydrophilic patch and inhibition of surrounding hydrophobic surfaces, these escaped water molecules locate around the boundary of the hydrophilic patch and keep vibrating to balance the adsorption configuration. Finally, as the water droplet radius exceeds 18 Å, abundant water molecules cross over the boundary of the hydrophilic patch and adsorb onto the hydrophobic surface. The restriction effect is largely weakened, and the wetting behavior is dominated by the hydrophobic surface.

Our research reveals the microscopic wetting behaviors of water droplets with different sizes on a heterogeneous surface, which is helpful to understand the wetting mechanism of droplets on heterogeneous surfaces and trigger further studies on the applications of the heterogeneous surfaces. However, we should restate that in this study, we follow the previously, widely used technique for the calculation of the electrostatic interaction and therefore present an initial and tentative study on this interesting and important topic. Much more careful simulations to check the validity of the present work should be carried out in the future.

Conflict of interest

The authors declare no competing financial interest.

Acknowledgements

This work is financially supported by the National Major Project of Fundamental Research (2014CB239204), National Natural Science Foundation of China (U1262202, 51302321), Shandong Provincial Natural Science Foundation, China (ZR2014EEM035), PetroChina Innovation Foundation (2013D-5006-0206), Fundamental Research Funds for the Central Universities (14CX05022A, 15CX08003A).

Notes and references

  1. T. T. Vu, M. Fouet, A. M. Gue and J. Sudor, Sens. Actuators, B, 2014, 196, 64–70 CrossRef CAS PubMed.
  2. J. L. Song, K. H. Au, K. T. Huynh and A. I. Packman, Biotechnol. Bioeng., 2014, 111, 597–607 CrossRef CAS PubMed.
  3. Z. Slouka, S. Senapati and H. C. Chang, Annu. Rev. Anal. Chem., 2014, 7, 317–335 CrossRef CAS PubMed.
  4. P. N. Nge, C. I. Rogers and A. T. Woolley, Chem. Rev., 2013, 113, 2550–2583 CrossRef CAS PubMed.
  5. T. Xu, W. Zhao, J. M. Zhu, M. Z. Albanna, J. J. Yoo and A. Atala, Biomaterials, 2013, 34, 130–139 CrossRef CAS PubMed.
  6. M. Wang, S. Shen, J. Yang, E. Dong and R. Xu, 3D printing method for freeform fabrication of optical phantoms simulating heterogeneous biological tissue, International Society for Optics and Photonics, 2014, p. 894509 Search PubMed.
  7. Y. Kwon, Mol. Cryst. Liq. Cryst., 2013, 584, 123–130 CrossRef CAS PubMed.
  8. S. Wang, M. H. Linde, M. Munde, V. D. Carvalho, W. D. Wilson and G. M. K. Poon, J. Biol. Chem., 2014, 289, 21605–21616 CrossRef PubMed.
  9. D. V. Pyrkova, N. K. Tarasova, N. A. Krylov, D. E. Nolde, V. M. Pentkovsky and R. G. Efremov, J. Biomol. Struct. Dyn., 2012, 31, 87–95 Search PubMed.
  10. S. Pronk, E. Lindahl and P. M. Kasson, Nat. Commun., 2014, 5, 3034 Search PubMed.
  11. S. K. Lakkaraju, E. P. Raman, W. Yu and A. D. MacKerell, J. Chem. Theory Comput., 2014, 10, 2281–2290 CrossRef CAS PubMed.
  12. A. B. D. Cassie and S. Baxter, Trans. Faraday Soc., 1944, 40, 546–551 RSC.
  13. M. Lundgren, N. L. Allan and T. Cosgrove, Langmuir, 2006, 23, 1187–1194 CrossRef PubMed.
  14. L. Gao and T. J. McCarthy, Langmuir, 2007, 23, 3762–3765 CrossRef CAS PubMed.
  15. J. A. Ritchie, J. S. Yazdi, D. Bratko and A. Luzar, J. Phys. Chem. C, 2012, 116, 8634–8641 CAS.
  16. M. Cieplak, J. Koplik and J. Banavar, Phys. Rev. Lett., 2006, 96, 114502 CrossRef.
  17. G. McHale, Langmuir, 2007, 23, 8200–8205 CrossRef PubMed.
  18. A. Marmur and E. Bittoun, Langmuir, 2009, 25, 1277–1281 CrossRef CAS PubMed.
  19. J. D. Halverson, C. Maldarelli, A. Couzis and J. Koplik, Soft Matter, 2010, 6, 1297–1307 RSC.
  20. M. James, T. A. Darwish, S. Ciampi, S. O. Sylvester, Z. Zhang, A. Ng, J. J. Gooding and T. L. Hanley, Soft Matter, 2011, 7, 5309–5318 RSC.
  21. J. Wang, D. Bratko and A. Luzar, Proc. Natl. Acad. Sci. U. S. A., 2011, 108, 6374–6379 CrossRef CAS PubMed.
  22. S. C. Cho and Y. Wang, Int. J. Heat Mass Transfer, 2014, 71, 349–360 CrossRef PubMed.
  23. C. Lim and Y. Lam, Nanofluids, 2014, 17, 131–148 CrossRef CAS.
  24. T. Koishi, K. Yasuoka, S. Fujikawa, T. Ebisuzaki and X. C. Zeng, Proc. Natl. Acad. Sci. U. S. A., 2009, 106, 8435–8440 CrossRef CAS PubMed.
  25. N. Shenogina, R. Godawat, P. Keblinski and S. Garde, Phys. Rev. Lett., 2009, 102, 156101 CrossRef.
  26. C. Wang, H. Lu, Z. Wang, P. Xiu, B. Zhou, G. Zuo, R. Wan, J. Hu and H. Fang, Phys. Rev. Lett., 2009, 103, 137801 CrossRef.
  27. C. J. Shih, Q. H. Wang, S. Lin, K. C. Park, Z. Jin, M. S. Strano and D. Blankschtein, Phys. Rev. Lett., 2012, 109, 176101 CrossRef.
  28. T. Koishi, K. Yasuoka, S. Y. Willow, S. Fujikawa and X. C. Zeng, J. Chem. Theory Comput., 2013, 9, 2540–2551 CrossRef CAS.
  29. R. Raj, S. C. Maroo and E. N. Wang, Nano Lett., 2013, 13, 1509–1515 CAS.
  30. C. Zhu, H. Li, Y. Huang, X. C. Zeng and S. Meng, Phys. Rev. Lett., 2013, 110, 126101 CrossRef.
  31. A. K. Metya, S. Khan and J. K. Singh, J. Phys. Chem. C, 2014, 118, 4113–4121 CAS.
  32. N. Kashaninejad, W. K. Chan and N. T. Nguyen, Langmuir, 2012, 28, 4793–4799 CrossRef CAS PubMed.
  33. E. S. Savoy and F. A. Escobedo, Langmuir, 2012, 28, 16080–16090 CrossRef CAS PubMed.
  34. R. C. Dutta, S. Khan and J. K. Singh, Fluid Phase Equilib., 2011, 302, 310–315 CrossRef CAS PubMed.
  35. T. Koishi, K. Yasuoka, S. Fujikawa and X. C. Zeng, ACS Nano, 2011, 5, 6834–6842 CrossRef CAS PubMed.
  36. Z. H. Hu, Chem. Commun., 2014, 50, 14397–14400 RSC.
  37. D. Lindbo and A. K. Tornberg, J. Chem. Phys., 2012, 136, 16411 CrossRef PubMed.
  38. C. Pan and Z. Hu, J. Chem. Theory Comput., 2014, 10, 534–542 CrossRef CAS.
  39. Z. Hu, J. Chem. Theory Comput., 2014, 10, 5254–5264 CrossRef CAS.
  40. Z. Hu and J. D. Weeks, Phys. Rev. Lett., 2010, 105, 140602 CrossRef.
  41. Materials Studio 4.0.DMol3, Accelrys, CA, USA, 2005 Search PubMed.
  42. H. J. C. Beredensen, J. R. Grigera and T. P. J. Straatsma, Phys. Chem., 1987, 91, 6269–6271 CrossRef.
  43. H. Sun, J. Phys. Chem. B, 1998, 102, 7338–7364 CrossRef CAS.
  44. P. Allen and D. J. Tildesley, Computer Simulation of Liquids, Clarendon Press, UK, 1987 Search PubMed.
  45. H. C. Andersen, J. Chem. Phys., 1980, 72, 2384–2393 CrossRef CAS PubMed.
  46. C. F. Fan and T. Caǧin, J. Chem. Phys., 1995, 103, 9053–9061 CrossRef CAS PubMed.
  47. M. N. Szöri, D. J. Tobias and M. Roeselová, J. Chem. Phys. B, 2009, 113, 4161–4169 CrossRef PubMed.
  48. R. Godawat, S. N. Jamadagni and S. Garde, Proc. Natl. Acad. Sci. U. S. A., 2009, 106, 15119–15124 CrossRef CAS PubMed.
  49. Z. W. Dai, J. Ling, X. J. Huang, L. S. Wan and Z. K. Xu, J. Phys. Chem. C, 2011, 115, 10702–10708 CAS.
  50. J. Chai, S. Liu and X. Yang, Appl. Surf. Sci., 2009, 255, 9078–9084 CrossRef CAS PubMed.
  51. F. Salles, H. Jobic, T. Devic, P. L. Llewellyn, C. Serre, G. R. Férey and G. Maurin, ACS Nano, 2009, 4, 143–152 CrossRef PubMed.

Footnote

Electronic supplementary information (ESI) available: The number of water molecules included in each water droplet and the interaction energies between water droplets and –CH3 and –NH2 surfaces. See DOI: 10.1039/c5ra09296e

This journal is © The Royal Society of Chemistry 2015
Click here to see how this site uses Cookies. View our privacy policy here.