Ultra-broadband luminescent from a Bi doped CaO matrix
A.
Yousif
ab,
R. M.
Jafer
ab,
S.
Som
a,
M. M.
Duvenhage
a,
E.
Coetsee
a and
H. C.
Swart
*a
aDepartment of Physics, University of the Free State, P.O. Box 339, Bloemfontein, ZA 9300, South Africa. E-mail: swarthc@ufs.ac.za
bDepartment of Physics, Faculty of Education, University of Khartoum, P.O. Box 321, 11115, Omdurman, Sudan
First published on 15th June 2015
Abstract
CaO:Bi phosphor powders were successfully synthesized by the sol–gel combustion method. Post heat treatment led to the enrichment of the Ca2+ site with multiple Bi centers. These centers were responsible for the change in the ultra-broadband cathodoluminescence (CL) emission as a function of different electron beam currents/beam voltages. The CaO phase formation and the presence of the enrichment of Bi was confirmed by using the X-ray diffraction and X-ray photoelectron spectroscopy techniques. The thermoluminescence afterglow spectra for the samples annealed at 800 °C and 1200 °C were strongly modified for the CaO and the presence of the multiple Bi centers. Of particular interest was that the ultra-broadband CL may have potential applications in inorganic single-emitting components that produce various colours under different beam currents/beam voltages or in a variety of optical devices if it can be better controlled.
Introduction
In recent years, multi-color emission from a single emitting component has been one of the enduring and challenging topics of research.1 However, for the organic light emitting diodes, voltage controlled single-layer structures are the most common approach.1 Unfortunately, not much attention has been focused on the development of inorganic single-emitting components (ISEC) that produce various colors under different beam current/working voltage or excitation wavelengths. The luminescence properties of Bi ion doped materials exhibit extraordinary luminescent properties due to the fact that Bi ions has a large number of valence states, with strong interaction with the surrounding host lattice.2 The diversity in the Bi valence (e.g. +3, +2, +1, 0, −2, etc.)3,4 and species (e.g. Bi24+, Bi95+, Bi3+, Bi24+, etc.),3 in addition to the easy conversion into each other or existence of many Bi valence states in a single component can be used as a candidate for ISEC applications. In all the above mentioned valence states of Bi doped phosphor materials, only Bi3+ is the most stable valence state in most host materials.4To obtain Bi2+ doped phosphors with the combustion synthesis method, Bi3+ usually has to be converted to Bi2+ since Bi(NO3)3 is typically employed as the starting source of bismuth. From the literature Bi3+ can be converted to Bi2+ in any one of the following ways as stated below:5–9
(a) preparation in a reducing atmosphere, e.g. H2 or CO, or
(b) preparation under oxidizing conditions, e.g. air.
The first method is universally employed when an optically active ion of low valence is desired, such as Bi2+, Eu2+, Ce3+ or Mn2+. It is applicable for any kind of host material.5–9 But the second approach is more interesting. This method is only applicable to very specific types of host materials such as some alkaline earth compounds such as SrB4O7:Bi2+, SrB6O10:Bi2+ and MBPO5:Bi2+ (M = Ca, Sr, Ba). In these cases, the reduction mechanism for the Bi3+ was proposed more clearly. Generally, during the incorporation of the Bi ion on the M2+ sites the charge and size mismatches of Bi3+ and M2+ lattice sites create a driving force. This force becomes the main cause for the internal reduction of Bi3+ to Bi2+. Moreover, a stiff three-dimensional network built up by the tetrahedral anion groups in these host lattices which protects the Bi2+ species from subsequent oxygen attack. Similar scenarios have been proposed for the reduction of Eu3+ to Eu2+ by Gao et al. and Peng et al.10–12
An unusual behaviour of Bi during heat treatment has been reported by many researchers. Xu et al.13 reported the reviving behaviour of the Bi-doped MgO–Al2O3–GeO2 glasses, where the reversible reaction of Bi from a higher to a lower and back to a higher oxidation state is possible during heat treatment. The reviving behaviour of the Bi in their case was responsible for the unusual luminescence properties of this component. Sun et al.14 reported the reduction of Bi3+ to Bi+ and substructures (i.e., Bi44+, Bi33+ and Bi22+, Bi24+) in zeolite Y component during the thermal treatment which leads to near-infrared (NIR) emission. Zhou et al.15 reported that an ultra-broadband from blue-green, orange, red to NIR color regions is possible due to the presence of multiple Bi centers (Bi+, Bi2+ and Bi3+) in the nanoporous silica glass. Dianov16 reported that the Bi is an exceptional metal; in no other element the reduction reactions proceed so extensively to produce such a variety of products. With increasing the temperature of the Bi-doped glasses the following change in the valence state of Bi took place: Bi3+ → Bi2+ → Bi+ → Bi, Bi3+ → Bi clusters (Bi2, Bi2−, Bi3etc.) and the (Bi)n metallic colloids. These features of Bi make it notably difficult to determine the valence state of Bi and, therefore, the exact nature of Bi-related emission centers in glasses.16
It is well known from literature that Bi3+and Bi2+ ions emit visible luminescence of a specific colour depended on the host material. CaO exhibits properties that are typical of an insulator, with a wide band gap of 7.03 eV.17,18 The CaO activated by the so-called mercury-like ions, (Bi is one of them), are poorly studied. Herein, the luminescent properties of the Bi doped CaO were studied and this phosphor is proposed to be a candidate for ISEC to generate various colors due to the mentioned multiple Bi centers (Bi+, Bi2+, Bi3+) or Bi species during heat treatment.
In this work, the CaO:Bi phosphor powder was synthesized by the sol–gel combustion method. Ultra-broadband emissions due to multiple Bi centers as a function of different beam current/working voltages have been reported. Change in the CaO:Bi surface structure and the trap position as a result of heat treatment are presented. X-ray photoelectron spectroscopy (XPS) and time-of-flight secondary ion mass spectroscopy (TOF-SIMS) results are also reported to support the observed change in the CaO:Bi surface structure. These findings represent an important contribution to the understanding of the spectral behavior of Bi in the CaO matrix and it is good for developing novel ISEC materials.
Experiment
Calcium nitrate (Ca (NO3)2·4H2O, 99.997% pure) and bismuth nitrate (Bi(NO3)3·5H2O, 99.999% pure) were used to synthesize a compound with a general formula CaO:Bi. Hydrated citric acid (C6H8O7·H2O, analytical grade) was used as a chelating agent. The molar ratio of the nitrate to citrate was 1![[thin space (1/6-em)]](https://www.rsc.org/images/entities/char_2009.gif) :
:![[thin space (1/6-em)]](https://www.rsc.org/images/entities/char_2009.gif) 2. The Bi(NO3)3·5H2O was dissolved separately in deionized water, mixed with HNO3 and then introduced drop wise to the other solutions of the nitrates. Thereafter, the mixed solution was in an open bath maintained at 80 °C with continuously stirring using a magnetic agitator for 5 hours until the solution turned into a transparent sticky gel. The gel was dried by direct heating on a hot plate maintained at 180 °C for 2 hours. The resulting product was a light grey CaO:Bi powder. The powder was then annealed in air at 800 °C and 1200 °C for 2 hours.
2. The Bi(NO3)3·5H2O was dissolved separately in deionized water, mixed with HNO3 and then introduced drop wise to the other solutions of the nitrates. Thereafter, the mixed solution was in an open bath maintained at 80 °C with continuously stirring using a magnetic agitator for 5 hours until the solution turned into a transparent sticky gel. The gel was dried by direct heating on a hot plate maintained at 180 °C for 2 hours. The resulting product was a light grey CaO:Bi powder. The powder was then annealed in air at 800 °C and 1200 °C for 2 hours.
The phase composition was characterized by X-ray diffraction (XRD) measurements using a BrukerD8 advance diffractometer (40 kV, 40 mA) with CuKα x-rays (1.54 Å). The scanning electron microscopy (SEM) of the powder was performed using a JSM-7800F microscope. TOF-SIMS measurements were performed on an ion of TOF SIMS. A pulsed 30 keV Bi+ primary ion beam, operated at a DC current of 30 nA, with a pulse repetition frequency of 10 kHz (100 μs), was used to acquire chemical images of the phosphor in the positive secondary ion polarities. Moreover, the O− with 1 kV and a DC current of 250 nA was used as sputter gun. The analytical field-of-view was 100 × 100 μm2 with a 256 × 256 pixel2 digital raster. The cathodoluminescence (CL) data were collected using an Ocean Optics PC2000 spectrometer attached to the vacuum chamber of the PHI 545 Auger electron spectrometer and the data were recorded using OOI Base32 computer software. For collecting the CL spectra, the phosphor was subjected to an electron beam with a current density of 39.2 mA cm−2, with a different working beam voltage and a beam current at a base pressure of 2.6 × 10⁻⁸ Torr. Photoluminescence (PL) was done with a Cary Eclipse equipped with a 150 W Xenon lamp. Thermoluminescence (TL) data were collected with a TL 10091, NUCLEONLX spectrometer and the data were fitted with a TL Glue Curve Analyzer. XPS technique was used to detect the XPS high resolution spectra of the Bi on and below the initial surface of annealed sample at 1200 °C. The measurement was performed using a PHI 5000 Versaprobe-Scanning ESCA Microprobe. A 100 μm diameter monochromatic Al Kα X-ray beam (hν = 1486.6 eV) generated by a 25 W, 15 kV electron beam setup was used to obtained the spectra. The pass energy of the hemispherical analyzer was maintained at 11 eV. The powder surfaces were sputtered using an Ar ion gun (2 kV energy ions) at the rate of 20 nm min−1.
Results and discussion
Morphology and structural analysis
Fig. 1(a) and (b) clearly shows the effect of heat treatment at 800 °C and 1200 °C on the particle's shape and morphology respectively. The surface of the CaO:Bi3+ sample annealed at 800 °C shows that the particles were more compact and rougher with irregular pores, while a large agglomeration of particles with irregular shapes was observed for the CaO:Bi3+ sample that was annealed at 1200 °C.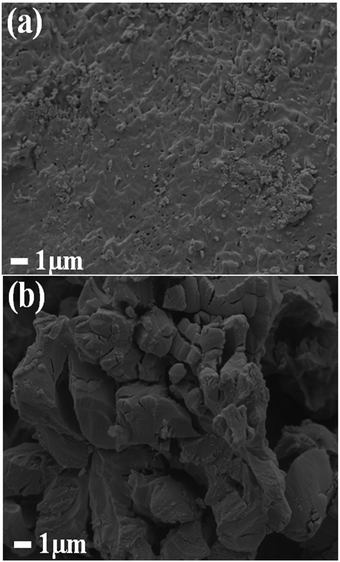 | ||
| Fig. 1 (a and b) the SEM micrographs for the CaO:Bi powder samples that were annealed at 800 °C and 1200 °C respectively. | ||
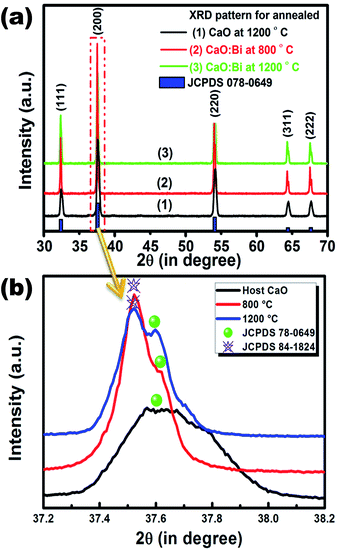
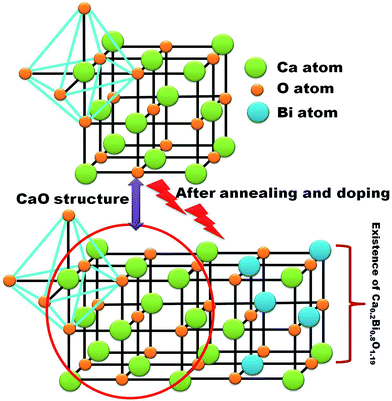
Fig. 2(a) shows the XRD pattern of the CaO powder as a host and when doped with Bi and annealed at 800 °C and 1200 °C, respectively. Undoped CaO powder annealed at 1200 °C shows a sharp and single XRD pattern which correspondents well with the JCPDS 078-0649 standard file. It indicates the presence of a FCC cubic phase. The unit-cell parameter was determined using the Program Unit Cell software19 and was obtained as 4.805 Å. When the Bi ions were doped in the host CaO structure and annealed at 800 °C a new peak corresponding to the Ca0.2Bi0.8O1.19 structure (JCPDS 84-1824) was observed as clearly shown in the enlargement of the 200 peak in Fig. 2(b). With the increase in annealing temperature to 1200 °C both peaks corresponding to the CaO phase and Ca0.2Bi0.8O1.19 phase were visible. The unit-cell parameters corresponding to these patterns were determined as 4.287 and 4.248 Å. The volume of the unit cell was found to decrease with annealing. This decrease reflects the increasing amount of excess Bi clathrated into the lattice. It indicates that post heat treatment lead to the enrichment of Ca2+ sites with multiple Bi centres. This phenomenon is schematically depicted in Fig. 3. When Bi3+ is introduced into the CaO host lattice (Fig. 3(a)), depending on the ionic radius and charges, the replacement with Bi3+ on the Ca2+ sites takes place. This substitution leads to the formation of a  defects. When the sample is annealed in air, the ambient oxygen can penetrate into the permeable crystal structure. It can form an interstitial oxygen
  defect in the vicinity of the
  (Fig. 3(b)). Similarly, a slight fluctuations in the calcium distribution may create a calcium vacancy
  (Fig. 3(c)). The
  or
or  are negatively charged defects. So the presence of these defects compensates the charge inside the host and in this way stabilizes the positively charged defects of
  . The above discussion indicates that by removing those stabilizing site the destabilization of
  species is possible which can help to create interstitial Bi sites,
  in the Bi doped CaO. It can create then BiO cluster in the interstitial position via the conjugation of
  and
and  . It destabilizes the structure and helps in the formation of the Ca0.2Bi0.8O1.19 impurity phase. A model for the developed CaO phase with Bi clathrated into the lattice as the result of heat treatment applied is presented in Fig. 4.
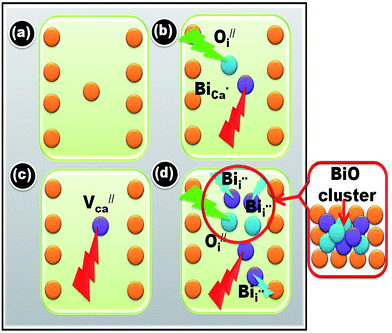 | ||
| Fig. 3 Schematic representation of stabilization and destabilization of the CaO after Bi doping and the formation of BiO clusters and impurity phases. | ||
TOF-SIMS analysis
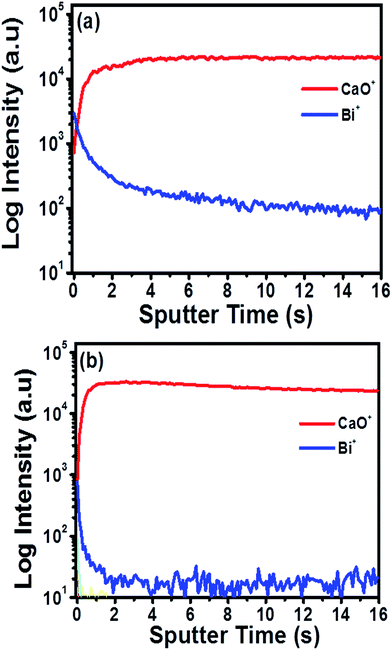
Logarithmic intensity of the positive mode molecular ion depth profiles for the CaO:Bi3+ annealed at 800 °C and 1200 °C are presented in Fig. 5(a) and (b) respectively. In both depth profiles, the CaO+ ions (in red) are stable inside the bulk of the particle, while the Bi+ ions (in blue) depth profile exhibited a different behaviour. For the sample that was annealed at 800 °C, the Bi+ ion's intensity exhibits a maximum at the surface (0–2 s of etching) and then gradually decreased with depth until it reached a stable value in the bulk of the CaO:Bi3+ particle. The Bi+ ion's intensity in the sample that was annealed at 1200 °C, was still a maximum at the surface (0–2 s of etching), but then exhibits a much sharper decrease in intensity in the bulk of the CaO:Bi3+ particle indicating a depletion of Bi in the bulk material. These results suggest the segregation of the Bi+ ions from the bulk of the CaO:Bi3+ particle to the surface in the case of the sample that was annealed at 1200 °C. The volatility of Bi makes the migrations to the surface possible during the post annealing process and either segregate or evaporates after migration.20Cathodoluminescence properties
The CL emission intensity as function of wavelength of the CaO:Bi 800 °C and 1200 °C annealed samples have been investigated as a function of different beam currents and beam (working) voltages, as shown in Fig. 6(a)–(f). (Note: Auger spectra of the surface (not shown) indicated that no shifts in the energy positions of the Auger peaks occurred, which indicated that the conductivity of the phosphors were high enough to handle these high current densities and voltages.) Some digital luminescence images are also presented in Fig. 6(g) for the 1200 °C annealed samples, which representing the change in the luminescence colour with changing in the beam voltage. There are two things to be mentioned about the CL investigations. Firstly, as a comparison with the photoluminescence data of the same samples, partially shown in Fig. 7, the CL spectra for the annealed sample at 800 °C (Fig. 6(a) and (b)) have slight differences, namely a shoulder and small peak around 500 nm and 775 nm respectively. For this sample, the effect of different working voltages and beam currents on the luminescence only show an increase or decrease in the CL intensity which are represented as insets in Fig. 6(a) and (b) respectively. Secondly, for the sample annealed at 1200 °C, a new broad emission peak ranging from 500 nm up to 1000 nm appears when the beam current/beam voltage was increased. The CL spectra and intensity as a function of different beam voltages and beam currents are represented in Fig. 6(c)–(f) respectively. The difference between the PL and CL can be explained by the difference between their mechanisms. During PL measurements, the luminescent materials were excited by photons (UV or visible light) with energy of only 4–6 eV.1 However, in the CL measurements, the energy of the accelerated electrons could be regulated from 1 to 3 keV under the different working voltage or beam current. So, the excitation energy on each phosphor's particle was much larger in CL than those in PL.1 The photons usually excite the dopant ions directly, but with the increase in the working voltage and the beam current, the host lattice would also be excited.1 After penetrating into the host lattice of a luminescent material, the fast primary electrons would give rise to ionization and would create many secondary electrons in the process.1 These secondary electrons would excite the host lattice and would create several electron–hole pairs. As mentioned in the structure analysis, a new phase of CaO develops during the annealing process. In this phase, the BiO clusters were proposed to be part of the lattice structure due to the segregation of Bi ions from the bulk to populate the phosphor's surfaces as a result of the increased temperature. The segregation phenomena of Bi have been investigated by many researchers.21–26 Therefore, as the annealed samples were irradiated with electrons, the BiO(Bi2+) gave its own luminescence the orange colour beside the luminescence from Bi3+ (the blue colour). The blue and orange emissions were reported by many authors as a characteristic emission from Bi3+ and Bi2+ respectively.8,27 It has been reported in literature, the luminescent species of Bi3+ has the 6s2 electron configuration with 1S0 as the ground state, and 6s26p2 as the excited state which gives rise to the triplet levels [3P0, 3P1, 3P2] and the 1P1 singlet state. The 3P0 → 1S0 is strongly forbidden but has been reported by many authors28 as a dominate emission at low temperature measurements. As temperature increased the emission originated from the spin–orbit coupling allowed 3P1 → 1S0 transition by overcoming the energy barrier (ΔE) as is shown in Fig. 6(h).28 The 3P2 → 1S0 is forbidden by parity but can be induced by coupling with unsymmetrical lattice vibration modes. The electronic configuration of Bi2+ is [Xe]4f145d106s2p1 with the ground state 2P1/2 and first excited state 2P3/2 which were derived from 6s26p1. By crystal field splitting, 2P3/2 can be separated into 2P3/2 (1) and 2P3/2 (2). At higher energy, excitation to 1S1/2 may occur (6s27s1 configuration). The emission of Bi2+ occurs via2P3/2 (1) → 2P1/2.29 In conclusion, the CL results that was observed from Bi3+ and Bi2+ that was observed from the CaO:Bi annealed sample at 1200 °C might be due to the presence of both Bi3+ and Bi2+ in the structure. The mechanism of these species are summarised in the energy level diagrams presented in Fig. 6(h).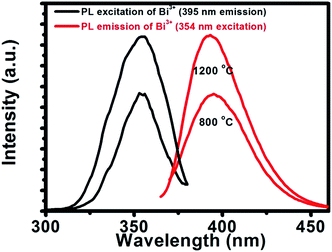 | ||
| Fig. 7 The PL excitation and emission intensities versus wavelength for the 800 °C and 1200 °C annealed CaO:Bi samples. | ||
The calculated CIE chromaticity coordinates are presented in Fig. 6(i), which show the change from violet (with CIE coordinates X = 0.18 and Y = 0.14) to the orange colour (with CIE coordinates X = 0.48 and Y = 0.37). It can be proposed that, the CaO:Bi sample annealed at 1200 °C can show multi-coloured emissions (violet and orange) by changing either the working voltage or the beam current.
PL analysis
The excitation and emission spectra, Fig. 7, obtained by using the xenon lamp, were recorded when monitoring the 395 nm emission with the 354 nm excitation and vice versa. The observed excitation and emission can be attributed to the 1S0 → 3P1 and 3P1 → 1S0 transitions, respectively.XPS analysis
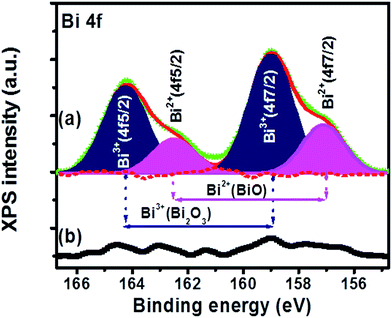
In order to assess the presence of the Bi in the surface layer for the sample annealed at 1200 °C, XPS measurements were carried out on the sample's surface as well as after removed of a layer of about 200 nm from the sample's surface which are represented in Fig. 8(a) and (b) respectively. The Bi 4f XPS spectra exhibit two peaks with two shoulders which suggest that the Bi was in doublet oxidation states. The main two peaks appear centred at 164.3 eV and 158.9 eV which can be deconvoluted with two peaks (the blue areas). These peaks are corresponding to the Bi 4f5/2 and Bi 4f7/2 binding energies of Bi3+ in Bi2O3.30 The shoulders centred at 162.7 eV and 157.1 eV were also deconvoluted with two peaks (the pink areas). These peaks were ascribed to the Bi 4f5/2 and Bi 4f7/2 binding energies of Bi2+ in BiO.30 The recorded XPS spectra after 200 nm removed from the CaO:Bi phosphor surface is presented in Fig. 8(b). The recorded XPS spectrum showed the Bi depletion and almost no Bi can be seen from the XPS peaks. These results are clear evidence to the presence of the Bi with two different valence states, Bi3+ and Bi2+. Additionally, the XPS could be used as prove of the presence of the multiple Bi valence in the top layer of the sample's surface.TL analysis
To get an idea about the effect of traps/defects inside the material that correlates to the CL properties, the TL properties of the doped sample annealed at 800 °C and 1200 °C were recorded, which are presented in Fig. 9(a) and (b) respectively. The TL glow curves were obtained in the linear heating range with an acquisition from 27 °C to 365 °C at a heating rate of 2 °C s−1, after the samples were exposed to UV radiation (260 nm) for 10 min. For the sample annealed at 800 °C, the TL glow curve shows two peaks, one below 200 °C and another ∼350 °C. A significant decrease in the temperature of the glow peak was observed for the sample annealed at 1200 °C. This may be due to rearrangement of the existing traps to a lower trap depth and at the same time creation of new traps for charge trapping. To characterize the trap position the TL glow curves were deconvoluted using the glow curve deconvolution functions (GCD) for general order kinetics glow curves suggested by Kitis et al. as is shown in eqn (1)31 | (1) |
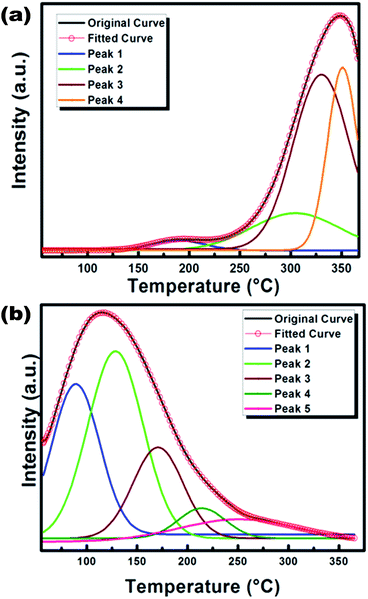 | ||
| Fig. 9 The deconvoluted TL glow curves for CaO:Bi phosphor annealed (a) at 800 °C and (b) at 1200 °C. | ||
The theoretical peaks were generated and a glow curve was obtained by their convolution. The theoretically generated glow curves were fitted with the experimental glow curves and the quality of fitting was checked by calculating the figure of merit (FOM)32 for each fitting defined by eqn (2)
 | (2) |
Here TLexp and TLthe represent the TL intensity of experimental and theoretical glow curves respectively. The summation extends over all the available experimental data points. Quality of fitting and choice of appropriate number of peaks was refined by repeating the process of fitting in order to get the minimum figure of merit (FOM) with minimum number of possible peaks. The fits were considered adequate when the FOM values were observed below 2%. For 800 °C annealed sample, four deconvoluted peaks were obtained whilst for 1200 °C synthesized sample five deconvoluted peaks were obtained. Chen formalism has been used to calculate kinetic parameters like order of kinetics (b) and trap depth (E) for each of the deconvoluted peak. The nature of kinetics for the whereas for glow peaks in UV irradiated phosphor was calculated by a symmetry factor (μg) given by eqn (3)
| μg = δ/ω = (T2 − Tm)/(T2 − T1) | (3) |
Here Tm is the peak temperature, T1 and T2 are the temperatures on either side of Tm corresponding to half peak intensity. Theoretically the value of μg, ranges between 0.42 and 0.52, the value 0.42 is for first order kinetics and value 0.52 is for second order. In the present case all the values are ∼0.52 and this indicates the presence of second order kinetics nature of all the traps. The activation energy for each of the deconvoluted peak was estimated using eqn (4)
 | (4) |
The values of the trapping parameters for the deconvoluted peaks are summarized in the energy level diagram (Fig. 10). In the energy level diagram the Bi3+ emission is also depicted. It can be seen that the energy levels of Bi3+ and Bi2+ are far below that of the existing traps and although these traps can still feed electrons to the excitation states of the Bi ions no obvious contribution to the changes as seen in the CL spectra is expected.
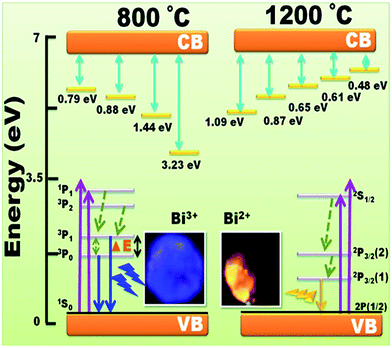 | ||
| Fig. 10 The energy level diagrams for the thermoluminescence phenomena showing the change in the trap's position of annealed CaO:Bi (a) at 800 °C and (b) at 1200 °C. | ||
Conclusions
In summary, the CaO:Bi3+ phosphor powder was successfully prepared by the sol–gel combustion method. The XRD and ToF SIMS results suggest that with the increase in annealing temperature the segregation of Bi+ ions from the bulk of the CaO:Bi3+ particle to the surface occurred. The volatility of Bi makes the migrations to the surface, possible during the post annealing process and either segregated or evaporated after migration. The ultra-broadband CL emission as a function of different beam current/beam voltages was attributed to the presence of multiple Bi centres. These multiple centres occupied the Ca2+ site that developed as result of annealing. It is concluded that the emission is purely from the Bi3+/Bi2+ levels. Thus the ultra-broadband CL emission may have potential applications in inorganic single-emitting components that produce various colours under different beam current/working voltages in a variety of optical devices.Acknowledgements
This work is based on the research supported by the South African Research Chairs Initiative of the Department of Science and Technology, Republic of South Africa and the National Research Foundation of South Africa.References
- G. S. R. Raju, E. Pavitra, Y. H. Ko and J. S. Yu, J. Mater. Chem., 2012, 22, 15562 RSC.
- A. Yousif, V. Kumar, H. A. A. Seed Ahmed, S. Som, L. L. Noto, O. M. Ntwaeaborwa and H. C. Swart, ECS J. Solid State Sci. Technol., 2014, 3(11), R222 CrossRef CAS.
- F. Kang and M. Peng, Dalton Trans., 2014, 43, 277 RSC.
- A. B. Gawande, R. P. Sonekar and S. K. Omanwar, Int. J. Opt., 2014, 2014, 6 Search PubMed.
- M. Peng, J. Li, L. Wondraczek, Q. Zhang and J. Qiu, J. Mater. Chem. C, 2013, 1, 5303 RSC.
- M. Peng and L. Wondraczek, Opt. Lett., 2010, 35, 2544 CrossRef CAS PubMed.
- M. Peng, N. Da, S. Krolikowski, A. Stiegelschmitt and L. Wondraczek, Opt. Express, 2009, 17, 21169 CrossRef CAS PubMed.
- C. M. Zhang, J. Yang, C. K. Lin, C. X. Li and J. Lin, J. Solid State Chem., 2009, 182, 1673 CrossRef CAS.
- P. A. Tanner, Z. W. Pei, J. Lin, Y. L. Liu and Q. Su, J. Phys. Chem. Solids, 1997, 58, 1143 CrossRef CAS.
- G. J. Gao, S. Reibstein, M. Y. Peng and L. Wondraczek, J. Mater. Chem., 2011, 21, 3156 RSC.
- M. Y. Peng, Z. W. Pei, G. Y. Hong and Q. Su, Chem. Phys. Lett., 2003, 371, 1 CrossRef CAS.
- M. Y. Peng, Z. W. Pei, G. Y. Hong and Q. Su, J. Mater. Chem., 2003, 13, 1202 RSC.
- B. Xu, S. Zhou, M. Guan, D. Tan, Y. Teng, J. Zhou, Z. Ma, Z. Hong and J. Qiu, Opt. Express, 2011, 19(23), 23436 CrossRef CAS PubMed.
- H. Sun, Y. Sakka, N. Shirahata, Y. Matsushita, K. Deguchi and T. Shimizu, J. Phys. Chem. C, 2013, 117, 6399 CAS.
- S. Zhou, N. Jiang, B. Zhu, H. Yang, S. Ye, G. Lakshminarayana, J. Hao and J. Qiu, Adv. Funct. Mater., 2008, 18, 1407 CrossRef CAS.
- E. M. Dianov, J. Lightwave Technol., 2013, 31(4), 681 CrossRef.
- M. A. Bolorizadeh, V. A. Sashin, A. S. Kheifets and M. J. Ford, J. Electron Spectrosc. Relat. Phenom., 2004, 141, 27 CrossRef CAS.
- R. C. Whited and W. C. Walker, Phys. Rev. Lett., 1969, 22, 1428 CrossRef CAS.
- T. J. B. Holland and S. A. T. Redfern, Unit cell refinement from powder diffraction data: the use of regression diagnostics, Department of Earth Sciences, Cambridge, U.K., 1995 Search PubMed.
- L. Chen, E. Alarcón-Lladó, M. Hettick, I. D. Sharp, Y. J. Lin, A. Javey and J. W. Ager, J. Phys. Chem. C, 2013, 117, 21635 CAS.
- T. K. Song, S. E. Park, J. A. Cho and M. H. Kim, J. Korean Phys. Soc., 2003, 42, S1343 CAS.
- Y. Zorenko, V. Gorbenko, T. Voznyak, V. Vistovsky, S. Nedilko and M. Nikl, Radiat. Meas., 2007, 42, 882 CrossRef CAS.
- X. Dong, C. Xiao-nong, Y. Xue-hua, X. Hong-xing and S. Li-yi, Trans. Nonferrous Met. Soc. China, 2009, 19, 1526 CrossRef.
- X. Wu, Y. Liang, R. Chen, M. Liu and Y. Li, J. Mater. Sci., 2011, 46, 5581 CrossRef CAS.
- M. Ilmer, B. C. Grabmaier and G. Blasse, Chem. Mater., 1994, 6, 204 CrossRef CAS.
- X. J. Zheng, W. M. Yi, Y. Q. Chen, Q. Y. Wu and L. He, Scr. Mater., 2007, 57, 675 CrossRef CAS.
- R. Cao, F. Zhang, C. Liao and J. Qiu, Opt. Express, 2013, 21, 15728 CrossRef CAS PubMed.
- P. W. M. Jacobs, J. Phys. Chem. Solids, 1991, 52, 35 CrossRef CAS.
- M. Peng and L. Wondraczek, J. Am. Ceram. Soc., 2010, 93, 1437 CAS.
- M. Vila, C. Guerra, K. Lorenz, J. Piqueras, E. Alves, S. Nappinic and E. Magnanoc, J. Mater. Chem. C, 2013, 1, 7920 RSC.
- G. Kitis, J. M. Gomez-Ros and J. W. N. Tuyn, J. Phys. D: Appl. Phys., 1998, 31, 2636 CrossRef CAS.
- K. S. Chung, H. S. Choe, J. I. Lee, J. L. Kim and S. Y. Chang, Radiat. Prot. Dosim., 2005, 115, 345 CrossRef PubMed.
| This journal is © The Royal Society of Chemistry 2015 |

