Suppression of photocatalysis and long-lasting luminescence in ZnGa2O4 by Cr3+ doping
Lei Li,
Yin-hai Wang*,
Hong Li,
Hai-ju Huang and
Hui Zhao
Guangdong University of Technology, China. E-mail: yhwang@gdut.edu.cn
First published on 16th June 2015
Abstract
ZnGa2O4 powder, synthesized by the solid state method, exhibited efficient photocatalytic activity for rhodamine B (RhB) degradation under mercury lamp illumination. However, the photocatalytic activity of ZnGa2O4 was highly suppressed when doped with Cr3+ ions. We discussed the mechanism of photocatalysis based on the photoluminescence properties of ZnGa2O4 and ZnGa2O4:Cr3+, and the blue fluorescence lifetimes of host ZnGa2O4 powders with different Cr3+ concentrations were also measured. The results indicated that the doped Cr3+ ions act as recombination centers that can highly reduce the amount and lifetime of the electron–hole pairs, thus reducing the photocatalytic activity of ZnGa2O4. The thermoluminescence (TL) curves of ZnGa2O4 and ZnGa2O4:Cr3+ showed that the amount of trapped electrons/holes in ZnGa2O4 is almost seven times higher than that of ZnGa2O4:Cr3+. The suppressed long-lasting luminescence intensity and photocatalytic activity of ZnGa2O4:Cr3+ were supposed to have come from the decrease of trapped electrons/holes and shortened lifetimes of electron–hole pairs. Possible mechanisms for long-lasting luminescence and photocatalysis of ZnGa2O4 coupled with photoluminescence mechanisms of ZnGa2O4:Cr3+ were also proposed.
Introduction
Long-lasting luminescence is an optical phenomenon whereby luminescence can remain visible for a long time (seconds to hours) after the excitation has stopped.1–3 These materials have long been of great interest and are drawing more and more attention in recent years due to the great potential for applications in many fields such as emergency signage, traffic signs and in vivo bio-imaging.4As a type of wide band gap (4.5 eV) semiconductor, ZnGa2O4 phosphor has attracted enormous attentions due to its many possible applications for field emission displays and electroluminescent devices due to its chemically and mechanically stable structure, which may be sustained under harsh environments.5,6 ZnGa2O4 phosphor has a cubic normal AB2O4 spinel crystal structure with an Fd3m space group7 in which Zn2+ ions, surrounded by 4 oxygen atoms, occupy the tetrahedral A sites and Ga3+ ions, surrounded by 6 oxygen atoms, occupy the octahedral B sites. With this spinel structure, ZnGa2O4 can be described in terms of a close packed cubic arrangement of 32 oxygen anions. There are 64 tetrahedral sites and 32 octahedral sites in which only a half of the octahedral gaps and one-eighth of the tetrahedral gaps are filled with cations.8 Thus, ZnGa2O4 is an ideal host lattice for doping with transition metals or rare earth elements to form luminescence centers. ZnGa2O4 shows blue emission attributed to self-activated centers when undoped,9,10 intense green emission when doped with Mn2+ and near-infrared (NIR) luminescence when doped with Cr3+.11,12
Recently, ZnGa2O4 is also reported to exhibit excellent performance in water splitting13 and air purification14,15 due to its high photocatalytic activity. The highly dispersed LUMO (bottom of conduction band), composed of hybridized orbitals of Ga 4s4p and Zn 4s4p atomic orbitals16,17 is considered to promote the mobility of photo-generated electrons and benefit the high photocatalytic activity of ZnGa2O4.18 In the work of Sun et al.,19 ZnGa2O4 synthesized by a rapid microwave hydrothermal method exhibits efficient photocatalytic activities, which are even better than those of commercial TiO2 P25. Nowadays, inspired by the methods to improve the photocatalytic activities of TiO2, many approaches have been proposed to improve the photocatalytic activity of ZnGa2O4 (controlling morphology, calcining temperature, pH value, trace element doping, chemical ratio).18 In the literature about photocatalysis of TiO2, Cr3+ ions doping has attracted interest in the study of visible light-induced photocatalytic activities due to its extension of the spectral response in the visible range. Although there are many articles about Cr3+ ions doped into TiO2 (ref. 25–27) and even though Cr3+ doped ZnGa2O4 can increase the disorder of the spinel structure of ZnGa2O4 and thus induce more defects that may be favorable for photocatalytic activity, the photocatalytic activity of ZnGa2O4:Cr3+ has never been discussed.
Herein, ZnGa2O4 host and Cr3+ doped ZnGa2O4 samples are prepared by the traditional high temperature solid state method. Photocatalytic activity tests show that the photo-degradation efficiency of ZnGa2O4 is highly suppressed via doping with Cr3+, which is unexpected, and thus this triggered us to discuss the mechanism of the photocatalysis of ZnGa2O4:Cr3+ in detail. It is generally considered that peroxide (˙O2−) and hydroxyl (˙OH) radicals, which are generated by the reaction of photo-generated electrons with O2 and H2O, are highly responsible for the photocatalytic degradation of pollutants and can oxidize organic pollutants into CO2 and H2O.22 Thus, the photo-generated electrons play important roles in photocatalysis and the amount and lifetime of photo-generated electrons can highly influence the activity of a photocatalyst. It is known that the photo-generated electrons and holes recombine quickly at recombination centers after the stoppage of excitation. The recombination rate could be decreased by the presence of ions that can act as electron or hole traps and maintain the photo-generated electrons/holes for a longer period, thus favoring the increase in photocatalytic activity. On the other hand, the recombination rate could be increased by the presence of ions that act as recombination centers such as defects or multiphases,28 which can reduce the amount and lifetime of electron–hole pairs. Therefore, the relative efficiency of a metal ion dopant depends on whether it serves as a mediator of interfacial charge transfer or as a recombination center.29 It is well known that photoluminescence results from the recombination of photo-generated electrons and holes, and the recombination rate determines the luminescence intensity. Therefore, there is a competitive mechanism between luminescence intensity and photocatalytic activity. That is to say, the lower the recombination rate of photo-generated electrons and holes, the lower the photoluminescence intensity and the higher the photocatalytic activity. The suppression of photocatalytic activity in ZnGa2O4 by Cr3+ doping can be investigated based on the luminescence properties of ZnGa2O4:Cr3+. It is promising to discuss the photocatalytic activity accompanied with luminescence properties, and a promising approach via controlling the luminescence properties can be proposed to develop the photocatalytic activity of photocatalysts.
Experimental
Materials
Chemical reagents ZnO (99%), Ga2O3 (99.99%), and Cr2O3 (99%) were used as starting materials. Chromium was nominally doped with 0.1%, 0.3%, 0.5%, 0.7%, 1.0% and 1.5% mol relative to gallium. The appropriate amount of starting materials with different stoichiometric ratios were mixed and carefully ground in an agate mortar for about 1 h to ensure homogeneity, and then the mixed powders were placed into a corundum crucible and calcined at 1300 °C for 4 h in an air atmosphere. When the samples cooled to room temperature, they were reground in the agate mortar.Characterization
The crystal structure of the powder phosphors were analyzed using an X-ray diffractometer at room temperature using Cu Kα (λ = 1.5418 Å) irradiation operating at 36 kV and 20 mA. Data were collected between 10° and 70° (2θ) at room temperature with a step size of 0.02°. The surface morphologies were observed using a scanning electron microscopy (SEM, S-3400N-II, Japan). The particle sizes of the powder phosphors were measured by a Laser Particle Size Analyzer (JL-1197). The excitation and emission spectra, long-lasting luminescence decay curves and fluorescence decay curves were obtained at room temperature using a Hitachi F-7000 fluorescence spectrophotometer. An FJ27A1 TL dosimeter was used to measure TL curves at a heating rate of 1 °C s−1 after the samples were exposed to radiation from a UV lamp for 5 min and placed in a dark room for 3 min.Photocatalytic activity test
Photocatalytic activities were characterized by the photo-degradation of RhB. A 500 W mercury lamp with a 5 A operating current was used as the light source. The mercury lamp was positioned in a cylindrical Pyrex vessel and cooled by circulating water to control the reaction temperature at about 27 °C during irradiation. The as-prepared ZnGa2O4 and ZnGa2O4:Cr3+ particles (0.01 g) were first dispersed in two glass tubes with 40 ml RhB solution (4 × 10⁻⁵ mol l−1), and another glass tube containing only 40 ml RhB solution was used as the blank. Then, the suspensions were stirred in the dark for 30 min to achieve an adsorption/desorption equilibrium between the photocatalyst and RhB solution, during which vigorous magnetic stirring was maintained to keep ZnGa2O4 and ZnGa2O4:Cr3+ particles suspended in the RhB solution. Then, 5 ml of the suspensions was added into centrifuge tubes and centrifuged for 3 min at 3000 rpm to eliminate the solid particles. The clear supernatants were used to measure the changes in the RhB concentration (the solid particles and clear supernatant were poured back into respective glass tubes to ensure there is always a comparable amount ZnGa2O4 and ZnGa2O4:Cr3+ in the RhB solution). The concentration of RhB was monitored at the maximum absorbance wavelength of 553 nm. The percentage of degradation was recorded as C/C0, where C is the absorbance of RhB solution at certain irradiated time intervals (10 min) and C0 is the absorbance of the initial RhB solution. The blank solution was also tested under same experimental conditions for comparison.Results and discussion
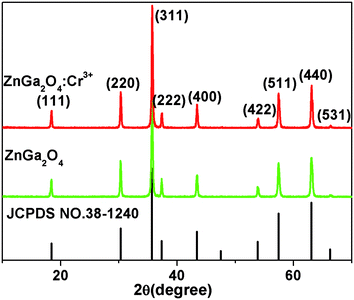
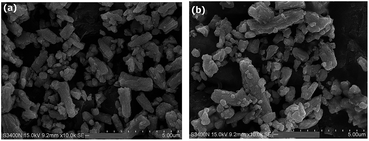
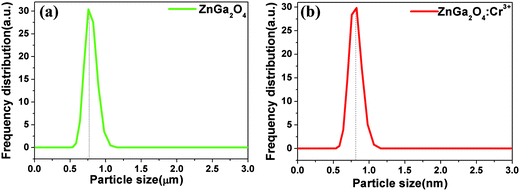
Fig. 1 shows the X-ray diffraction (XRD) patterns of ZnGa2O4 and ZnGa2O4:Cr3+ calcined at 1300 °C for 4 h. All the peaks are assigned to the ZnGa2O4 spinel phase (JCPDS no. 38-1240) and no characteristic peaks for the dopants have been observed. Nine distinctive peaks match well with the (111), (220), (311), (222), (400), (422), (511), (440), and (531) crystal planes of ZnGa2O4, respectively. This result indicates that the pure spinel phase of ZnGa2O4 was formed in the investigated samples. Therefore, the doping of 0.5% mol transition metal chromium relative to gallium has no significant influence on the crystal structure of ZnGa2O4. The morphologies of the as-synthesized ZnGa2O4 and ZnGa2O4:Cr3+ are demonstrated by the SEM images (shown in Fig. 2). As shown in Fig. 2, the as-prepared ZnGa2O4 and ZnGa2O4:Cr3+ samples show same irregular shapes. Particles are partly agglomerated, and the particles of ZnGa2O4:Cr3+ are agglomerated more significantly. The actual particle sizes of ZnGa2O4 and ZnGa2O4:Cr3+ are about 0.75 μm and 0.70 μm, respectively. Fig. 3 shows the distribution of particle sizes in powder phosphors. As shown in Fig. 3, the average particle sizes of ZnGa2O4 and ZnGa2O4:Cr3+ are about 0.78 μm and 0.80 μm, respectively. These results are consistent with the actual particle sizes and agglomeration shown in Fig. 2. The results relating to crystal structure, morphology, particle size and size distribution indicated that ZnGa2O4 and ZnGa2O4:Cr3+ possess almost the same surface areas, and the same amount of ZnGa2O4 and ZnGa2O4:Cr3+ powders are comparable in the photocatalytic reaction.The photo-degradation of RhB was measured as a function of irradiation time, as shown in Fig. 4. The degradation rate of RhB under irradiation was very slow when no photocatalyst was added (blank in Fig. 4). Moreover, the photocatalytic activity of ZnGa2O4:Cr3+ can be ignored. On the contrary, RhB concentration underwent an obvious decline after 110 min irradiation in the presence of ZnGa2O4 with 60% RhB degradation.
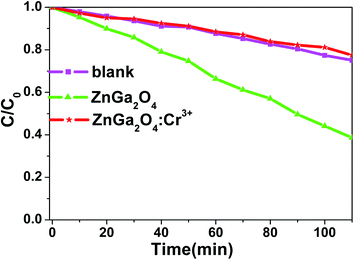 | ||
| Fig. 4 Photocatalytic activity of ZnGa2O4 and ZnGa2O4:Cr3+ for the degradation of RhB under mercury lamp; the percentage of degradation was recorded at intervals of 10 min. | ||
An appropriate electronic structure is essential for the photocatalytic activity. Recently, Sun et al.19 reported that the band-edge positions of the conduction and valence bands (ECB and EVB, respectively) can be calculated by the following empirical equations:30
| ECB = −χ + 1/2Eg | (1) |
| EVB = −χ − 1/2Eg | (2) |
Fig. 5 shows the emission spectra of ZnGa2O4 and ZnGa2O4:Cr3+ at room temperature under excitation with 254 nm wavelength light. The self-activated photoluminescence of the ZnGa2O4 host exhibited a broad-band emission peaking at 340 nm, a narrow-band emission with the maximum emission at 505 nm, and a weak band emission peaking at 680 nm. The emission band at 505 nm (2EA–4A2) appears likely due to the electron and hole recombination between the native defects (oxygen defect, zinc defect, and gallium–oxygen vacancy pair).35–37 The emission band at 340 nm is similar to the band at 360 nm reported by Kim et al.,38,39 which is the blue-shift behavior of the emission band from 430 nm to 340 nm. The blue-shift behavior results from the oxygen vacancy ( ) defects, which distort the symmetry of the Oh site, leading to the shift of Ga–O transition emission of regular octahedral sites at 430 nm to 340 nm (Ga–O transition emission of distorted octahedral sites).40,41 Moreover, 698 nm emission accompanying the 340 nm emission is identified as the transition from the
  state to the O2− state.39 In contrast, ZnGa2O4:Cr3+ gave an intense NIR emission band at 698 nm due to the 2E–4A2 transition of distorted Cr3+ ions in ZnGa2O4.42 The host emission at 505 nm is highly suppressed after doping Cr3+ into ZnGa2O4 due to an effective non-radiative energy transfer between the host emission and the absorption of Cr3+ (4A2–4T1 (te2), 4A2–4T1 (t2e) and 4A2–4T2 transitions), resulting from their large spectral overlap.42 The result is similar to the energy transfer between the blue emission of ZnGa2O4 host and the absorption of Cr3+.42,43 The excitation spectra of ZnGa2O4:Cr3+ has three main bands (inset of Fig. 5); the excitation peak at 260 nm results from the combination of the ZnGa2O4 host excitation band and the O–Cr charge transfer band.42 The other two bands at 410 nm (4A2–4T1 (te2) transition) and 550 nm (4A2–4T2 transition) originate from the 3d intra-shell transitions of Cr3+.44
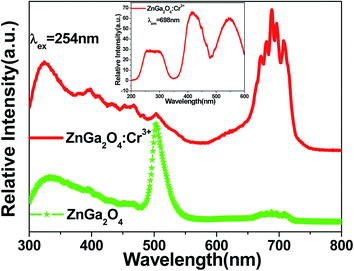 | ||
| Fig. 5 Emission spectra of ZnGa2O4 and ZnGa2O4:Cr3+ at room temperature under excitation with 254 nm wavelength light. The inset shows the excitation spectra of ZnGa2O4:Cr3+ monitored at 689 nm. | ||
As we mentioned above, the recombination rate of photo-generated electrons and holes determines the photoluminescence intensity. Hence, the intense emission intensity of ZnGa2O4:Cr3+ at 698 nm compared with that of ZnGa2O4 at 505 nm indicates that the doped Cr3+ ions may act as recombination centers. The incorporated recombination centers, which can highly reduce the amount and lifetime of photo-generated electron–hole pairs, could be the cause of the suppressed photocatalytic activity of ZnGa2O4:Cr3+.
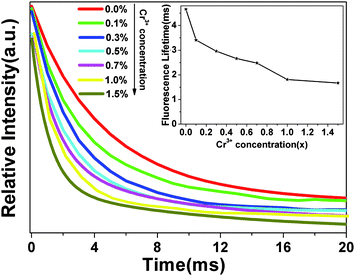
To prove that Cr3+ ions act as recombination centers, the blue fluorescence lifetimes (at 505 nm) of ZnGa2O4 were measured with different Cr3+ doping concentrations (x = 0.0%, 0.1%, 0.3%, 0.5%, 0.7%, 1.0%, 1.5%). As showed in Fig. 6, the fluorescence decay curves can be fitted by a single exponential function and the fitting results of the lifetimes are shown in the inset. It is clearly observed that the lifetimes of ZnGa2O4 at 505 nm become shorter with the increase of Cr3+ concentration as a result of energy transfer from ZnGa2O4 to Cr3+.45 The fluorescence lifetime reflects the average residence time of photo-generated electrons in the excited state. The shortened fluorescence lifetime of ZnGa2O4 means that the energy transfer becomes quicker with the increase of Cr3+ concentration, and the average residence time of photo-generated electrons in the excited state is shortened faster. Therefore, more channels are formed, benefiting the recombination of electrons and holes to transfer energy to Cr3+. Thus, Cr3+ ions act as recombination centers in ZnGa2O4, which accelerate the recombination of electrons and holes.
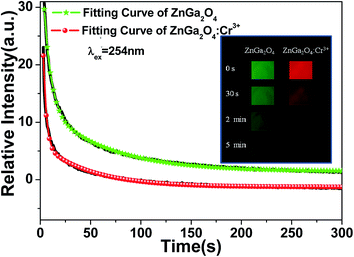
As it is generally accepted, long-lasting luminescence is a phenomenon whereby luminescence can last for hours after the stoppage of the excitation. The long-lasting luminescence of the phosphors is generated by the recombination of trapped electrons and holes that are released slowly through thermal motion after the stoppage of excitation. We measured the afterglow decay curves of ZnGa2O4 and ZnGa2O4:Cr3+ phosphors monitored at 505 nm and 698 nm after 5 min irradiation with a 254 nm UV lamp, respectively. As can be seen from Fig. 7, the as-prepared samples exhibited similar decay processes that contain a rapid decay phase at the beginning and a slow decay process afterward.46,47 In our study, the decay curves can be well fitted by a double exponential equation as follows:
| Samples | A1/(a.u.) | τ1/(s) | A2/(a.u.) | τ2/(s) |
|---|---|---|---|---|
| ZnGa2O4 | 31.00 | 6.96 | 11.49 | 63.24 |
| ZnGa2O4:Cr3+ | 20.77 | 3.00 | 6.93 | 68.77 |
Because a TL curve can reflect the trapping property of defects as well as the relevance of the long-lasting luminescence and the trap energy levels, we measured the TL curves of ZnGa2O4 and ZnGa2O4:Cr3+ in the range of 40–260 °C. In Fig. 8, under the same experimental conditions (same sample volumes are irradiated for 5 min by UV lamp, and then placed in dark room for 3 min before the measurement), the maximum TL intensity of ZnGa2O4 is almost seven times higher than that of ZnGa2O4:Cr3+ under thermal disturbance. This means that after the stoppage of irradiation from the UV lamp, the amount of trapped electrons/holes in ZnGa2O4 is almost seven times higher than that of ZnGa2O4:Cr3+. When heating, the captured electrons and holes will be released from traps and will recombine with each other in the form of TL. Fewer trapped electrons/holes mean fewer trap centers. The results of these TL curves confirmed that fewer trap centers are formed in ZnGa2O4 when doped with Cr3+.
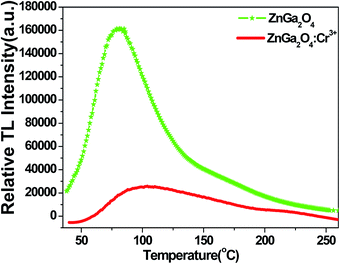 | ||
| Fig. 8 TL curves of ZnGa2O4 and ZnGa2O4:Cr3+ in the range of 40–260 °C. The sample was irradiated for 5 min by UV lamp, and then placed in dark room for 3 min before the measurement. | ||
In ZnGa2O4, abundant photo-generated electrons and holes were produced with an irradiation energy that was larger than the band gap energy of ZnGa2O4;48 one portion of the photo-generated electrons and holes recombined at recombination centers quickly to release energy in the form of photoluminescence; the other portion can be trapped by lattice defects, impurities, or co-dopants that act as traps in the material.49,50 The trapped photo-generated electrons/holes can delay the recombination of electrons and holes, which promotes the separation of electrons and holes and enhances charge transfer, thus effectively improving the photocatalytic activity. After stopping the radiation and with the thermal disturbance at proper temperatures, these trapped electrons and holes will be released from the traps, which can recombine with each other, followed by the emission of light as long-lasting luminescence. Hence, photocatalysis and long-lasting luminescence are significantly correlated. That is to say, the more trapped electrons and holes, the stronger the long-lasting luminescence intensity, and the higher the photocatalytic activity will be.
Based on the discussion above, a possible schematic illustration of the long-lasting luminescence and photocatalysis for ZnGa2O4 was proposed, and it is depicted in Fig. 9a. Upon 254 nm UV excitation, the incident photons are absorbed by the ZnGa2O4 host and the electrons are promoted from the valence band of ZnGa2O4 to the conduction band (progress (1)). Most of the electrons are transferred via the lattice directly to the luminescence centers (progress (2)), followed by the emissions 2EA–4A2 and 2EB–4A2 as photoluminescence (progress (3) and (4)), then a part of the excitation energy associated with the excited free electrons are captured by native defects via non-radiative relaxation (progress (5)). After UV irradiation is stopped, with the thermal disturbance at proper temperatures, these carriers will be released from the traps and transferred via the host to the luminescence centers (progress (6)), where they recombine with the opposite charge to produce the 2EA–4A2 emission as long-lasting luminescence. When excited free electrons are captured by electron traps, the photo-generated electrons and holes can be effectively separated, which could prevent the recombination of electrons and holes and lead to a longer lifetime of the photo-generated electrons and holes. The O2 near the photocatalyst/liquid interface could be then reduced to the superoxide radical anion ˙O2− and hydrogen peroxide H2O2 (eqn (3) and (4)) by the photo-generated electrons. The ˙O2− and H2O2 can further interact to produce hydroxyl radical ˙OH (eqn (6)), which is a powerful oxidizing species that can decompose most organic pollutants in water.51
| e− + O2 → ˙O2− | (3) |
| O2 + 2H+ + 2e− → H2O2 | (4) |
| H2O2 + e− → ˙OH + OH− | (5) |
| H2O2 + ˙O2− → ˙OH + OH− + O2 | (6) |
| H2O2 → 2˙OH | (7) |
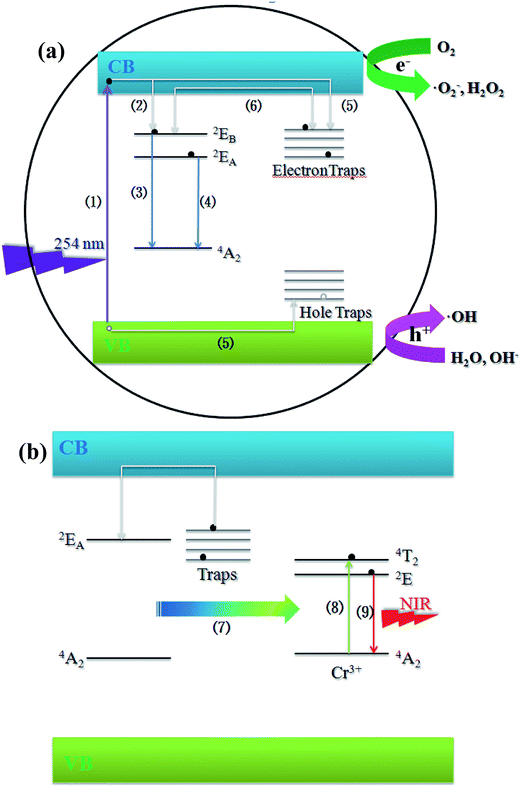 | ||
| Fig. 9 (a) Schematic illustration of the long-lasting luminescence and photocatalysis of ZnGa2O4. (b) Mechanism illustration of the persistent energy transfer between ZnGa2O4 host and Cr3+ ions. | ||
Fig. 9b presents a possible mechanism of photoluminescence for ZnGa2O4:Cr3+. After UV irradiation is stopped, the photo-generated electrons and holes captured by traps can be released slowly through thermal motion. Instead of recombining with the opposite charge to produce the 2EA–4A2 emission as long-lasting luminescence, the energy associated with electrons of the host is persistently transferred to the Cr3+ ion slowly via an effective non-radiative energy transfer (progress (7)).52 The persistent energy transfer leads to the promotion of the 3d electrons of Cr3+ from ground-state (4A2) to the excited-states 4T2 (progress (8)). The transitions between 4T2 and 2E are just non-radiative reactions. Then, the 2E–4A2 transition gives a NIR emission band at 698 nm to produce the persistent luminescence (progress (9)) that comes from the persistent energy transfer from the host.
Conclusions
In summary, ZnGa2O4 presents high photocatalytic activity to degrade RhB and excellent long-lasting luminescence properties under UV irradiation. The favorable edge position of ECB and EVB results in the strong redox ability of ZnGa2O4. When doped with Cr3+, its photocatalytic activity and long-lasting luminescence intensity are highly suppressed, and there is an effective persistent energy transfer between the host emission and the absorption of Cr3+, resulting in the NIR long-lasting luminescence at 698 nm. The surface areas of the as-synthesized ZnGa2O4 and ZnGa2O4:Cr3+ samples are almost same and the average particle sizes are about 0.78 μm and 0.80 μm, respectively. These results indicated that the same amount of ZnGa2O4 and ZnGa2O4:Cr3+ powders are comparable in the photocatalytic reaction. From luminescence properties, fluorescence decay curves and TL curves, it can be concluded that doped Cr3+ ions act as recombination centers but not as trap centers, and that the amount of trapped electrons/holes in ZnGa2O4 is almost seven times higher than that of ZnGa2O4:Cr3+. Therefore, it is proposed that the suppressed photocatalytic activity and long-lasting luminescence intensity in ZnGa2O4:Cr3+ come from the decrease in trapped electrons/holes and the shortened lifetime of the electron–hole pairs. Long-lasting luminescence intensity and photocatalytic activity are highly correlated. The photoluminescence properties can provide a firm theoretical foundation for designing new photocatalysts with high photocatalytic activity, as well as for evaluating the photocatalytic activities of some photocatalysts.Acknowledgements
This study is supported by the National Nature Science Foundation of China (no. 21271048).Notes and references
- M. Allix, S. Chenu, E. Véron, T. Poumeyrol, E. A. Kouadri-Boudjelthia, S. Alahraché, F. Porcher, D. Massiot and F. Fayon, Chem. Mater., 2013, 25, 1600 CrossRef CAS.
- W. N. Kim, H. L. Park and G. C. Kim, Mater. Lett., 2005, 59, 2433 CrossRef CAS PubMed.
- Y. Zhuang, J. Ueda and S. Tanabe, Appl. Phys. Express, 2013, 6, 052602 CrossRef.
- Q. L. M. De Chermont, C. Chanéac, J. Seguin, F. pellé, S. Maítrejean, J. P. Jolivet, D. Gourier, M. Bessodes and D. Scherman, Proc. Natl. Acad. Sci. U. S. A., 2007, 104, 9266 CrossRef PubMed.
- L. E. Shea, Electrochem. Soc. Interface, 1998, 7(2), 24 CAS.
- T. Minami, Y. Kuroi, T. Miyata, H. Yamada and S. Takata, J. Lumin., 1997, 72, 997 CrossRef.
- M. W. Josties, H. S. C. O'Neill, K. Bente and G. Brey, Neues Jahrb. Mineral., Monatsh., 1995, 6, 273 Search PubMed.
- A. F. Wells, Structural Inorganic Chemistry, Oxford University Press, London, 1975, p. 489 Search PubMed.
- K. Jeong, H. L. Park and S. Mho, Solid State Commun., 1998, 105(3), 179 CrossRef.
- S. Itoh, H. Toki, Y. Sato, K. Morimoto and T. Kishino, J. Electrochem. Soc., 1991, 138(5), 1509 CrossRef CAS PubMed.
- L. E. Shea, R. K. Datta and J. J. Brown, J. Electrochem. Soc., 1994, 141, 1950 CrossRef CAS PubMed.
- P. Dhak, U. K. Gayen, S. Mishra, P. Pramanik and A. Roy, J. Appl. Phys., 2009, 106(6), 063721 CrossRef PubMed.
- K. Ikarashi, J. Sato, H. Kobayashi, N. Saito, H. Nishiyama and Y. Inoue, J. Phys. Chem. B, 2002, 106, 9048 CrossRef CAS.
- R. Zhang, A. Villanueva, H. Alamdari and S. Kaliaguine, Catal. Commun., 2008, 9, 111 CrossRef CAS PubMed.
- X. Chen, H. Xue, Z. H. Li, L. Wu, X. X. Wang and X. Z. Fu, J. Phys. Chem. C, 2008, 112, 20393 CAS.
- S. K. Sampath, D. G. Kanhere and R. Pandey, J. Phys.: Condens. Matter, 1999, 11, 3635 CrossRef CAS.
- H. Kawazoe and K. Ueda, J. Am. Ceram. Soc., 1999, 82, 330 Search PubMed.
- W. W. Zhang, J. Y. Zhang, X. A. Lan, Z. Y. Chen and T. M. Wang, Catal. Commun., 2009, 10, 1781 CrossRef CAS PubMed.
- M. Sun, D. Z. Li, W. J. Zhang, Z. X. Chen, H. J. Huang, W. J. Li, Y. H. He and X. Z. Fu, J. Solid State Chem., 2012, 190, 135 CrossRef CAS PubMed.
- Q. Liu, D. Wu, Y. Zhou, H. B. Su, R. Wang, C. F. Zhang, S. C. Yan, M. Xiao and Z. G. Zou, ACS Appl. Mater. Interfaces, 2014, 6, 2356 CAS.
- S. C. Yan, J. J. Wang, H. L. Gao, N. Y. Wang, H. Yu, Z. S. Li, Y. Zhou and Z. G. Zhou, Adv. Funct. Mater., 2013, 23, 1839 CrossRef CAS PubMed.
- W. W. Zhang, J. Y. Zhang, X. A. Lan, Z. Y. Chen and T. M. Wang, Catal. Commun., 2010, 11, 1104 CrossRef CAS PubMed.
- V. B. R. Boppana and R. F. Lobo, ACS Catal., 2011, 1, 923 CrossRef CAS.
- H. Y. Chen, L. P. Wang, J. M. Bai, J. C. Hanson, J. B. Warren, J. T. Muckerman, E. Fujita and J. A. Rodriguez, J. Phys. Chem. C, 2010, 114, 1809 CAS.
- K. Wilke and H. D. Breuer, J. Photochem. Photobiol., A, 1999, 121, 49 CrossRef CAS.
- E. Borgarello, J. Kiwi, M. Gratzel, E. Pelizzetti and M. Visca, J. Am. Chem. Soc., 1982, 104, 2996 CrossRef CAS.
- U. Scharf, H. Schneider, A. Baiker and A. Wokaun, J. Catal., 1994, 145, 464 CrossRef CAS.
- I. Litter and J. A. Navio, J. Photochem. Photobiol., A, 1996, 98, 171 CrossRef.
- S. M. Karvinen, Ind. Eng. Chem. Res., 2003, 42, 1035 CrossRef CAS.
- M. A. Butler and D. S. Ginley, J. Electrochem. Soc., 1978, 125, 228 CrossRef CAS PubMed.
- H. Nethercot, Phys. Rev. Lett., 1974, 33, 1091 CrossRef.
- H. Hotop and W. C. Lineberger, J. Phys. Chem., 1985, 14, 731 CAS.
- Y. Xu and M. A. A. Schoonen, Am. Mineral., 2000, 85, 543 CAS.
- J. Bard, R. Parsons and J. Jordan, Standard Potentials in Aqueous Solution, Marcel Dekker, New York, 1985 Search PubMed.
- Z. S. liu, X. P. Jing and L. S. Wang, J. Electrochem. Soc., 2007, 154, H500 CrossRef CAS PubMed.
- W. N. Kim, H. L. Park and G. C. Kim, Mater. Lett., 2005, 59, 2433 CrossRef CAS PubMed.
- W. Zhang, J. Zhang, X. Lan, Z. Chen and T. Wang, Catal. Commun., 2010, 11, 1104 CrossRef CAS PubMed.
- J. S. Kim, H. L. Park and C. M. Chon, Solid State Commun., 2004, 129, 163 CrossRef CAS PubMed.
- J. S. Kim, H. I. Kang, W. N. Kim, J. I. Kim and J. C. Choi, Appl. Phys. Lett., 2003, 82(13), 2029 CrossRef CAS PubMed.
- L. E. Shea, R. K. Datta and J. J. Brown Jr, J. Electrochem. Soc., 1994, 141, 1950 CrossRef CAS PubMed.
- T. K. Jeong, H. L. Park and S. I. Mho, Solid State Commun., 1998, 105, 179 CrossRef.
- A. Bessiere, S. Jacquart, K. Priolkar, A. Lecointre, B. Viana and D. Gourier, Opt. Express, 2011, 19, 10131 CrossRef CAS PubMed.
- J. S. Kim, J. S. Kim and H. L. Park, Solid State Commun., 2004, 131, 735 CrossRef CAS PubMed.
- Z. W. Pan, Y. Y. Lu and F. Liu, Nat. Mater., 2012, 11, 58 CrossRef CAS PubMed.
- R. X. Zhong, J. H. Zhang, X. Zhang, S. Z. Lu and X. J. Wang, J. Lumin., 2006, 119, 327 CrossRef PubMed.
- P. Huang, D. Liu, C. E. Cui, L. Wang and G. Jiang, Appl. Phys. A, 2014, 116, 759 CrossRef CAS.
- Y. Zhuang, J. Ueda and S. Tanabe, J. Mater. Chem. C, 2013, 1, 7849 RSC.
- S. W. S. Mckeever, Thermoluminescence of Solids, Cambridge University Press, Cambridge, 1985 Search PubMed.
- T. Matsuzawa, Y. Aoki and N. Takeuchi, J. Electrochem. Soc., 1996, 143, 2670 CrossRef CAS PubMed.
- T. Aitasalo, P. Deren, J. Hölsä, H. Jungner, J. C. Krupa, M. Lastusaari, J. Legendziewicz, J. Niittykoski and W. Strek, J. Solid State Chem., 2003, 171, 114 CrossRef CAS.
- H. Liu, J. Yuan, W. F. Shang-guan and Y. Teraoka, J. Phys. Chem. C, 2008, 112, 8521 CAS.
- J. Kuang and Y. Liu, Chem. Phys. Lett., 2006, 424, 58 CrossRef CAS PubMed.
| This journal is © The Royal Society of Chemistry 2015 |

