Composition-dependent association behavior in the mixture of isopropanol and trichloromethane: a volumetric, vibration spectroscopic and quantum chemical study

Yu-Feng Zhangb, Rong-Yi Huang*a, Jun-Wei Wanga and Xue-Jun Konga
aAnhui Key Laboratory of Functional Coordination Compounds, School of Chemistry and Chemical Engineering, Anqing Normal University, Anqing 246011, PR China. E-mail: huangry@aqtc.edu.cn; Fax: +86-556-5500090; Tel: +86-556-5500090
bCollege of Chemical Engineering, Beijing University of Chemical Technology, Beijing 100029, PR China

Received 15th May 2015 , Accepted 20th July 2015

First published on 21st July 2015


Abstract

Herein the intermolecular associative behaviors in the binary mixture of isopropanol and trichloromethane have been studied via a combined excess volumetric, vibration spectroscopic and quantum chemical approach. The densities of the mixture studied were obtained at T = (283.15 to 323.15) K and at atmospheric pressure. From the experimental data, the excess molar volumes were obtained as a function of composition, and their corresponding fitted curves show a distinct sigmoidal feature at each temperature, which can be considered in terms of free packing effects and the presence of competition between intermolecular self- and cross-associated interactions. Meanwhile, the composition-dependent association behavior was further ascertained via vibration spectroscopic technology. In addition, the geometric structures, interaction energies, electron topology properties and Gibbs free energy changes of the self- and cross-associations in the mixture studied were investigated via quantum chemical calculations. The computational results have also been interpreted in terms of the composition-dependent association behavior in the mixture studied.

1. Introduction

The exploration of intermolecular associative behaviors has long gained considerable attention mainly due to their complex topologies and their potential applications in many fields, such as materials science, bio-chemistry, supramolecular chemistry and so on.1–4 The associative behaviors of molecules via hydrogen bonds (H-bonds) particularly, in the past few decades, have been investigated extensively in both experimental and theoretical aspects.5–8 As is well known, many physicochemical properties of substances can be influenced significantly by the intermolecular H-bond association as well as many thermodynamic processes,9–12 so the associative behavior for a mixture bearing H-bond interactions is of great interest. Alcohol is an unquestionable standard example for understanding intermolecular associative behavior via H-bonds. The hydroxyl group of alcohol molecules acts as a very good hydrogen-acceptor or hydrogen-donor and can often interact with organic molecules and water to form H-bond associations, and also construct an H-bond framework via self-associated interaction of alcohol molecules. It has been found that the structures and properties of the mixtures containing alcohol are dominated by the H-bond interaction. Up to now, numerous investigation works were undertaken for these mixtures involving alcohols based on the maturation of experimental techniques and theoretical methods.13–18 However, due to many influencing factors, such as the degree of intermolecular association, the aggregates of molecules, the composition of mixture and so on, it remains an under question to explore the nature of intermolecular associative behavior. Therefore, a systematic exploration for understanding the intermolecular associative behavior based on experimental techniques and theoretical methods is very profitable and crucial. Given the above-mentioned thoughtfulness and the continuation of our previous works upon the weak intermolecular non-covalent interactions in mixtures,19–21 we are herein focused on exploring the composition-dependent association behavior in binary mixture of isopropanol and trichloromethane via a combined volumetric, vibration spectroscopic and quantum chemical study. In our work, the excess molar volumes have been obtained by using the accurate values of density of isopropanol and trichloromethane mixture over the entire composition range at T = (283.15 to 323.15) K and at atmospheric pressure. Meanwhile, the liquid-phase FT-Raman and FT-IR spectra of the pure components and their respective mixtures (x1 = 0.30 and 0.90) were obtained at room temperature. Both above-mentioned experimental results exhibit the presence of composition-dependent associative behavior in the mixture studied. Moreover, the geometric and electronic structures of self- and cross-associations via H-bond interaction in the mixture studied were fully optimized at the ωB97XD/6-311++G(d,p) level, and the composition-dependent associative behavior was further ascertained by using quantum chemical calculations.

2. Experimental and computational methods

2.1. Materials

The commercially available isopropanol and trichloromethane were obtained from Shanghai Chemical Reagent Co. with mass purity >99.5% and used as received without further purification. The purities of two solvents used were further ascertained via comparing their densities and refractive indices at T = 298.15 K with the reported ones in the literature (Table S1).22–28

2.2. Apparatus and procedures

The mixtures studied were prepared by weighing apparent amounts of the pure components on an electric balance (Model FA2006D, Shanghai Xinnuo instrument company, China) accurate to 0.1 mg. The densities and refractive indices were obtained via a vibrating U-shaped tube digital densimeter (Mettler-Teledo DE40 model) and refractometer (Mettler Teledo RE40 model), respectively. Based on manufacturer's declaration, the precision in density measurement is ±0.0001 g cm−1, and for the refractive index is ±0.0001. The details of calibration of the instruments and the measurement procedure have been presented elsewhere.20,21 The room temperature FT-Raman spectra were measured in the range 50–3500 cm−1 with 2 cm−1 resolution on a DXR Raman microscope (Thermo Scientific) with a 532 nm laser. The liquid samples were sealed in glass capillary. FT-IR spectra over the range of 400–4000 cm−1 were recorded at room temperature via an iS50 FT-IR (Nicolet) spectrometer with 4 cm−1 resolution.

2.3. Computational details

All computations were performed with the Gaussian09 D.01 procedure.29 We employed the ωB97X-D method30,31 with the 6-311++G(d,p) basis set32 to optimize the geometrical and electronic structures of both the two isolated monomers isopropanol and trichloromethane and their intermolecular associations. The ωB97X-D method contained long range corrections and empirical dispersion can better treat non-covalent type of interactions than the conventional density functional theory (DFT).33–35 The 6-311++G(d,p) basis set used designates the basis set 6-311G supplemented by diffuse functions for all atoms, and supplemented by one set of d functions on heavy atoms (C, O and Cl) and one set of p functions for hydrogens. All stable geometrical structures obtained at the energy minimum were confirmed via none of the imaginary vibrational frequency. The AIM36 analyses of the nature of intermolecular associative interactions for the associations were performed by utilizing the Multiwfn software.37 In addition, for visualization of intermolecular associative interactions of the associations, the reduced density gradient,38 s = 1/(2(3π2)1/3)|∇ρ|/ρ4/3 versus sign(λ2)ρ scatter diagram as well as non-covalent interaction gradient isosurfaces with s = 0.50 a.u. in real space were also calculated based on Multiwfn software. Therefore, the interaction energies for four stable associations were estimated as the difference between the total energy of the association and the sum of the total energies of two corresponding monomers, considering the zero point vibrational energy, ZPE. The basis-set superposition error, BSSE was computed using the counterpoise method of Boys and Bernardi.39 In-depth ascertainment of the relative strength of H-bonds for the associations was presented based on the Natural Bond Orbital, NBO method.40

3. Results and discussion

3.1. Excess molar volumes

The experimental data of density, for the mixture studied at T = (283.15 to 323.15) K and at atmospheric condition, are given in Table S2. The corresponding excess molar volumes, VE are directly calculated based on the above-mentioned experimental data of density via using the following formula:
 
image file: c5ra09071g-t1.tif(1)
where ρi, xi and Mi are the density, mole fraction and molar mass of the pure components, respectively. ρ is the density of the mixture studied.

The composition dependence of VE for the mixture studied is correlated via the Redlich–Kister type polynomial equation:

 
image file: c5ra09071g-t2.tif(2)
where x1 is the mole fraction of isopropanol, n is the number of estimated parameters and Ai's are the adjustable polynomial coefficients obtained via fitting the above-mentioned equation. All parameters, Ais and standard deviations, SDs were listed in Table S3.

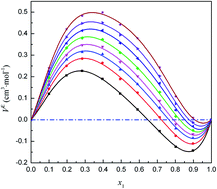
The calculated values of VE for the mixture studied, plotted versus composition of isopropanol, x1 at T = (283.15 to 323.15) K as well as the curves fitted based on the Redlich–Kister polynomial equation, are displayed in Fig. 1. Interestingly, these curves fitted exhibit a distinct sigmoidal behavior at T = (283.15 to 323.15) K. The calculated VE of the mixture studied are positive at lower mole fractions of isopropanol and becomes negative at higher mole fractions. In addition, with the increasing temperature, the calculated values of VE become more and more positive at lower mole fractions whereas less and less negative at higher mole fractions, accompanying with the well defined maxima and minima in the curves fitted of VE moved to the higher mole fractions of isopropanol. For the mixture studied, these results can be considered in terms of packing effects and the presence of intermolecular self- and cross-associated interactions competition in the mixture studied based on the nature of isopropanol and trichloromethane monomers. Fig. S1 present the molecular electrostatic surface potential, ESP of isopropanol and trichloromethane via theoretical computation, exhibiting the presence of one maximum and minimum ESP value around hydroxyl hydrogen (+40.89 kcal mol−1) and hydroxyl oxygen (−37.01 kcal mol−1) of isopropanol, respectively. At one time, it was also found the one maximum and minimum ESP value around hydrogen (+35.47 kcal mol−1) and chlorine (−7.71 kcal mol−1) for trichloromethane. Obviously, in the mixture studied, there can contain two types of H-bond associations, and the OH⋯O H-bond in the self-association is stronger than the CH⋯O and OH⋯Cl H-bonds in the cross-associations. The stronger H-bond self-associations of isopropanol monomers were destroyed via the weaker cross-associations of isopropanol and trichloromethane at the lower mole fractions of isopropanol, so the calculated VE are positive. At the higher mole fractions, free packing effects are dominated via the accommodation of trichloromethane molecules in the H-bond framework of isopropanol due to there are enough isopropanol molecules to reconstruct the H-bond framework in the mixture studied, which results in the negative VE. All above these can also be in-depth ascertained via the following vibrational spectroscopic and computational studies.


image file: c5ra09071g-f1.tif
Fig. 1 Variation of the excess molar volume, VE of isopropanol (1) + trichloromethane (2) mixture at different temperatures. (■), T = 283.15 K; (●), T = 293.15 K; (▲), T = 298.15 K; (▼), T = 303.15 K, (◆), T = 308.15 K; (◀), T = 313.15 K; (▶), T = 318.15 K; (★), T = 323.15 K. The solid curves have been derived from eqn (2).

3.2. Calculations of intermolecular associations

3.2.1. Structure and electron density analysis. To further aid in the interpretation of intermolecular self- and cross-associated interactions in the mixture studied, four intermolecular associative models (Ia, Ib, IIa and IIb) were performed based on the ESP analysis of the isopropanol and trichloromethane monomers. All optimized stable structures of the associations performed were successfully obtained at the ωB97X-D/6-311++G(d,p) level. The stable geometric structures of the associations obtained were illustrated in Fig. 2. Selected hydrogen bond lengths and angles are all within the generally proposed range of a typical H-bond41 (Table 1). Moreover, the H-bond characteristic parameter, ΔR(H⋯A) of four associations obtained are also listed in Table 1, which can directly predict the strength of H-bond interaction in different H-bonds. As shown in Table 1, the largest ΔR(H⋯A) value is 1.5504 Å of the O1–H1⋯O2 H-bond in self-association Ia, which shows the strongest H-bond. According to ΔR(H⋯A) values, the strength order of H-bonds in four associations is O1H1⋯O2 (Ia) > O1H1⋯O2 (Ib) > C1H1⋯O1 (IIa) > O1H1⋯Cl1 (IIb) > C1H1⋯O1 (Ib) > C2H2⋯Cl2 (IIb) > C2H3⋯Cl1 (IIa) > C3H3⋯Cl1 (IIb) > C2H2⋯Cl3 (IIb) > C2H2⋯Cl2 (IIa) > C1H2⋯O2 (Ia) > C3H3⋯Cl3 (IIb).
image file: c5ra09071g-f2.tif
Fig. 2 Optimized structures of Ia, Ib, IIa, and IIb at the ωB97X-D/6-311++G(d,p) level.
Table 1 Distances (Å) and angles (°) of H-bonds for the four associations at the ωB97X-D/6-311++G(d,p) levela
Associations D–H⋯A R(D–H) R(H⋯A) ΔR(H⋯A) R(D⋯A) ∠(DHA)
a ΔR(H⋯A) = R(H)vDW + R(A)vDWR(H⋯A), where R(H)vDW and R(A)vDW are van der Waals radii of H and A atoms obtained by Allinger,42 respectively.
Ia O1–H1⋯O2 0.9676 1.8896 1.5504 2.8508 171.90
C1–H2⋯O2 1.0936 2.9302 0.5098 3.6675 124.92
Ib O1–H1⋯O2 0.9669 1.8938 1.5462 2.8540 171.67
C1–H2⋯O1 1.0919 2.7540 0.6860 3.5136 126.39
IIa C1–H1⋯O1 1.0872 2.0081 1.4319 3.0952 179.33
C2–H2⋯Cl2 1.0923 3.1801 0.5099 3.9838 131.07
C2–H3⋯Cl1 1.0940 3.1383 0.5517 3.9754 133.86
IIb O1–H1⋯Cl1 0.9590 2.7910 0.8990 3.7021 158.94
C2–H2⋯Cl2 1.1000 3.0786 0.6114 3.8992 131.82
C2–H2⋯Cl3 1.1000 3.1730 0.5170 3.9647 129.51
C3–H3⋯Cl1 1.0941 3.1480 0.5420 4.0334 138.53
C3–H3⋯Cl3 1.0941 3.2788 0.4112 3.8695 114.95


Moreover, electron density analyses were applied here to display the basic electronic character of the intermolecular H-bonds for the above associations obtained. Based on the AIM theory, the electron density, ρ(r), Laplacian, ∇2ρ(r), and electron energy density, H(r) at the bond critical points, BCPs of all H-bonds are represented in Table 2. From Table 2, we can acquire that the electron density values of intermolecular H-bonds for the four associations obtain all fall in the general range of 0.002 to 0.035 a.u. of a typical hydrogen bond,43 which directly demonstrates that H-bond interactions come into being in the above four associations studied. Based on the values of ρ(r), the strength order of the H-bonds is in agreement with the above-mentioned result of geometrical structure analysis except for the C1–H2⋯O2 (Ia) H-bond. In addition, the positive ∇2ρ(r) values show that all H-bonds can be qualifiedly considered as the closed-shell interactions.44 The positive values of H(r), and the values of |V(r)|/G(r) (<1) in-depth disclose that all H-bonds are basically classified as electrostatic character and typical character of non-covalent interactions.

Table 2 Topological parameters at bond critical points of H-bonds for the four associations obtained via AIM analysis
  BCPs ρ(r) 2ρ(r) H(r) |V(r)|/G(r)
Ia O1–H1⋯O2 0.028568 0.102622 0.001513 0.937329
C1–H2⋯O2 0.006009 0.020902 0.000828 0.811733
Ib O1–H1⋯O2 0.027709 0.102949 0.001804 0.924626
C1–H2⋯O1 0.006344 0.022859 0.000877 0.818689
IIa C1–H1⋯O1 0.022509 0.084254 0.002507 0.864903
C2–H2⋯Cl2 0.003977 0.012663 0.000667 0.733093
C2–H3⋯Cl1 0.004418 0.013130 0.000642 0.756818
IIb O1–H1⋯Cl1 0.006688 0.021819 0.001185 0.722482
C2–H2⋯Cl2 0.004978 0.015460 0.000735 0.765251
C2–H2⋯Cl3 0.004298 0.013376 0.000655 0.756415
C3–H3⋯Cl1 0.004302 0.013478 0.000690 0.742441
C3–H3⋯Cl3 0.003777 0.012213 0.000669 0.719379


Further, a visualization of the non-covalent interactions can be described in Fig. 3, which presents the plots of the reduced density gradient versus sign(λ2)ρ and the reduced density gradient isosurface with s = 0.50 a.u. The scatter plots of the four associations effectively exhibit the typical character of sharp spike(s) of weak intermolecular interaction in the low-density region. According to the sign of the sharp spikes, the associations Ia, Ib and IIa contain a strong H-bond interaction at sign(λ2)ρ = −0.028568 (O1H1⋯O2 (Ia)), −0.027709 (O1H1⋯O2 (Ib)) and −0.022509 (C1H1⋯O1 (IIa)) a.u., respectively. Moreover, For all associations employed, some spikes located at sign(λ2)ρ = ∼−0.005 a.u. exhibit the weak H-bond interactions, and other spikes situated at positive sign(λ2)ρ = ∼0.005 a.u. show repulsive interactions. All these are in good agreement with the above results of the geometrical structure and electron density analysis. In addition, the reduced density gradient isosurfaces show a productive visualization of non-covalent interactions as the broad regions in real space. For four associations employed, we can directly obtain the strong H-bonds, weaker H-bonds and weaker repulsive interactions based on the gradient isosurfaces. Similar to the scatterplot and AIM analyses, the OH⋯O H-bonds for the self-associations Ia and Ib, and CH⋯O H-bond for the cross-association IIa can be anticipated to be stronger as gained via the clear blue bonding isosurface disks between the H-bonds donor group and acceptor group as well as the weak H-bonds of the four associations employed via the green bonding isosurfaces. Simultaneously the olive non-bonded overlap isosurface between two monomers indicates the intermolecular weak repulsion. In addition, comparing the gradient isosurfaces, we can obtain that the intermolecular interactions are more delocalized in the cross-associations compared to the ones in the self-associations. So the intermolecular dispersion interactions of the cross-associations are larger than the ones of the self-associations, which would increase the stability of the cross-associations relative to the self-associations of the isopropanol monomers. The larger dispersion interactions would be propitious to the formation of cross-associations and the decomposition of self-associations at the lower mole fractions whereas the accommodation of trichloromethane monomers in the H-bond framework of isopropanol at the higher mole fractions. As a consequence, an interesting sigmoidal behavior of VE was exhibited during the mixing process of isopropanol and trichloromethane.


image file: c5ra09071g-f3.tif
Fig. 3 Plots of the reduced density gradient versus the electron density multiplied by the sign of the second hessian eigenvalue and gradient isosurfaces with s = 0.5 a.u. for the associations. The surfaces are colored on a blue–green–red scale according to values of sign(λ2)ρ, ranging from −0.03 to 0.02 a.u.
3.2.2. Interaction energy analysis. In order to further obtain a pictogram that bears a lot of H-bond interactions for the above-mentioned associations, the results of the interaction energies are listed in Table 3, as well as the NBO analysis. According to Table 3, the NBO analysis presents that the strength order of the four associations studied is Ia (63.55 kJ mol−1) > Ib (61.25 kJ mol−1) > IIa, (44.89 kJ mol−1) > IIb (10.84 kJ mol−1). Similar to the NBO analysis, the intermolecular binding energy, ΔE absolute for the above-mentioned four associations increase in the order of IIb < IIa < Ib < Ia, which further shows that the stability order of the above-mentioned four associations is IIb < IIa < Ib < Ia in the mixture employed. Overall, the results of the binding energy and NBO analysis indicate that the intermolecular self-associated interaction of isopropanol monomers is much stronger than the intermolecular cross-associated interaction in the mixture employed, so the observed values of VE at lower mole fractions are all positive due to the formation of the weaker cross-association and the decomposition of the stronger self-associations of isopropanol monomers whereas negative at higher mole fractions due to the H-bond framework of isopropanol based on the stronger self-associated interactions. All above these coincide with the results of the experimental observed analysis. In addition, based on the vibrational and statistical thermodynamics analyses, the Gibbs free energy change, ΔGT is obtained and given in Fig. S2, which is calculated from the above-mentioned four associations relative to their corresponding monomers. According to the ΔGT, the stability of the four associations becomes low with the surrounding temperature increase, so the values of VE are more and more positive at the lower mole fractions whereas less and less negative at the higher mole fractions, which is good agreement with the picture of the above-mentioned experimental determination.
Table 3 Interaction energies corrected with BSSE, ΔEint, bonding energies, ΔE and second-order perturbation stabilization energy, E(2) for the four associations at the ωB97X-D/6-311++G(d,p) level (in kJ mol−1)
Associations ΔEint ΔEZPVE ΔE E(2)
Ia −33.35 8.44 −24.91 63.55
Ib −31.46 7.01 −24.45 61.25
IIa −27.66 3.81 −23.85 44.89
IIb −11.30 2.70 −8.60 10.84


3.3. Vibration spectra analysis

As it is well known, vibration spectroscopy is a convenient and effective technique to explore the intermolecular associative interactions in solution. In this work, we present the liquid-phase FT-IR and FT-Raman spectra of the pure components and their respective mixtures (x1 = 0.30 and 0.90) at room temperature. Fig. 4 presents the FT-IR spectra in the region 2500–3700 cm−1 recorded for the H-bond O–H bond stretching vibration bands of isopropanol and the mixture studied at x1 = 0.30 and 0.90 mole fractions, which displays that their corresponding wavenumbers of O–H bond stretching vibration are 3338.4 (isopropanol), 3355.5 (x1 = 0.30) and 3339.9 (x1 = 0.90) cm−1, respectively. Interestingly, the wave number decreases with increasing concentration of isopropanol in the mixture studied. Significant red shifts of the O–H bond stretching vibration peaks exhibit that the self-associations of isopropanol are formed at x1 = 0.90 as well as the cross-associations take place at x1 = 0.30 between isopropanol and trichloromethane. Moreover, based on our aforementioned calculated VE of the mixture studied and computational analysis, there may be two types of isopropanol and trichloromethane cross-associations at x1 = 0.30. One of them is 1[thin space (1/6-em)]:[thin space (1/6-em)]2 cross-association, isopropanol–(trichloromethane)2 and the other one is 1[thin space (1/6-em)]:[thin space (1/6-em)]3 cross-association, isopropanol–(trichloromethane)3. The stable geometric structures, which were successfully obtained at the ωB97X-D/6-311++G(d,p) level, were illustrated in Fig. S3. The computational wavenumbers of the H-bond O–H stretching vibrations of the above cross-associations are 3499 and 3472 cm−1, respectively, while the computational wavenumbers of the self-associations Ia and Ib are 3367 and 3377 (Ib) cm−1, respectively. Interestingly, the computational wavenumbers of the H-bond O–H stretching vibrations are in good agreement with the results observed, which further presents that the self-associations of isopropanol are formed at x1 = 0.90 whereas the cross-associations at x1 = 0.30 between isopropanol and trichloromethane. In addition, Fig. 4 and S4 further show that the FT-IR spectra of isopropanol and the mixture studied at x1 = 0.90 are almost not changed, which indicates the H-bond framework of isopropanol comes into being in the mixture studied and the accommodation of trichloromethane molecules in the H-bond framework of isopropanol at x1 = 0.90 mole fraction. Similar to the FT-IR analysis, the FT-Raman can also draw a complete equal conclusion, as shown in Fig. S5. All above these coincides with the results of the above-mentioned experimental and theoretical analysis.
image file: c5ra09071g-f4.tif
Fig. 4 Infrared spectra of O–H stretching mode of isopropanol, 2-Pro and the mixtures studied at x1 = 0.30 and 0.90.

4. Conclusion

In this work, we have presented the observed values of the densities, excess molar volumes of the mixture of isopropanol and trichloromethane over the whole composition ranges at T = (283.15 to 323.15) K. The curves fitted of excess molar volumes exhibit an interesting sigmoidal behavior due to the composition-dependent associative behaviors in the mixture studied. The positive VE values at lower mole fractions are most likely from the breaking the stronger intermolecular self-associated interaction between isopropanol monomers, and the forming the weaker intermolecular cross-associations between unlike components during the mixing process. The negative VE values at higher mole fractions indicate that the H-bond framework of isopropanol comes into being due to the strong intermolecular self-associated interactions between isopropanol monomers and free filling effects of trichloromethane monomers. The FT-IR and FT-Raman spectra further ascertain that the composition-dependent association behaviors take place in the mixture studied. Meanwhile, the theoretical calculations are performed on the intermolecular associations, and deepen the feature of the intermolecular associated interactions. Interestingly, the extended analyses of theoretical calculation completely coincide with the experimental observation results. On the basis of these findings, we exhibit the relationship between the physical properties of the mixture studied and the nature of composition-dependent association behaviors.

Acknowledgements

This study was supported by the NSFC (nos 21407004, 21203003), and Natural Science Foundation of Anhui Province, China (no. 1508085QB48).

References

  1. S. Scheiner, Molecular Interactions: From van der Waals to Strongly Bound Complexes, John Wiley & Sons, England, 1997 Search PubMed.
  2. G. A. Jeffrey and W. Saenger, Hydrogen Bonding in Biological structures, Springer-Verlag, New York, 1994 Search PubMed.
  3. G. R. Desiraju, Acc. Chem. Res., 2002, 35, 565–573 CrossRef CAS PubMed.
  4. L. Sobczyk, S. J. Grabowski and T. M. Krygowski, Chem. Rev., 2005, 105, 3513–3560 CrossRef CAS PubMed.
  5. S. Melandri, M. E. Sanz, W. Caminati, P. G. Favero and Z. Kisiel, J. Am. Chem. Soc., 1998, 120, 11504–11509 CrossRef CAS.
  6. R. Gopi, N. Ramanathan and K. Sundararajan, J. Phys. Chem. A, 2014, 118, 5529–5539 CrossRef CAS PubMed.
  7. C. L. Andersen, C. S. Jensen, K. Mackeprang, L. Du, S. Jørgensen and H. G. Kjaergaard, J. Phys. Chem. A, 2014, 118, 11074–11082 CrossRef CAS PubMed.
  8. A. Zapata-Escobar, M. Manrique-Moreno, D. Guerra, C. Z. Hadad and A. Restrepo, J. Chem. Phys., 2014, 140, 184312–184322 CrossRef PubMed.
  9. K. V. Tretiakov, K. J. M. Bishop, B. Kowalczyk, A. Jaiswal, M. A. Poggi and B. A. Grzybowski, J. Phys. Chem. A, 2009, 113, 3799–3803 CrossRef CAS PubMed.
  10. Q. Z. Li, X. L. An, B. A. Gong and J. B. Cheng, J. Phys. Chem. A, 2007, 110, 10166–10169 CrossRef PubMed.
  11. J. Dudowicz, J. F. Douglas and K. F. Freed, J. Phys. Chem. B, 2008, 112, 16193–16204 CrossRef CAS PubMed.
  12. H. Qin and P. Z. Shi, J. Phys. Chem. B, 2009, 113, 2225–2230 CrossRef PubMed.
  13. T. V. Krishna and T. M. Mohan, J. Chem. Thermodyn., 2012, 47, 267–275 CrossRef PubMed.
  14. M. Rani, S. Agarwal, P. Lahot and S. Maken, J. Ind. Eng. Chem., 2013, 19, 1715–1721 CrossRef CAS PubMed.
  15. D. S. Kuen and K. J. Feierabend, J. Phys. Chem. A, 2014, 118, 2942–2951 CrossRef CAS PubMed.
  16. M. Almasi, J. Chem. Thermodyn., 2014, 69, 101–106 CrossRef CAS PubMed.
  17. M. Rani and S. Maken, Thermochim. Acta, 2013, 559, 98–106 CrossRef CAS PubMed.
  18. F. Billes, I. Mohammed-Ziegler and H. Mikosch, Phys. Chem. Chem. Phys., 2011, 13, 7760–7772 RSC.
  19. R. Y. Huang, R. B. Du, G. X. Liu, X. Q. Zhao, S. Y. Ye and G. H. Wu, J. Chem. Thermodyn., 2012, 55, 60–66 CrossRef CAS PubMed.
  20. C. Guo, H. Fang, R. Y. Huang, H. Xu, G. H. Wu and S. Y. Ye, Chem. Phys. Lett., 2013, 588, 97–101 CrossRef CAS PubMed.
  21. Y. F. Zhang, R. Y. Huanga, J. W. Wang, T. M. Geng, S. P. Zhao and G. H. Wu, Chem. Phys. Lett., 2014, 612, 223–228 CrossRef CAS PubMed.
  22. S. Gahlyan, M. Rani and S. Maken, J. Mol. Liq., 2014, 199, 42–50 CrossRef CAS PubMed.
  23. G. P. Dubey and P. Kaur, J. Chem. Thermodyn., 2014, 79, 100–108 CrossRef CAS PubMed.
  24. H. A. Zarei, S. Asadi and H. Iloukhani, J. Mol. Liq., 2008, 141, 25–30 CrossRef CAS PubMed.
  25. R. P. Schutte, T. C. Liu and L. H. Hepler, Can. J. Chem., 1989, 67, 446–448 CrossRef CAS.
  26. J. A. Riddick, W. B. Bunger and T. K. Sakano, Techniques of Chemistry, Organic Solvents. Physical Properties and Methods of Purifications, John Wiley & Sons, New York, 1986 Search PubMed.
  27. A. F. A. Asfour and F. A. L. Dullien, J. Chem. Eng. Data, 1981, 26, 312–316 CrossRef CAS.
  28. T. M. Aminabhavi and V. B. Patil, J. Chem. Eng. Data, 1998, 43, 497–503 CrossRef CAS.
  29. M. J. Frisch, G. W. Trucks, H. B. Schlegel, G. E. Scuseria, M. A. Robb, J. R. Cheeseman, G. Scalmani, V. Barone, B. Mennucci, G. A. Petersson, H. Nakatsuji, M. Caricato, X. Li, H. P. Hratchian, A. F. Izmaylov, J. Bloino, G. Zheng, J. L. Sonnenberg, M. Hada, M. Ehara, K. Toyota, R. Fukuda, J. Hasegawa, M. Ishida, T. Nakajima, Y. Honda, O. Kitao, H. Nakai, T. Vreven, J. A. Montgomery Jr, J. E. Peralta, F. Ogliaro, M. Bearpark, J. J. Heyd, E. Brothers, K. N. Kudin, V. N. Staroverov, R. Kobayashi, J. Normand, K. Raghavachari, A. Rendell, J. C. Burant, S. S. Iyengar, J. Tomasi, M. Cossi, N. Rega, J. M. Millam, M. Klene, J. E. Knox, J. B. Cross, V. Bakken, C. Adamo, J. Jaramillo, R. Gomperts, R. E. Stratmann, O. Yazyev, A. J. Austin, R. Cammi, C. Pomelli, J. W. Ochterski, R. L. Martin, K. Morokuma, V. G. Zakrzewski, G. A. Voth, P. Salvador, J. J. Dannenberg, S. Dapprich, A. D. Daniels, O. Farkas, J. B. Foresman, J. V. Ortiz, J. Cioslowski and D. J. Fox, Gaussian 09, Revision D. 01, Gaussian, Inc., Wallingford, CT, 2013 Search PubMed.
  30. J. D. Chai and M. head-Gordon, Phys. Chem. Chem. Phys., 2008, 10, 6615–6620 RSC.
  31. J. D. Chai and M. Head-Gordon, J. Chem. Phys., 2008, 128, 084106 CrossRef PubMed.
  32. M. J. Frisch, J. A. Pople and J. S. Binkley, J. Chem. Phys., 1984, 80, 3265–3269 CrossRef CAS PubMed.
  33. L. Rao, H. W. Ke, G. Fu, X. Xu and Y. J. Yan, J. Chem. Theory Comput., 2009, 5, 86–96 CrossRef CAS.
  34. Z. G. Huang, L. Yu and Y. M. Dai, Int. J. Quantum Chem., 2011, 111, 3915–3927 CAS.
  35. Z. G. Huang, Y. M. Dai, H. K. Wang and L. Yu, J. Mol. Model., 2011, 17, 2781–2796 CrossRef CAS PubMed.
  36. R. F. W. Bader, Atoms in Molecules, A Quantum Theory, Oxford University Press, Oxford, 1990 Search PubMed.
  37. T. Lu and F. Chen, J. Comput. Chem., 2012, 33, 580–592 CrossRef CAS PubMed.
  38. E. R. Johnson, S. Keinan, P. Mori-Sanchez, J. Contreras-Garcia, A. J. Cohen and W. Yang, J. Am. Chem. Soc., 2010, 132, 6498–6506 CrossRef CAS PubMed.
  39. S. F. Boys and F. Bernardi, Mol. Phys., 1970, 19, 553–566 CrossRef CAS PubMed.
  40. F. Weinhold and C. landis, Valency and Bonding, A Nature Bond Orbital Donor-Acceptor Perspective, Cambridge University Press, New York, 2005 Search PubMed.
  41. T. Steiner, Angew. Chem., Int. Ed., 2002, 41, 48–76 CrossRef CAS.
  42. N. L. Allinger, X. Zhou and J. Bergsma, J. Mol. Struct.: THEOCHEM, 1994, 312, 69–83 CrossRef.
  43. U. Koch and P. L. A. Popelier, J. Phys. Chem., 1995, 99, 9747–9754 CrossRef CAS.
  44. R. F. W. Bader and H. Essén, J. Chem. Phys., 1984, 80, 1943–1960 CrossRef CAS PubMed.

Footnote

Electronic supplementary information (ESI) available. See DOI: 10.1039/c5ra09071g

This journal is © The Royal Society of Chemistry 2015
Click here to see how this site uses Cookies. View our privacy policy here.