DOI:
10.1039/C5RA09062H
(Paper)
RSC Adv., 2015,
5, 71593-71600
Application of chemically synthesized polypyrrole with hydro-sponge characteristic as electrode in water desalination†
Received
15th May 2015
, Accepted 17th August 2015
First published on 17th August 2015
Abstract
In this article, the chemical oxidative approach was employed to synthesize bulk sponge-like polypyrrole; p-toluenesulfonate (pTSNa), sodium benzene-sulfonate (BSNa) and sodium nitrate (NaNO3) were chosen, respectively, as doping agents to modify the sponge polypyrrole. The microstructure, specific surface area and electrochemical activity of doped polypyrrole samples were characterized. Through repeated expansion and contraction tests, it was proved that the bulk polypyrrole samples exhibited excellent sponge property. To investigate the potential desalination ability, this type of sponge-characteristic polypyrrole was processed into electrodes, and applied in saline solution to remove sodium ions by the electrochemical approach. The results showed that the sponge polypyrrole performed wonderful desalination effect with above 20 mg Na+ for per gram polypyrrole.
1. Introduction
In recent years, the electro-sorption, also known as capacitive deionization, has attracted extensive attention for its high energy-efficiency, non-chemical addition, and excellent ion removal performance at high ionic concentration.1 This technique could realize efficient desalination at low voltages by the reversible charge/discharge process on the capacitor electrodes. Therefore, the electrode material with high adsorption capacity is essential for the application of electro-sorption technology.2 Carbon-based materials, such as active carbon,3,4 carbon nanotubes5,6 and graphene,7 have been widely studied as electrode materials for their porous structure, excellent conductivity and large specific surface area. Since the carbon-based electrodes are usually two-dimensional structure and the electro-adsorption takes place on the electrode and aqueous solution interface, the electro-adsorption capacity is drastically influenced by the effective surface area. There are various approaches to improve the effective surface area,8–10 however, the low adsorption capacity still remain one of the drawbacks that limit the application of carbon materials in the electro-sorption process.
Recently, the conductive polymers (CPs) are becoming one of the attractive candidates as electrode material to enhance the adsorption capacity.11–13 The ion exchange between the polymer and the aqueous solution takes place simultaneously with the charge/discharge (doping/de-doping) process of conducting polymers.14 Furthermore, the ion exchange of conducting polymers can be realized both in the interior (polymer matrix) and on the surface of the electrode, which implies that it is a three-dimensional process instead of two-dimensional one.15 Thus, it is speculated that the CPs may display better electro-sorption capacity than the conventional carbon-based materials.
Among various CPs, PPy is considered to be an appropriate electrode material for electro-sorption, given its intrinsic good electrical conductivity, environmental stability, biocompatibility and the ease of synthesis.16,17 In addition, PPy usually presents fast doping/de-doping process, which is beneficial for the rapid charge exchange (or ion exchange) in the polymer matrix.18 More importantly, the conductive performance of PPy can be substantially improved through the ion doping process during its preparation procedure. According to literatures, there are several ions that can be employed as the counter anions in the matrix of PPy.19,20 The largest amount of the counter anions in the doped PPy is about 30% in molar ratio.21,22 Whereas, organic or inorganic ions can both be as the counter anions doped in PPy matrix and can be exchanged by other ions.23 The ion exchange type primarily depends on the size of the counter anions. The anion exchange behavior is mainly exhibited when PPy is doped with small anions because of the high mobility of these ions in the polymer matrix.24,25 On the contrary, the cation exchange is found to take place in the PPy doped with large-sized anions, as these ions are trapped in the PPy matrix.15,26,27 Both anion and cation exchanges can be observed when the dopant anions are medium size which is larger than the size of Cl−, NO3−, SO42−, while smaller than that of polymeric dopants, anionic polyelectrolytes or large surfactant anions.28,29 The dopants could significantly affect the physicochemical properties of PPy, such as conductivity, morphology, solubility and adsorption performance,30–33 and this will further affect the electro-sorption performance of PPy.
In most of relevant studies, the structure of the doped PPy served as the electro-sorption electrodes, is two-dimensional by their synthetic method.2,13 Sadly few studies are devoted to the three-dimensional electro-sorption process using hydro-sponge PPy as the bulk electrodes. It is reported that the hydro-sponge PPy consisting of nano-tubes has very good water absorption property and the water-storage capacity of 65 g g−1.34 In this study, bulk polypyrrole with hydro-sponge performance was successfully fabricated by the straightforward chemical polymerization without any dopant, which exhibited excellent swellability. The hydro-sponge PPy was used as the three-dimensional electrode without any other substrate to investigate its electro-sorption desalination performance.
2. Experimental
2.1. Materials
Pyrrole monomer (Mr = 67.09, 98%) purchased from Qingquan Pharmaceutical & Chemical Ltd (Zhejiang, China) was distilled under vacuum and kept in refrigerator under the protection of nitrogen before use. Ferric chloride hexahydrate(FeCl3·6H2O, Mr = 270.29, 98%), sodium p-toluenesulfonate (pTSNa, C7H7SO3Na, Mr = 194.18, 99%), sodium benzene-sulfonate (BSNa, C6H5SO3Na, Mr = 180.16, 99%), sodium nitrate (NaNO3, Mr = 84.99, 99%) and sodium chloride(NaCl, Mr = 58.44, 99%) and graphite powder (99.83%) were analytical reagent and used as received (Sinopharm Chemical Reagent Co., Ltd, Shanghai, China).
2.2. Preparation of hydro-sponge PPy
The hydro-sponge PPy was synthesized by the chemical method of in situ polymerization. The typical process is as follows: pyrrole monomer (10 mmol) was mixed with 30 ml deionized water and kept magnetic stirring for 60 min to ensure uniform mixture. Then, 30 ml FeCl3 aqueous solution (1.0 M), as oxidizing agent, was added dropwise into the mixture in 2 hours. The mixture solution was then stayed without any agitation for another 24 h at ambient temperature. The as prepared PPy, which is sponge-like in appearance, was immersed in a large amount of deionized water at least for a week to remove the oligomers of pyrrole and initiators. The deionized water was changed every 12 hours.
Since FeCl3 was used as the oxidant during the synthesis, the counter ion Cl− entered into the PPy matrix as dopant, therefore, this was denoted as PPy/Cl−. pTSNa, BSNa and NaNO3 were also employed as the dopant. To prepare the hydro-sponge PPy doped with pTS−, BS− and NO3−, the dopant was dissolved in deionized water firstly. And the subsequent process was similar with the synthesis of PPy/Cl− and FeCl3 was also used as the oxidant in the synthesis process. Because of sodium salt was used as the dopant, the hydro-sponge PPy was immersed in HCl (1.0 mol L−1) solution for 60 min to remove Na− from the as-prepared PPy after static synthesized for 24 h. Finally, large amount of deionized water was used to equilibrate the hydro-sponge PPy to the neutral state. The hydro-sponge PPy doped with pTS−, BS− or NO3− with different molar ratios(3![[thin space (1/6-em)]](https://www.rsc.org/images/entities/char_2009.gif) :1, 2:1, 1:1, 1:2, 1:3) of pyrrole monomer and various dopants (pTSNa, BSNa and NaNO3) were denoted as PPy/A−(3:1), PPy/A−(2:1), PPy/A−(1:1), PPy/A−(1:2), PPy/A−(1:3), respectively. Here, the A− could be pTS−, BS− or NO3−.
:1, 2:1, 1:1, 1:2, 1:3) of pyrrole monomer and various dopants (pTSNa, BSNa and NaNO3) were denoted as PPy/A−(3:1), PPy/A−(2:1), PPy/A−(1:1), PPy/A−(1:2), PPy/A−(1:3), respectively. Here, the A− could be pTS−, BS− or NO3−.
2.3. Preparation of PPy carbon paste electrodes
To examine the electrochemical properties of the as-prepared hydro-sponge PPy, the PPy carbon paste electrodes were prepared. For this purpose, the as-prepared hydro-sponge PPy/A−, graphite powder and paraffin were placed in a mortar with ratio of 10:60:30 (w/w) and milled for 30 min to thoroughly mix. The mixtures were then inserted into the glass tubes with 4 mm in diameter, using the copper wire to make the electrical connection. The surface of the resulting paste electrodes was smoothed by a weighing paper.
The carbon paste electrode without PPy/A− as the control material was also prepared by the same method except without PPy/A− materials added in the preparation process.
2.4. Characterization and measurements
The morphologies were characterized by the field emission scanning electron microscopy (FESEM, JSM-6700F, Japan). FT-IR spectra of the dried samples were obtained on a Bruker, TENSOR37 infrared spectrometer with KBr pellets. The specific surface area (SBET) was measured at 77 K using the Builder SSA-4200 instrument (Beijing, China). The electrochemical activity of the as-prepared PPy was recorded with a LK3200-type electrochemical potentiostat (Tianjin LANLIKE Chemistry Electronic Technology CO., Ltd) using a three-electrode system. The hydro-sponge PPy was prepared into carbon paste electrode as the working electrode, the Pt electrode as the counter electrode and the Ag/AgCl electrode as the reference, NaCl solution (1000 mg L−1) was as the electrolysis. The concentration of Na+ in solution was measured by the Na+ selective electrode (6810, Rex) which was connected to a pH meter (PHS-3C, Rex, Shanghai INESA Scientific Instrument CO., Ltd).
2.5. Measurement of swellability
As shown in Fig. 1, the swellability of hydro-sponge PPy was measured by recording the heights of the hydro-sponge PPy in sopping and dehydration states, respectively. The swellability of the PPy was calculated according to the following equation:| |
 | (1) |
 |
| | Fig. 1 Macroscopic appearance of hydro-sponge PPy in sopping and dehydration states. | |
2.6. Measurement of the ratio of the desalination
The electro-sorption performance for Na+ was carried out using the system shown in Fig. 2. In the experiment, the pristine hydro-sponge PPy/A− (not the carbon paste electrode) was directly served as the working electrode, connected to the power supply by a platinum wire. The graphite electrode was used as the counter electrode. The aqueous solution with different concentrations of Na+ flew into the reaction vessel from the bottom and flew out from the upper part. The Na+ ions were adsorbed in the reaction vessel by the hydro-sponge PPy electrode under the electro-sorption condition. The potential of was 2.0 V and the electro-sorption process lasted 60 min, then measure the Na+ concentration of the solution. The removal efficiency of the Na+ was calculated according to eqn (2):| |
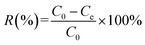 | (2) |
where R is the removal efficiency; C0 (mg L−1) is the initial Na+ concentration; Ce (mg L−1) is the Na+ concentration after treatment.
 |
| | Fig. 2 Flow chart of the electro-sorption system. | |
When the electro-sorption of the hydro-sponge PPy electrode reaches saturation, then the hydro-sponge PPy connected to the positive pole of the power and the graphite connected to the negative pole with the deionized water instead of Na+ solution to investigate the desorption property of the PPy samples. The desorption process lasted for 60 min with the potential of 2.0 V to insure the complete desorption. The ratio of desorption was calculated according to eqn (3):
| |
 | (3) |
where
R′ is the desorption ratio;
Cwe (mg L
−1) is the Na
+ concentration of the deionized water after desorption equilibrium;
Cwo (mg L
−1) is the initial Na
+ concentration of the deionized water;
V (L) is the volume of the deionized water used as the desorption solution;
m (g) is the mass of hydro-sponge PPy electrode;
Qe (mg g
−1) is the specific electro-sorption capacity of hydro-sponge PPy in equilibrium state.
Qe was calculated by
eqn (4):
| |
 | (4) |
where
R (%) is removal efficiency of the Na
+;
V (L) is the volume of the Na
+ solution used at the electro-sorption process;
C0 (mg L
−1) is the initial Na
+ concentration;
m (g) is the mass of hydro-sponge PPy material.
3. Results and discussion
3.1. Swellability of as-prepared PPy
The swellability of the as-prepared PPy/A− was carried out by calculating the expansion ratio of synthesized polypyrrole samples during the sopping up/dehydration for 10 cycles. The data in Table 1 shows the swellability of PPy/Cl− sample. The PPy/A− with different molar ratios of Py and A−(A – represents pTS−, BS− or NO3−) were also studied (see Table S1†).
Table 1 Expansion ratio of PPy/Cl− for 10 sopping up/dehydration cycles
| Cycle |
1 |
2 |
3 |
4 |
5 |
6 |
7 |
8 |
9 |
10 |
| Expansion ratio |
1.17 |
1.15 |
1.15 |
1.13 |
1.13 |
1.13 |
1.13 |
1.13 |
1.11 |
1.09 |
As observed, the expansion ratios of PPy/A− with different anions exhibit the similar tendency. It declines slightly as the sopping up/dehydration cycles going on. Still, all values maintain above 1.0 all the time. The data illustrate that PPy/A− possess constant expansion performance during the experiment process. All the expansion values are in the range between 1.03 and 1.38, which suggests that the hydro-sponge PPy doped with different anions might have good adsorption performance for the electro-sorption process.
The morphologies of the hydro-sponge PPy/Cl− before and after 10 sopping up/dehydration cycles are shown in Fig. 3. It can be seen that the morphologies of PPy/Cl− are both cauliflower-like particles before and after the sopping up/dehydration cycles, which means the structure of the as-prepared PPy/Cl− maintains intact after the operation. However, the hydro-sponge PPy/Cl− appears plump before the dehydration and wizened a little after the dehydration. This may be respect that the water loss in the dehydration and the sopping up in the inverse process of hydro-sponge PPy/Cl− and the microstructure of the hydro-sponge PPy/Cl− is not broken in the sopping up/dehydration cycles. The same phenomena also displayed in other PPy/A− (A− represents pTS−, BS− or NO3−). There was literature34 about PPy with sponge performance. The microstructure of PPy was the symbiotic state of fibers and particles. And the contents of particles controlled the swell–shrink performance. In this work, the microstructures of all PPy samples appear pure particles, which also had a well sponge performance. The swell–shrink process could be repeated 10 times at least.
 |
| | Fig. 3 SEM images of hydro-sponge PPy/Cl− before (a) and after (b) 10 sopping up/dehydration cycles. | |
3.2. FT-IR spectroscopy analysis
The FT-IR spectroscopy analysis was employed to examine the structure of the as-prepared PPy samples (Fig. 4). In the FT-IR spectra, the absorptions centered at 1541 and 1462 cm−1 correspond to the C–C and C–N vibration in pyrrole rings; the peaks at 1298, 1180 and 1039 cm−1 can be attributed to the C–H in-plane stretch vibration. The peak at 963 ascribed to the C–C out-of-plane bending vibration, while other bands at 910 and 787 cm−1 are C–H out-of-plane deformation.35–37 In the FT-IR spectra, the profiles of the sample curves are similar with each other except PPy/NO3−. The excessive peaks at 1705 and 1383 cm−1 attributed to the N–O asymmetric stretch and symmetric stretch were observed in the FT-IR spectrum of PPy/NO3−, indicating that PPy was doped by NO3−.38 Meanwhile, there are no distinct peaks for the existence of pTS− and BS− in the FT-IR spectra of PPy/pTS− and PPy/BS−. This phenomenon is from the reasons as follows: firstly, a large amount of the HCl solution and a large amount of deionized water washing removes the pTS− and BS− from PPy more easily than NO3−; secondly, the characteristic absorption peaks for pTS− and BS− are not distinguished from that of PPy. However, the obvious characteristic peaks of PPy here confirmed the polymerization of pyrrole and the similar backbone of each PPy samples.39 Combining to the synthesis process, the as-prepared PPy samples show typical cauliflower morphologies except the different size (please see the SEM images).
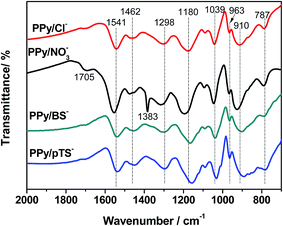 |
| | Fig. 4 FT-IR spectra of PPy/A− samples. | |
3.3. BET measurement
The specific surface area of materials has dramatic influence on the adsorption performance. Therefore, the specific surface area of various PPy/A− samples was studied. As shown in Table 2, changing the doping quantity greatly influences the specific surface area of PPy/A−. Among all samples, PPy doped with nitrate ions has larger specific surface area than the PPy doped with sulfonate ions. The maximum specific surface area of 9.02 m2 g−1 is obtained on PPy/NO3− with molar ratio of 1:3, which is nearly twice higher than that of PPy/Cl−. In contrast, the surface area of PPy/pTS− (1:1) is quite small for only 1.09 m2 g−1, which is consistent with the small grain diameter shown in the SEM images (Fig. S1–S3†). This may be ascribed to the close attachment between these small-size particles. As speculated, the porosity of the accumulated structure may be affected, rendering the small BET value.
Table 2 Specific surface areas of PPy/A− doped with different counter-ions
| Samples |
Specific surface area (m2 g−1) |
| Py:dopant |
Uncertainty |
3:1 |
2:1 |
1:1 |
1:2 |
1:3 |
| PPy/Cl− |
4.43 |
— |
— |
— |
— |
— |
| PPy/pTS− |
— |
2.34 |
5.15 |
1.09 |
3.75 |
5.37 |
| PPy/BS− |
— |
2.86 |
5.03 |
6.03 |
7.61 |
8.17 |
| PPy/NO3− |
— |
7.78 |
0.60 |
7.69 |
8.40 |
9.02 |
3.4. Electrical properties of PPy samples
The cyclic voltammetry(CV) curves of different PPy/A− carbon paste electrodes are shown in Fig. 5. To compare the variety of the electrochemical performance of the same PPy/A− with various molar ratios, the CV curves of the PPy/A− with different molar ratios of pyrrole monomer and A− (pTS−, BS−, NO3−) in the synthetic process are also given (see Fig. S4†). From the CV curves, it can be seen that the area surrounded by the CV curves of PPy/pTS−(2:1), PPy/BS−(1:2) and PPy/NO3−(1:1) are larger than that of the PPy doped with the same anion in other ratios (Fig. S4†), and it is also larger than that of the as-prepared PPy/Cl−. Meanwhile, the specific capacitances of the carbon paste electrodes with or without the PPy/A− materials were also computed according to the CV curves. And the values are 2.41 F g−1 for carbon paste electrode without PPy/A−, 13.96 F g−1 for carbon paste electrode with PPy/Cl−, 25.34 F g−1 with PPy/NO3−, 37.23 F g−1 with PPy/BS−, and 48.56 F g−1 with PPy/pTS−, respectively. To compare with the electrodes with PPy/A−, the specific capacitance of carbon paste electrode without PPy/A− is so small that it can be neglected in the further experiments. In theory, larger area means better electrochemical performance and better capacitance performance, which is in favor of the electro-sorption for the electrochemical switchable ion exchange (ESIS).14 So the PPy/pTS−(2:1), PPy/BS−(1:2) and PPy/NO3−(1:1) are selected to examine the electro-sorption properties of PPy doped with various anions in the following section.
 |
| | Fig. 5 CV curves of different carbon paste electrodes with or without PPy/A− (electrolysis: 1000 mg L−1; scan rate: 100 mV s−1). | |
On the other hand, PPy/pTS−(2:1) and PPy/BS−(1:2) have different patterns with PPy/NO3−(1:1) and PPy/Cl−. There is a tiny reduction peak appearing at −0.25 V vs. Ag/AgCl in the CV curves of PPy/pTS−(2:1) and PPy/BS−(1:2). Generally speaking, the cyclic voltammogram of polypyrrole could have 4 peaks, representing cation ejection, anion insertion, cation insertion and anion ejection, respectively.40 According to literatures, the reduction peak at −0.25 V vs. Ag/AgCl corresponds to the cation insertion process, which can be represented by the following formula:24
| | |
(PPy)0n(PPy)+nA− + C+ + e → (PPy)02nA−C+
| (5) |
This phenomenon can be analyzed from the fact that BS− and pTS− both possess the similar structure that belongs to the aromatic sulfonate series. Therefore, PPy/pTS−(2:1) and PPy/BS−(1:2) have the cation exchange performance. However, PPy/NO3− samples do not exhibit the peak relating to the cation insertion process, which indicates that they have the same electrochemical activity with that of PPy/Cl−. They display the electric double layer capacitance performance, and the electro-sorption of cations would be different from that of PPy/pTS−(2:1) and PPy/BS−(1:2).
3.5. PPy/A− electrodes used in the electro-adsorption/desorption
3.5.1. Influence of Na+ concentration. Considering the details of the electro-sorption and energy consumption in this study, the desalination experiment was carried out at the voltage of 2.0 V in a 40 ml reaction vessel at room temperature. The PPy/Cl− sample was chosen as the working electrode to examine the influence of the original Na+ concentration on the electro-sorption performance. Five Na+ concentrations were chosen, namely 200 mg L−1, 500 mg L−1, 1000 mg L−1, 2000 mg L−1 and 35000 mg L−1, and the results are shown in Table 3.
Table 3 Specific electro-sorption capacity of PPy/Cl− electrode in different Na+ concentrations
| |
Concentration experiment (operating voltage: 2.0 V operating time: 60 min) |
| Initial concentration of Na+ (mg L−1) |
200 |
500 |
1000 |
2000 |
35000 |
| PPy/Cl− |
The removal efficiency of Na+ (%) |
27.38 |
26.37 |
20.61 |
20.84 |
32.55 |
| Specific electrosorption capacity (mg(Na+)/g(PPy/Cl−)) |
4.58 |
10.99 |
17.18 |
34.74 |
949.45 |
As observed, although the removal efficiency of Na+ decline, the adsorption quantity of Na+ into the as-prepared PPy materials gradually rises along with the increase of initial Na+ concentration during one hour in the concentration range of 200–2000 mg L−1. With the Na+ concentration further increasing to 35000 mg L−1, the number of ions in the solution greatly enhances, which indicates that the current efficiency of the electrode system is promoted under the same voltage. Therefore, better removal efficiency (32.55%) and specific electro-sorption capacity of 949.45 mg g−1 under the high Na+ concentration is achieved.
The reason why Na+ concentration of 35000 mg L−1 was chosen is that is the standard Na+ concentration of sea water according to the literatures.41 For practical consideration, this value was included to examine the adsorption effect of PPy electrode for salt water with high concentrations. A high specific electro-sorption capacity of 949.45 mg g−1 was obtained in one hour, which suggests that this kind of PPy material with a great saturated electro-sorption capacity can be adapted to the desalination of high salt concentration solution.
3.5.2. Influence of reaction time. The Na+ concentration of 1000 mg L−1 was chosen to examine the effect of contact time on adsorption performance. Along with the operation going on, both the adsorption capacity and desorption capability increases. The adsorption rate tends to be stable in 3 hours at 2.0 V, while desorption rate reaches a stable value of 50% in 2 hours in desorption experiments (Fig. 6).
 |
| | Fig. 6 Influence of time on the adsorption/desorption ratio of PPy/Cl−. | |
3.5.3. Influence of counter ions on the desalination. In this section, the hydro-sponge PPy doped with pTS−, BS− and NO3− as working electrodes were used to remove Na+ from the solution (1000 mg L−1) by electro-sorption. The adsorption removal ratios of PPy/A− with various pyrrole and dopant ratios are shown in Fig. 7. The adsorption removal behavior of the hydro-sponge PPy electrodes with different dopants is clearly different from each other. Meanwhile, the adsorption removal behavior of the hydro-sponge PPy/A− with different ratios of the same counter ion is also different. Among all the samples, PPy/pTS− exhibits better adsorption removal efficiency in all ratios of the dopant.
 |
| | Fig. 7 Desalination efficiency of (a) PPy/pTS−, (b) PPy/BS−, (c) PPy/NO3− electrodes in different doping ratios; other operation conditions: Na+ concentration of 1000 mg L−1; voltage at 2.0 V; adsorption time for 3.0 h. | |
On the other hand, the PPy/A−(pTS−, BS−, NO3−) with the optimal doping ratio, which has the best adsorption removal behavior towards Na+, is also discrepant. The optimal doping ratio is 2:1 for PPy/pTS−, 1:2 for PPy/BS− and 1:1 for PPy/NO3−, and the best removal efficiencies are 33.04%, 30.56% and 31.75%, respectively. According to eqn (4), the specific electro-sorption capacities were computed as 27.53, 25.47 and 26.46 mg g−1, which are higher than that of PPy/Cl− in the same concentration of Na+ solution. While the specific electro-sorption capacity of these three materials for the high Na+ concentration solution (35000 mg L−1) are 1148.29, 1102.79 and 1108.92 mg g−1, respectively. This phenomenon indicates that the doping ions have disparate effect on PPy, which leads to the differences of electrochemical activity and microstructure. As a result, the optimal doping ratio of PPy/A− differs according to different counter ions.
3.6. Stability of desalination
The reusing and desorption properties of the hydro-sponge PPy/A− electrodes were also studied to confirm the stability of this type of electrode as shown in Fig. 8. The adsorption rates of the electrodes decline dramatically from 30% to around 13% in the first 3 cycles. The adsorption rates decline slightly after reusing for 3 times. Comparing the data, it is found that PPy samples doped with pTS− and BS− have better stability than that of the PPy doped with Cl− and NO3−.
 |
| | Fig. 8 Adsorption rate of PPy/A− in the cycle experiments. | |
This is because that the ion exchange behavior of PPy in electrochemical process is associated with the size of the doped ions. The pTS− and BS− ions belong to medium size ions,28 and Cl− and NO3− ions are smaller ones.24,25 Therefore, the desalination performance of the PPy/A− is different due to the size of the dopants. This is because physical-sorption also plays a role in the former processes. After a few cycles, the sites of physical adsorption tend to be saturated.
3.7. Comparison of physical-adsorption and electro-adsorption
It is speculated that the physical-sorption is inevitable to contribute to the adsorption capacity in the adsorption process.42 For the hydro-sponge PPy, the ions in water can get fully contact with the electrode surface, and certain amount of water can be stored in the hydro-sponge PPy electrode. However, as shown in Fig. 9, the physical-sorption is not very important in the electro-sorption process. This means that the hydro-sponge PPy/A− prepared in this study has an excellent electrochemical capacitive adsorption property, and the physical-sorption as a kind of irreversible adsorption behavior has slight influence on the adsorption performance.
 |
| | Fig. 9 Comparison of physical-adsorption and electro-adsorption in the experiment. | |
3.8. Comparison of static-state adsorption and flowing-state adsorption
The electro-sorption behavior of the PPy/A− electrodes in the static state and flowing state were investigated to compare the adsorption performance in different conditions, shown in Fig. 10. There is no significant difference for the adsorption quantity of Na+ on the PPy/A− electrodes during three hours operation. The adsorption quantity of Na+ on PPy/pTS, PPy/BS− and PPy/NO3− was 26.97 mg g−1, 25.57 mg g−1 and 22.93 mg g−1 in the static desalination, while 28.58 mg g−1, 27.66 mg g−1 and 26.3 mg g−1 in flowing state. The slightly larger adsorption quantity in the flowing condition than that of static condition may result from the efficient mass transfer in the flowing condition. But the adsorption capacity of the hydro-sponge PPy/A− electrodes was not significantly influenced by the contact way of the solution and the electrode.
 |
| | Fig. 10 The adsorption capacity of PPy/A− electrodes in static state and flow state. | |
However, as observed in Fig. 11, the desorption performance of the hydro-sponge PPy/A− electrodes in the static state and flowing state are dramatically different. The desorption rates of the PPy electrodes doped with different anions are 27.94%, 42.74% and 48.29% in static conditions. But in the flowing state, all desorption rates of the PPy electrodes doped with different anions are 100%. That means Na+ ions are completely removed off, which indicates that the flowing state plays positive effect on the desorption process in this study. This phenomenon would be more beneficial for the cyclic utilization of the electrode.
 |
| | Fig. 11 Desorption rates of PPy/A− electrodes in static state and flow state. | |
4. Conclusions
Without any templates and cross-linker, the hydro-sponge PPy with great swell–shrink properties were synthesized through the chemical polymerization using FeCl3 as oxidant. After the swell-shrink cycling process for ten times, the PPy/Cl−, PPy/pTS−, PPy/BS− and PPy/NO3− samples all exhibited excellent sponge properties. SEM images demonstrated that the micro morphology of polypyrrole remained the same after several swell–shrink cycles. Although the as-prepared polypyrrole samples showed the granular structure, their structures still possess certain self-supporting ability. In the desalination of sodium ions in the electro-sorption experiment, the Na+ removal efficiency of PPy/Cl−, PPy/pTS−, PPy/BS− and PPy/NO3− electrodes from aqueous solution were investigated. The results indicated that the PPy/pTS− (molar ratio of 2:1) demonstrated the best electro-sorption effect of sodium ions with specific electro-sorption capacity reaching at 27.53 mg g−1 in 1000 mg L−1 of Na+ solution and 1148.29 mg g−1 in 35000 mg L−1 of Na+ solution, which was higher than other synthesized PPy materials. Flow state situation brings about a significant impact on the regenerative efficiency of PPy. Under this circumstances, desorption ratio can reach 100%, so the flow condition is more beneficial for reuse of this kind of electrode.
Acknowledgements
The authors gratefully acknowledge the financial support from the National Natural Science Foundation of China (Grant No. 21307098), the Fundamental Research Funds for the Central Universities of China and China Postdoctoral Science Foundation (2013M532053).
References
- R. T. Mayes, C. Tsouris, J. O. Kiggans, S. M. Mahurin, D. W. DePaoli and S. Dai, J. Mater. Chem., 2010, 20, 8674–8678 RSC.
- Y. J. Zhang, Y. Wang, S. C. Xu, J. X. Wang, Z. Wang and S. C. Wang, Synth. Met., 2010, 160, 1392–1396 CrossRef CAS PubMed.
- J. S. Im, J. G. Kim and Y. S. Lee, J. Nanosci. Nanotechnol., 2014, 14, 2268–2273 CrossRef CAS PubMed.
- K. Sharma, R. T. Mayes, J. O. Kiggans, S. Yiacoumi, J. Gabitto, D. W. DePaoli, S. Dai and C. Tsouris, Sep. Purif. Technol., 2013, 116, 206–213 CrossRef CAS PubMed.
- L. Pan, X. Wang, Y. Gao, Y. Zhang, Y. Chen and Z. Sun, Desalination, 2009, 244, 139–143 CrossRef CAS PubMed.
- Z. Y. Lin, Z. Li, K. S. Moon, Y. N. Fang, Y. G. Yao, L. Y. Li and C. P. Wong, Carbon, 2013, 63, 547–553 CrossRef CAS PubMed.
- H. J. Yin, S. L. Zhao, J. W. Wan, H. J. Tang, L. Chang, L. C. He, H. J. Zhao, Y. Gao and Z. Y. Tang, Adv. Mater., 2013, 25, 6270–6276 CrossRef CAS PubMed.
- S. Porada, L. Borchardt, M. Oschatz, M. Bryjak, J. S. Atchison, K. J. Keesman, S. Kaskel, P. M. Biesheuvel and V. Presser, Energy Environ. Sci., 2013, 6, 3700–3712 CAS.
- Z. Peng, D. S. Zhang, T. T. Yan, J. P. Zhang and L. Y. Shi, Appl. Surf. Sci., 2013, 282, 965–973 CrossRef CAS PubMed.
- Y. Wimalasiri and L. D. Zou, Carbon, 2013, 59, 464–471 CrossRef CAS PubMed.
- C. J. Yan, L. D. Zou and R. Short, Desalination, 2012, 290, 125–129 CrossRef CAS PubMed.
- C. J. Yan, L. D. Zou and R. SHort, Desalination, 2014, 333, 101–106 CrossRef CAS PubMed.
- Q. Liu, Y. Wang, Y. J. Zhang, S. C. Xu and J. X. Wang, Synth. Met., 2012, 162, 655–661 CrossRef CAS PubMed.
- C. Weidlich, K. M. Mangold and K. Jüttner, Electrochim. Acta, 2005, 50, 5247–5254 CrossRef CAS PubMed.
- C. Weidlich, K. M. Mangold and K. Jüttner, Electrochim. Acta, 2005, 50, 1547–1552 CrossRef CAS PubMed.
- I. S. Chronakis, S. Grapenson and A. Jakob, Polymer, 2006, 47, 1597–1603 CrossRef CAS PubMed.
- Y. S. Yang, J. Liu and M. X. Wang, Nanotechnology, 2002, 13, 771–773 CrossRef CAS.
- R. A. Davoglio, S. R. Biaggio, R. C. Romeu-Filho and N. Bocchi, J. Power Sources, 2010, 195, 2924–2927 CrossRef CAS PubMed.
- M. Yamaura, K. Sato and T. Hagiwara, Synth. Met., 1990, 39, 43–60 CrossRef CAS.
- M. Yamaura, K. Sato, T. Hagiwara and K. Iwata, Synth. Met., 1992, 48, 337–354 CrossRef CAS.
- D. Y. Kim, J. Y. Lee, C. Y. Kim, E. T. Kang and K. L. Tan, Synth. Met., 1995, 72, 243–248 CrossRef CAS.
- K. Idla, A. Talo, H. E. M. Niemi, O. Forsen and S. Ylasaari, Surf. Interface Anal., 1997, 25, 837–854 CrossRef CAS.
- A. Michalska and K. Maksymiuk, Microchim. Acta, 2003, 143, 163–175 CrossRef CAS.
- S. Li, Y. B. Qiu and X. P. Guo, J. Appl. Polym. Sci., 2009, 114, 2307–2314 CrossRef CAS PubMed.
- Y. H. Lin, X. L. Cui and J. Bontha, Environ. Sci. Technol., 2006, 40, 4004–4009 CrossRef CAS.
- R. C. D. Peres and M. A. D. Paoli, Synth. Met., 1992, 48, 259–270 CrossRef CAS.
- M. N. Akieh, W. E. Price, J. Bobacka, A. Ivaska and S. F. Ralph, Synth. Met., 2009, 159, 2590–2598 CrossRef CAS PubMed.
- R. A. Khalkhali, W. E. Price and G. G. Wallace, React. Funct. Polym., 2003, 56, 141–146 CrossRef.
- T. Shimidzu, A. Ohtani, T. Iyoda and K. Honda, J. Electroanal. Chem., 1987, 224, 123–135 CrossRef CAS.
- M. K. Song, Y. T. Kim, B. S. Kim, J. Kim, K. Char and H. W. Rhee, Synth. Met., 2004, 141, 315–319 CrossRef CAS PubMed.
- X. M. Yang, T. Y. Dai, Z. X. Zhu and Y. Lu, Polymer, 2007, 48, 4021–4027 CrossRef CAS PubMed.
- J. Jang and H. Yoon, Chem. Commun., 2003, 720–721 RSC.
- X. Zhang, R. Bai and T. W. Tong, Sep. Purif. Technol., 2006, 52, 161–169 CrossRef CAS PubMed.
- T. Y. Dai and Y. Lu, J. Mater. Chem., 2007, 17, 4797–4802 RSC.
- J. Han, W. Yan and Y. B. Xu, Chem. Lett., 2006, 35, 306–307 CrossRef CAS.
- C. Saravanan, R. C. Shekhar and S. Palaniappan, Macromol. Chem. Phys., 2006, 207, 342–348 CrossRef CAS PubMed.
- H. Zhang, X. Zhong, J. J. Xu and H. Y. Chen, Langmuir, 2008, 24, 13748–13752 CrossRef CAS PubMed.
- P. C. Gómez, O. Gálvez, R. G. Mosteo, C. Puzzarinid and R. Escribano, Phys. Chem. Chem. Phys., 2010, 12, 4617–4624 RSC.
- H. S. Kim, D. H. Park, Y. B. Lee, D. C. Kim, H. J. Kim, J. Kim and J. Joo, Synth. Met., 2007, 157, 910–913 CrossRef CAS PubMed.
- Y. J. Yuan, S. B. Adeloju and G. G. Wallace, Eur. Polym. J., 1999, 35, 1761–1772 CrossRef CAS.
- Y. Oren, Desalination, 2008, 228, 10–29 CrossRef CAS PubMed.
- Z. Adamczyk and P. Warszynski, Adv. Colloid Interface Sci., 1996, 63, 141–149 CrossRef.
Footnote |
| † Electronic supplementary information (ESI) available. See DOI: 10.1039/c5ra09062h |
|
| This journal is © The Royal Society of Chemistry 2015 |
Click here to see how this site uses Cookies. View our privacy policy here. 


