DOI:
10.1039/C5RA08946H
(Paper)
RSC Adv., 2015,
5, 61455-61464
Pretreatment of miscanthus using 1,3-dimethyl-imidazolium methyl phosphonate (DMIMMPh) ionic liquid for glucose recovery and ethanol production†
Received
13th May 2015
, Accepted 10th July 2015
First published on 10th July 2015
Abstract
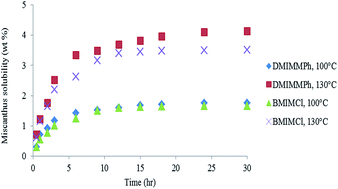
An environmentally friendly method for the extraction of cellulose from miscanthus using 1,3-dimethyl-imidazolium methyl phosphonate (DMIMMPh) ionic liquid is described. The parameters affecting the extraction process are temperature and time. Extraction results were evaluated using a Box–Behnken Design. The pretreatment of miscanthus with ionic liquids resulted in the regeneration of amorphous, porous cellulose almost free of lignin, which is suitable for enzymatic hydrolysis and fermentation processes. The regenerated cellulose can be hydrolyzed efficiently into glucose using cellulase enzyme with glucose hydrolysis efficiency exceeding 93%. The hydrolysate is converted into ethanol with fermentation using Saccharomyces cerevisaie yeast with an ethanol conversion rate reaching up to 85%. A successful ethanol production was obtained with an overall ethanol yield reaching up to 148 g ethanol kg−1 miscanthus. This indicates the high performance of DMIMMPh ionic liquid in converting biomass feedstocks into ethanol.
1. Introduction
Biomass is a sustainable resource which has an obvious potential as a renewable starting material for the production of fuel-grade ethanol and materials according to the biorefinery philosophy.1,2 The pretreatment process is considered to be a major unit operation in a biorefinery to convert lignocellulosic biomass into bioethanol, which accounts for 16–19% of its total capital.3,4 Bioethanol production from cellulosic materials mainly consists of three steps: the first step is the pretreatment of lignocellulose to enhance the enzymatic digestibility of polysaccharide components; the second step is the hydrolysis of cellulose and hemicellulose to fermentable sugars; and the third step is the fermentation of these sugars into liquid fuels.5,6
Among biomass feedstocks, miscanthus has attracted considerable attention as a possible dedicated energy crop. Indeed, miscanthus could be an interesting raw material for industrial bioconversion processes, as its carbohydrate content reaches up to 75%.7,8
Different technologies have been reported for the pretreatment of lignocellulosic biomass such as one-step extrusion/sodium hydroxide,9 ammonia fiber expansion,10 dilute acid pre-soaking combined with wet explosion,11 sodium chlorite,12 ethanol organosolv process,7 a procedure using a mixture of acetic acid/hydrochloric acid or formic acid/hydrochloric acid,13 and soaking in aqueous ammonia.14 These technologies give good results concerning the sugar conversion, while a full recovery of the lignocellulosic components should be one of the major goals of optimizing the conversion of biomass to ethanol.
Recently, the performance of ionic liquids (ILs) has been evaluated in biomass pretreatment and extraction processes.15–19 The most commonly used ionic liquids for this application are 1-butyl-3-methylimidazolium chloride (BMIMCl), and 1-ethyl-3-methylimidazolium acetate (EMIMOAc).2,20,22 These solvents can dissolve biomass by disrupting the native cellulose crystalline structure and breaking the complex network of noncovalent interactions between cellulose and lignin.19
Indeed, a small number of studies has been published on the ionic liquid-pretreatment, enzymatic hydrolysis and fermentation of miscanthus. K. Shill et al., 2010,20 studied the solubility of miscanthus in EMIMAOC ionic liquid. The lignin was partially removed and the hydrolysis conversion rate reached up to 100% at time 44 h and temperature 343 K using a 40 wt% K3PO4 solution as an anti-solvent. S. Padmanabhan et al., 2011,21 found that acetate, chloride and phosphate based ionic liquids could dissolve miscanthus up to 5%.22 More recently, Husson23 et al. and Auxenfans et al.24,25 demonstrated that methylphosphonate-based ILs could be successful candidates to pretreat efficiently lignocellulosic biomass. Recently, dimethyl sulfoxide (DMSO) was used as a co-solvent during the extraction of cellulose from biomass using ILs in order to reduce the viscosity of the mixtures.26 This treatment does not affect the dissolution of native lignin in miscanthus and facilitates considerably its study and analysis.27
There is a still a lack of data in the literature concerning the fermentation of the pretreated cellulose with ionic liquids. This study is necessary in order to demonstrate the efficiency of the IL-pretreatment for biofuel production compared to other pretreatments.
The goal of this study is to evaluate the pretreatment of miscanthus using 1,3-dimethyl-imidazolium methyl phosphonate (DMIMMPh) and to compare this solvent with BMIMCl commonly used in the literature. A Box–Behnken experimental design was applied to evaluate the best conditions for the extraction of cellulose from miscanthus. A characterization study was performed to evaluate the efficiency of the produced cellulose to be used for biofuel production. The produced amorphous cellulose is subjected to hydrolysis and fermentation for biofuel production. Hydrolysis yield and ethanol conversion rate were estimated in order to evaluate the processes.
2. Methods
2.1. Materials and miscanthus preparation
Miscanthus x Gigantus (MxG) was harvested in spring 2009 at a local site from Courcelles-Chaussy (France). The dried miscanthus was milled using a Wiley mill and screened to a particle size below 0.2 mm. Ash and extractables were removed from miscanthus via the treatment with water for 5 minutes at temperature 110 °C. Then, miscanthus was dried in an oven at 110 °C for 2 days. The oven-dried samples were stored in a dessicator to avoid moisture.
Ethyl alcohol absolute was from Carlo Erba. Acetonitrile was from Sigma-Aldrich. Ethylene diamine (EDA) and ethylene glycol (EG) were purchased from Fluka. Dimethyl sulfoxide (DMSO) was purchased from Fisher Scientific. The ionic liquids used in this work, 1-butyl-3-methylimidazolium chloride (BMIMCl), 1-ethanol-3- methylimidazolium chloride (EtOHMIMCl) and 1,3-dimethyl-imidazolium methyl phosphonate (DMIMMPh), were from Solvionic, and 1-ethyl-3-methylimidazolium thiocyanate (EMIMSCN) was from Sigma-Aldrich. These ionic liquids were dried under high vacuum for 3 hours at 70 °C before use.
Cellulase enzymes: cellulases from T. reesei and β-glucosidase were purchased from Sigma Aldrich. T. K. Ghose, 1987,28 has reported the activity of the cellulases to be 800 EGU g−1, and of β-glucosidase to be 258 CBU g−1.
2.2. Miscanthus dissolution
Solid–liquid equilibrium phase diagrams of the {miscanthus + IL} systems were obtained at atmospheric pressure and at temperature ranging from 90 °C to 130 °C. A desired amount of IL and miscanthus were loaded into a prepared jacketed glass cell. The cell was sealed and connected to the temperature controller. The mixture was vigorously stirred at desired temperatures. A dark viscous miscanthus suspension was obtained. The solution was centrifuged to determine if any solid residues remained. The solubility measurements were confirmed by the visual observation of the solution under microscope. The miscanthus dissolution was calculated according to eqn (1).
2.3. Cellulose extraction and residue separation
For the extraction of cellulose, dimethyl sulfoxide (DMSO) was added to ILs (20
:
80 wt%) to form a clear solution by stirring. A 3 wt% miscanthus was dissolved in IL/DMSO solution, after dissolution, the suspension was filtered through a glass filter to remove the undissolved residue. Water was added to the resulting clear liquors (80
:
20 wt%) respectively and a cellulose-rich extract was reconstituted from the liquor. This extract and the undissolved residue were respectively washed with water until the IL was completely removed and then dried overnight in an oven at 100 °C prior to use. The miscanthus dissolution rate, the regeneration rate, the recovery of miscanthus components and the mass loss were calculated as following: |
Rdiss (%) = [(Mo − Mr)/Mo] × 100
| (1) |
|
Rreg (%) = (Mex/Mo) × 100
| (2) |
|
Recovery(cell) (%) = [(Mex × Cex-cell)/(Mo × Co-cell)] × 100
| (3) |
|
Mass loss (%) = [Mo − (Mex + Mr + Mlig-ex)] × 100
| (4) |
where Rdiss is the rate of dissolution, Rreg is the rate of regeneration, recovery(cell) is the recovery of cellulose, Mo is the mass of the original miscanthus added, Mr is the mass of residue, Mex is the mass of cellulose-rich extract, Mlig-ex is the lignin-rich extract, Co-cell is the cellulose content in the original miscanthus and Cex-cell is the cellulose content in the extract. The recovery of hemicellulose and lignin were calculated in a similar way to the recovery of cellulose.
2.4. Determination of miscanthus content
2.4.1. Determination of lignin content. The acid-insoluble lignin content in miscanthus was determined according to the laboratory analytical procedure (LAP) provided by the National Renewable Energy Laboratory (NREL).29,30 Firstly, 1.5 mL of a 72% (w/w) H2SO4 solution was added to 0.10 g of miscanthus sample. Hydrolysis was carried out for 2 h in a water bath shaker at 30 °C and 150 rpm. Deionized water was added to dilute the acid to a final concentration of 4% (w/w). Then, second hydrolysis was carried out by autoclaving the reaction mixture at a temperature of 121 °C and pressure at 2 atm during 1 h in an autoclave. The solid residue remained was filtered and dried overnight in an oven to constant weight. The dried residue was placed in a furnace at 550 °C for 2 h to determine the acid-insoluble ash content. The percentage of acid insoluble lignin, Kalson lignin, was calculated and corrected for the ash content. The acid-soluble lignin content was determined from absorbance at 280 nm.20
2.4.2. Determination of cellulose content. Cellulose content was determined using cellulose isolation method as described in Sun et al.31 An acetic/nitric acid reagent consisting of 80% acetic acid and concentrated nitric acid in a ratio of 10
:
1 (v/v) was prepared. A 0.10 g of miscanthus sample was weighed into conical tubes with known weight. Subsequently, 3 mL of acetic/nitric reagent was added into each tube and mixed vigorously. The tubes were capped and heated for 10 min at 110 °C, then temperature is raised to 120 °C for 30 min. The tubes were cooled and 10 mL of deionized water was added. The treatment with acetic/nitric reagent efficiently removed lignin and hemicellulose in the sample, leaving cellulose in the mixture, which was obtained by centrifugation at 4000 rpm for 20 min (Centrifuge 5810, Eppendorf). The residue washed twice with deionized water and centrifuged. Residue was then dried in the tube at 60 °C in an oven during 24 h. Cellulose content in the samples is determined by gravimetric analysis.
2.4.3. Determination of hemicellulose content. The hemicellulose content in the sample was obtained by the difference between the holocellulose and cellulose contents. Therefore, holocellulose, which is the sum of hemicellulose and cellulose in the biomass, was first determined according to the sodium chlorite method reported by Teramoto et al.32 A 0.5 g of the miscanthus sample was treated with 30 mL of deionized water containing 0.04 mL of acetic acid and 0.4 g of sodium chlorite (NaClO2) for 1 h at 75 °C. Then, 0.04 mL of acetic acid and 0.2 g of NaClO2 were added to the mixture every 1 h for 3 h. The residue was filtered, washed with deionized water and acetone, and then dried overnight to constant weight. The solid residue obtained after the reaction with NaClO2 in acetate buffer was weighed and hemicellulose content was determined from the difference between holocellulose and cellulose content.
2.5. Characterization of the regenerated cellulose-rich extract
2.5.1. XRD analysis. X-ray diffraction (XRD) for the untreated miscanthus, cellulose-rich extracts and residues were determined with Cu K alpha radiation at 30 kV and 15 mA. Patterns were recorded in the range of 2θ = 5–80 degree with a scan speed of 1 degree min−1, using a Rigaku MiniFlex II X-ray diffractometer.The crystallinity index, CrI, was estimated using Segal's method33,34 as following:
|
CrI = [(I002 − Iam)/I002] × 100
| (5) |
where
I002 is the highest peak intensity of the crystalline fractions at 2
θ = 22.5 degree;
Iam is the low intensity peak of amorphous region at 2
θ = 18 degree.
2.5.2. NMR analysis. 13C NMR analysis for miscanthus samples was performed on a Bruker Avance-400 spectrometer. Samples were firstly grinded to a size lower than 400 micron. Then, they were packed in 4 mm-diameter zirconium oxide rotors fitted with Kel-F caps for analysis. All spectra were acquired at ambient temperature using a Bruker 4 mm MAS probe.The crystallinity index, CrI, was estimated using Newman's method34,35 as following:
|
CrI = [ACrC/(ACrC + AAmC)] × 100
| (6) |
where
ACrC: the area of the peak at 89 ppm, which assigned to the C
4 crystalline cellulose;
AAmC: the area of the peak at 83 ppm, which assigned to the C
4 amorphous cellulose.
The structures of pure and recycled DMIMMPh were determined by 1H NMR spectroscopy, Bruker Avance 300 apparatus (300, 13 MHz, 298 K) using acetone-d6 as solvent.
2.5.3. FTIR analysis. The IR spectra of the untreated miscanthus, cellulose-rich extracts and residues were determined using an ALPHA Fourier transform IR spectrometer with an OPUS/Mentor software. A small amount of samples, enough to cover the surface of platinum diamond ATR crystal probe was used. Twenty-four scans were acquired for each spectrum.
2.5.4. SEM analysis. SEM images were obtained using a JSM6700F scanning electron microscope. Samples were fixed to a metal-base specimen holder using double-sided adhesive tape, coated with Au/Pd and observed at 20 kV accelerating voltage.
2.6. Enzymatic hydrolysis process
The miscanthus and cellulose-rich extract samples were placed in a 100 mL volumetric flask with additional citrate buffer (50 mM pH 4.8). Celluclast was added at a loading of 20 FPU g−1 of cellulose for each reaction. Subsequently, β-glucosidase was added at a 1
:
1 volume ratio of celluclast. The enzymatic hydrolysis was conducted at 50 °C with shaking at 250 rpm in an incubating orbital shaker. Samples, (0.5–2 mL), were removed and analyzed by HPLC for glucose concentration. Reactions were run in duplicate, with samples taken from each reactor and run twice on the HPLC.
An HPLC (SHIMADZU, USA) with a SHODEX Asahipak NH2-50 4E column (Shodex, Japan) and a differential refractive index detector (SHIMADZU, USA) was employed for analyzing concentrations of carbohydrates in the mixtures. The column oven temperature was 35 °C, the mobile phase was a mixture of acetonitrile and water with a ratio (75
:
25), and the flow rate was 1 mL min−1. The correlation coefficient of the sugars standard curve by the HPLC reached a value of 0.999. The expanded relative uncertainty was estimated at 1.0%. The equilibration temperature was measured with an uncertainty of 0.2 °C.
The hydrolysis efficiency is calculated using the following formula:20
|
 | (7) |
|
 | (8) |
where the value 0.9 in
eqn (7) is referring to [molecular weight of cellulose unit (162.14)/molecular weight of glucose unit (180.16)] and the value 0.88 in
eqn (8) is referring to: [molecular weight of hemicellulose, xylan, unit (132.11)/molecular weight of xylose unit (150.13)].
2.7. Fermentation of the hydrolysates
The produced hydrolysates were fermented using baker's yeast (Yeast from S. cerevisiae, YSC2, Sigma Aldrich). The method described by Yan Lin et al.36 was followed in this study. Ethanol fermentation was performed under anaerobic condition in a 100 mL shake flask at 100 rpm. The 1
:
10 ratio of inoculum: hydrolysate, as the sole carbon source, was used to conduct the fermentation. The experiments were carried out for 7 days under isothermal conditions, at 30 °C and monitored by harvesting samples for glucose and ethanol analyses. Each run was duplicated and the average data was reported. Ethanol concentration was determined using a Brucker 450 gas chromatograph. The GC operating conditions are given in Table S1, ESI.†
3. Results and disscusion
The use of DMIMMPh ionic liquid is investigated in order to evaluate the dissolution of miscanthus and the extraction of cellulose. The influence of different parameters is then evaluated to define the optimum conditions of the extraction process.
3.1. Solubility of miscanthus in ionic liquids
ILs are capable of dissolving complex macromolecules and polymeric materials with high efficiency by breaking the inter and intra-molecular hydrogen bonding network of polysaccharides and promoting their dissolution.37 Solid–liquid equilibria (SLE) of miscanthus in ionic liquids was carried out in a large range of temperatures (90–130 °C). Fig. S1, ESI,† presents the solubility of miscanthus in four ionic liquids. The solubility of miscanthus is higher in DMIMMPh than in other ionic liquids. This maybe related to the high hydrogen bond basicity and polarity of this IL. This observation indicates that the nature and the size of the ionic liquid's anion significantly influence the solubility of miscanthus. Strong H-bond-acceptor anions, such phosphonate anions, effectively dissolve miscanthus, (see Fig. S2 for the microscopic images of miscanthus dissolution in ionic liquids, ESI†). The high solubility of miscanthus in phosphonate-based ILs (DMIMMPh) may be of interest in technology of pretreatment of biomass because these ILs are free of halogens. Moreover, these ILs are less-toxic, non-corrosive and biodegradable.22,37
On the other hand, the nature of the IL's cation and the alkyl-chain length on the cation also play a role in the dissolution process. Swatloski et al. 2002, have reported that the solubility of cellulose in ILs decreased with the increasing size of the cations such as lengthy alkyl groups substituted on the imidazolium ring.37 It is suggested that, in salt solutions with small, strong polarizing cations and large polarizable anions, intensive interactions with cellulose occur. Results obtained on the solubility of miscanthus in ionic liquids and the data published in the literature22,27,38–40 proved that phosphonate- and chloride-based ionic liquids are good solvents for miscanthus, (see Table S2, ESI†). The solubility results presented in this work are in agreement with the work of S. Padmanabhan et al., 2011.22 The direct comparison with the published solubility data of other lignocellulosic biomass materials is not possible due to differences in solutes and/or pretreatment conditions. However, the trends reported in those studies are similar.
3.1.1. Effect of temperature and dissolution rate. Recent studies reported on the solubility of lignocellulosic biomass in ionic liquids showed that temperature and time significantly influence the solubility process. In fact, high temperatures lead to better solubility but this may cause degradation of cellulose and hemicelluloses. Fig. 1 shows the influence of temperature and time on the rate of dissolution of miscanthus in DMIMMPh and BMIMCl. As expected, the rate of dissolution of miscanthus is slightly faster at higher temperatures. The rate of dissolution of miscanthus in DMIMMPh is higher than in BMIMCl. No significant increase in the solubility of miscanthus in BMIMCl and DMIMMPh was observed after 12 and 18 h respectively.
 |
| Fig. 1 Effect of temperature on the miscanthus solubility in DMIMMPh and BMIMCl as a function of time at temperatures 100 °C and 130 °C. | |
3.2. Extraction and regeneration of cellulose from miscanthus using ionic liquids
3.2.1. Effect of antisolvent type. In our previous work,41 it was concluded using ab initio calculations that the presence of an antisolvent such as water affect the activity of the ILs as water exhibits a strong interaction with ILs, especially hydrophilic ILs. It was also indicated that the hydrogen bonds between BMIMCl and cellulose are weaken or even destroyed by the addition of water. On the other hand, the hydrogen bonds in the cellulose–cellulose system formed again, resulting in the precipitation of the cellulose.30,41,42 Table 1 shows the effect of antisolvent type on the extraction of cellulose form miscanthus using BMIMCl ionic liquid at temperature 100 °C during 6 h with a mixture containing 3% miscanthus mass fraction. The effect of antisolvent on the extraction process was investigated using various antisolvents such as water, ethanol, acetone, water–acetone (50
:
50) and water–DMSO (50
:
50). In fact, the extraction process did not affect greatly with changing the antisolvent. Hence, water was suggested as a suitable antisolvent for our studies.
Table 1 Effect of antisolvent type on the extraction process
Antisolvent type |
Cellulose grade (%) |
Cellulose recovery (%) |
Water |
67.93 |
68.57 |
Ethanol |
64.70 |
66.62 |
Acetone |
66.55 |
67.20 |
Water–acetone |
67.30 |
67.90 |
Water–DMSO |
68.42 |
66.84 |
3.2.2. Effect of type of ionic liquid. Table 2 presents the effect of the structure of ionic liquid on the cellulose extraction process performed at temperature 100 °C, during 6 h, with a mixture containing 3% miscanthus mass fraction and water as an antisolvent. The cellulose-rich extract composition shown in Table 2 proves that cellulose extraction efficiency, high cellulose yield with low lignin yield, increases in the following order: EMIMSCN < EtOHMIMCl < BMIMCl < DMIMMPh. This is in a good agreement with the miscanthus solubility results. This behaviour could be explained due to the difference in hydrogen bond basicity and polarity between ionic liquids.
Table 2 Effect of type of ionic liquid on the extraction processes
Solvent |
Cellulose grade (%) |
Cellulose recovery (%) |
Hemicellulose grade (%) |
Hemicellulose recovery (%) |
Lignin grade (%) |
Lignin recovery (%) |
Others (ash & unknown products) (%) |
DMIMMPh |
70.03 |
72.14 |
15.47 |
25.56 |
11.69 |
18.29 |
2.80 |
BMIMCl |
67.93 |
68.57 |
16.67 |
26.98 |
12.49 |
19.15 |
2.90 |
EtOHMIMCl |
67.03 |
65.98 |
16.97 |
26.78 |
12.99 |
19.42 |
3.00 |
EMIMSCN |
54.05 |
44.10 |
22.95 |
30.04 |
19.99 |
24.77 |
3.00 |
3.2.3. Effect of temperature. Brandt et al.43 found that swelling and dissolution in ILs is temperature-dependent, and that better dissolution and regeneration rates are obtained at temperatures beyond 100 °C. Fig. 2 shows the dissolution rate, cellulose recovery, cellulose grade, cellulose regeneration rate and mass loss of miscanthus in DMIMMPh ionic liquid at 5% miscanthus mass fraction, time 6 h and water as an antisolvent. It is obvious that the dissolution rate increases when the temperature increases from 90 to 130 °C. Nevertheless, the cellulose grade, recovery and regeneration rate increase from 90 to 110 °C. At temperature higher than 110 °C, these parameters strongly decrease except for cellulose grade due to the degradation occurrence. Mass loss results indicate that temperature has a great effect on the extraction efficiency. The mass loss increased from 1.42% at 90 °C K to 42.54% at 130 °C. Temperature higher than 110 °C leads to high degradation and hence low extraction efficiency.39
 |
| Fig. 2 The effect of temperature (°C) on the extraction process. | |
3.2.4. Effect of time. The kinetics of the miscanthus dissolved in DMIMMPh were studied as a function of dissolution time. Fig. 3 shows the dissolution rate%, cellulose recovery%, cellulose grade%, cellulose regeneration rate% and mass loss% miscanthus in DMIMMPh at 3% miscanthus mass fraction, temperature 100 °C, and water as an antisolvent. As expected, the dissolution rate increased with increasing reaction time from 1 to 24 hours. The cellulose grade, recovery and regeneration rate highly increase from 1 to 12 h. After 12 h, these parameters decrease due to the degradation occurrence. The mass loss increased from 0.95% at 1 h to 13.82% at 24 h indicating that the polymer degradation increases with time.
 |
| Fig. 3 The effect of time (h) on the extraction process. | |
3.2.5. Applying Box–Behnken experimental design. An experimental design technique, Box–Behnken Design, is used to optimize miscanthus solubility and extraction results in DMIMMPh ionic liquid and to evaluate the interaction between different parameters. Such an experiment allows the study of the effect of each factor temperature, time and miscanthus mass fraction, as well as the effects of interactions between factors on the cellulose solubility and extraction from miscanthus. See Table S3 for the factor levels and Table S4† for the different responses at different experimental combinations (Runs) for the miscanthus–DMIMMPh mixture.According to this design, the optimal conditions were estimated using a second order polynomial function by which a correlation between studied factors and response (mean diameter) was generated. The general form of this equation is:
|
Y = βo + β1X1 + β2X2 + β3X3 + β12X1X2 + β13X1X3 + β23X2X3 + β11X12 + β22X22 + β33X32
| (9) |
where
Y is the predicted response; dissolution rate, cellulose grade and cellulose recovery%,
X1,
X2 and
X3 are studied variables; temperature, time and miscanthus mass fraction;
βij are equation constants and coefficients.
Analysis of variance (ANOVA) was used to estimate the statistical parameters. The extent of fitting the experimental results to the polynomial model equation was expressed by the determination coefficient, R2. F-test was used to estimate the significance of all terms in the polynomial equation within 95% confidence interval. “Adeq Precision” measures the signal to noise ratio, a ratio greater than 4 is desirable and indicates an adequate signal.44 ANOVA data for the system indicates the well fitting of the experimental results to the polynomial model equation and hence accuracy of this model, (see Table S5, ESI†). The model F-values of 126.75, 144.18 and 126.40 imply the model is significant. The “Adeq Precision” ratios of 38.086, 35.868 and 32.401 indicate an adequate signal.
Fig. 4 shows the response surface plots of the cellulose recovery% resulting from the main effects of different variables, (see Fig. S3 for the response surface plots of the miscanthus dissolution rate% and cellulose grade% resulting from the main effects of different variables, ESI†). It is noticed that the dissolution rate% and recovery increase with increasing the temperature and time and with decreasing the miscanthus mass fraction with a slight decrease of the recovery at high time. Cellulose grade is mainly dependent on the temperature, temperature higher than 110 °C leads to lower cellulose grade. It is obvious that no important interaction between the different factors was observed, while temperature is the most effective variable on the extraction process.
 |
| Fig. 4 The response surface plots of cellulose recovery resulting from the main effects of different variables, temperature, time and miscanthus mass fraction for miscanthus–DMIMMPh mixture (a) at mass fraction 4% and (b) at temperature 110 °C. | |
The best optimum parameters of the Box–Behnken design for the dissolution and extraction of miscanthus in DMIMMPh IL mixture are temperature 107 °C, time 6.30 h and 3.2% miscanthus mass fraction. Applying these optimum parameters on {miscanthus + DMIMMPh or BMIMCl} mixtures, cellulose grade of 74.4% and 71.8% with cellulose recovery of 77.6% and 73.8% respectively, were obtained (Table 3). A slight decrease of efficiency was observed when using recycled DMIMMPh (Table 3).
Table 3 Applying the optimum parameters of Box–Behnken design for the miscanthus–DMIMMPh and BMIMCl mixtures
Solvent |
Cellulose grade (%) |
Cellulose recovery (%) |
Hemicellulose grade (%) |
Hemicellulose recovery (%) |
Lignin grade (%) |
Lignin recovery (%) |
Others (ash & unknown products) (%) |
DMIMMPh |
74.4 |
77.6 |
13.7 |
22.9 |
9.1 |
14.4 |
2.80 |
BMIMCl |
71.8 |
73.8 |
14.9 |
24.6 |
10.5 |
16.4 |
2.90 |
Recycled DMIMMPh |
72.3 |
73.5 |
15.1 |
24.9 |
9.7 |
15.0 |
3.00 |
Comparing the results, in Table 3, obtained from the optimization with the Box–Behnken experimental design with initial results, in Table 2, obtained before optimization, it is noticed that cellulose extraction efficiency is increased. For example, in the {miscanthus + DMIMMPh} mixture cellulose grade increases after optimization by 4.4% also cellulose recovery increases by 5.5%. On the other hand hemicellulose and lignin grade and recovery are decreased after optimization.
3.2.6. Ionic liquids recycling. Ionic liquid recycling was carried out using ethanol which was added to precipitate lignin and other sugars. Our previous work45,46 show that ethanol can be used as an antisolvent to separate carbohydrates from ionic liquids. The solution was filtered, dried and the recycled ionic liquid was characterized with H1NMR. The H1NMR results show that DMIMMPh can be successfully recycled, (see Fig. S4, ESI†).
3.3. Characterization of the regenerated cellulose-rich extract
3.3.1. XRD analysis. The X-ray spectra of the untreated miscanthus sample showed two prominent peaks near 2θ of 15° and 22°, indicating the characteristic diffraction pattern of crystalline cellulose. The cellulose-rich extracts recovered after DMIMMPh treatment displayed a slightly broad amorphous diffraction peak near 2θ of 21° which is the characteristic diffraction pattern of amorphous cellulose (see Fig. S5, ESI†).47,48 Compared with the diffraction pattern of the original miscanthus, the intensities of the diffraction peaks in the cellulose-rich extracts are smaller. The crystallinity index value of untreated and treated miscanthus are about 74% and 30% respectively according to the X-ray diffraction analysis, Segal's method,33,34 as previously reported. This observation can be explained by a reduction in the intra- and intermolecular hydrogen bonds occurring during the continuous transformation of miscanthus into amorphous cellulose.49
3.3.2. NMR analysis. Solid-state CP/MAS 13C experiments were carried out on untreated and treated miscanthus samples. The spectra are shown in Fig. 5. The NMR resonances were assigned according to data from the literature.7,33,50,51 In the spectrum of untreated miscanthus, Fig. 5A, the peak (a) at 168–178 ppm is due to carbonyl groups of hemicelluloses and lignin. The peak (b) at 130–155 ppm is associated with the aromatic carbons of lignin. The peak (c) at 105 ppm assigned to the anomeric carbon C1 of cellulose and hemicelluloses. The peaks (d) and (e) at 89 and 83 ppm correspond to crystalline and amorphous cellulose at C4. The intense peaks (f) and (g) at 75 and 73 ppm are overlapping signals due to the C2, C3 and C5 carbons of all polysaccharides. The peaks (h) and (i) at peaks 65 and 62 ppm correspond to crystalline and amorphous cellulose at C6. The peak (j) at 56 ppm associated with the methoxyl group of lignin and hemicelluloses and finally, the peak (k) at 20 ppm is due to the acetyl groups of hemicelluloses.
 |
| Fig. 5 13C CP/MAS NMR spectra of miscanthus: (A) untreated and (B) treated with DMIMMPh ionic liquid. | |
The NMR spectrum of miscanthus treated with ionic liquids, Fig. 5B, shows very low intensity peaks for lignin and hemicellulose. Cellulose peaks confirm the high cellulose content of the regenerated cellulose.
3.3.3. FTIR analysis. The intensity of peaks characteristic of hydrogen bonds, the broad band in the 3600–3100 cm−1 region,47 is lower in the spectra of extracted cellulose than those obtained from the initial miscanthus samples. This could be due to the scission of the intra- and intermolecular hydrogen bonds. Also, these peaks are shifted to higher wave number values which evidences the formation of amorphous cellulose, (see Fig. S6, ESI†).Moreover, the intensity of the crystallinity band at 1430 cm−1, which is assigned to a symmetric CH2 bending vibration, is decreased. On the other hand, the intensity of the amorphous band at 898 cm−1, which is assigned to C–O–C stretching at β-(1 → 4)-glycosidic linkages,47,52 is increased (see Fig. S6, ESI†).
In addition, the absence or the great decrease of the intensity of characteristic lignin bands at 1519, 1430 and 1262 cm−1 in the produced cellulose rich extracts indicates the performance of ionic liquids for the delignification process,27,52 (see Fig. S6, ESI†). Indeed, FTIR spectroscopic investigations evidenced the production of amorphous cellulose almost free of lignin, which is suitable for enzymatic hydrolysis processes.
3.3.4. Morphological investigation. SEM images of original miscanthus, the cellulose-rich extract, and the miscanthus residue are shown in Fig. S7, ESI.† Compared with the original miscanthus which has a fascicular texture, the miscanthus residue shows a highly porous structure; this indicates that DMIMMPh ILs effectively disrupts the intricate network of non-covalent interactions within lignocelluloses, leading to the dissolution of miscanthus. The regenerated cellulose-rich extract is homogeneous, dense, has a higher surface area and presents uniform macrostructures.A comparison between microcrystalline cellulose and the regenerated cellulose-rich extracts put in evidence the great difference between the highly intensive crystalline structure in microcrystalline cellulose (MCC) and the porous structure of the regenerated cellulose, (see Fig. S8, ESI†). In addition, the surface area of the IL pretreated cellulose rich-extracts significantly increases. SEM images indicate that the regenerated cellulose is amorphous, porous, which is highly responsive to enzymatic saccharification.
3.4. Bioethanol production
3.4.2. Hydrolysate fermentation. The hydrolysate solutions of the untreated miscanthus and the cellulose-rich extract samples were fermented using yeast from S. cerevisiae and the results were compared with that of 40 g L−1 pure glucose hydrolysate. The fermentation results including cell growth, sugars consumption and ethanol formation for the fermentation of hydrolysate, produced from the treatment of miscanthus with DMIMMPh, are presented in Fig. 7. A typical batch growth phase is observed, including the following phases: lag phase (0–6 h), exponential growth phase (6–36 h), deceleration phase (36–48 h) and stationary phase (48–72 h). In the first 6 hours of fermentation, the yeasts adapted themselves to growth conditions. During the exponential phase, cell growth and substrate consumption are increasing exponentially with time. After 36 hours of fermentation, the growth rate is found to slow down as a result of glucose depletion. As observed in Fig. 7, the concentration of glucose is quite constant during the first 6 hours. The concentration of glucose is then decreased as expected during the fermentation, coinciding with an increase in the production of cell and ethanol. This is due to the cells consuming the glucose in the system to increase the growth of cell and the production of ethanol. It can also be observed that the glucose is depleted after 36 hours. The concentration of ethanol is found to increase rapidly during the first 36 hours of fermentation. It starts to decrease only after achieving a maximum concentration of 20.35 g L−1 at 72 hours of fermentation. The ethanol is probably used as a carbon source by the yeast for its growth when the concentration of glucose started to deplete.53,54 By comparing the cell and the concentrations of ethanol, it can be classified as a growth-associated product in which the product is produced simultaneously with the cell growth. The cell growth rate (u), was 0.0677 h−1. This value is in a good agreement with values published by N. G. Cheng et al., 2009.55
 |
| Fig. 7 Fermentation results of hydrolysate produced from the treatment of miscanthus with DMIMMPh. | |
The conversion rate results for the fermentation of various hydrolysate solutions are shown in Table 4. The maximum ethanol conversion value of hydrolysates reaches up to 85%.
Furthermore, in order to evaluate the ethanol production from the hydrolysates of the extracted cellulose, ethanol production efficiency with respect to the cellulose and hemicellulose content in the cellulose-rich extracts, is calculated as following:56–58
|
 | (10) |
where the value 1.11 is equivalent to [molecular weight of glucose unit (180.16)/molecular weight of cellulose unit (162.14)] while the value 1.136 is equivalent to [molecular weight of xylose unit (150.13)/molecular weight of hemicellulose unit, xylan, (132.11)].
Ethanol production efficiency reaches up to 66.75%, Table 4. These values could be compared with those published in the literature concerning the hydrolysates based on acid and alkali pretreatments. Where, the ethanol production efficiency values of the CSTR AD fiber (Dairy cow feces fiber digested anaerobically with Continuous stirring tank reactor), PFR AD fiber (Dairy cow feces fiber digested anaerobically with Plug flow reactor) and corn stover hydrolysates are in the range from 65 to 75%.56–58
An overall evaluation process for the production of ethanol from miscanthus after IL-pretreatment, enzymatic hydrolysis and fermentation processes, is shown in Table 4. The overall ethanol yield was calculated based on total amount of miscanthus considering the loss of carbohydrates during the pretreatment, enzymatic hydrolysis and fermentation processes. The overall ethanol yield for the miscanthus treated with DMIMMPh was 148 g ethanol per kg miscanthus. This value could be compared with the values of the overall ethanol yield published in the literature for corn stover, CSTR AD fiber (Dairy cow feces fiber digested anaerobically with Continuous stirring tank reactor) and PFR AD fiber (Dairy cow feces fiber digested anaerobically with Plug flow reactor) which are 135, 105 and 85 g ethanol kg−1 biomass respectively.56–58
4. Conclusion
The use of DMIMMPh ionic liquid in the pretreatment of miscanthus and the extraction of cellulose has been studied. It was found that this ionic liquid is an excellent candidate for biomass treatment. Analyses results evidenced the production of amorphous, porous cellulose almost free of lignin, thereby facilitating its enzymatic hydrolysis and fermentation for bioethanol production. The glucose hydrolysis efficiency of the regenerated cellulose reached up to 94%. The IL-pretreatment efficiency, compared to other classical pretreatments, is determined by its ability to improve cellulose accessibility and increase overall sugars yield rather than only concentrating on removing lignin content. This is confirmed with the high overall ethanol yield, up to 148 g ethanol kg−1 miscanthus, produced from the fermentation of the hydrolysates.
References
- A. J. Ragauskas, C. K. Williams, B. H. Davison, G. Britovsek, J. Cairney, C. A. Eckert, W. J. Frederick, J. P. Hallett, D. J. Leak, C. L. Liotta, J. R. Mielenz, R. Murphy, R. Templer and T. Tschaplinski, Science, 2006, 311, 484–489 CrossRef CAS PubMed.
- H. Tadesse and R. Luque, Energy Environ. Sci., 2011, 4, 3913–3929 CAS.
- P. Kang, W. Qin, Z.-M. Zheng, C.-Q. Dong and Y.-P. Yang, Carbohydr. Polym., 2012, 90, 1771–1778 CrossRef CAS PubMed.
- R. Wooley, M. F. Ruth, D. Glassner and J. Sheehan, Biotechnol. Prog., 1999, 15, 794–803 CrossRef CAS PubMed.
- T. Vancov, A.-S. Alston, T. Brown and S. McIntosh, Renewable Energy, 2012, 45, 1–6 CrossRef CAS PubMed.
- M. Galbe and G. Zacchi, Biofuels, 2007, 108, 41–65 CAS.
- N. Brosse, P. Sannigrahi and A. Ragauskas, Ind. Eng. Chem. Res., 2009, 48, 8328–8334 CrossRef CAS.
- N. Brosse, A. Dufour, X. Meng, Q. Sun and A. Ragauskas, Biofuels, Bioprod. Biorefin., 2012, 6, 580–598 CrossRef CAS PubMed.
- T. de Vrije, G. G. de Haas, G. B. Tan, E. R. P. Keijsers and P. A. M. Claassen, Int. J. Hydrogen Energy, 2002, 27, 1381–1390 CrossRef CAS.
- H. K. Murnen, V. Balan, S. P. S. Chundawat, B. Bals, L. da Costa Sousa and B. E. Dale, Biotechnol. Prog., 2007, 23, 846–850 CrossRef CAS PubMed.
- A. Sørensen, P. J. Teller, T. Hilstrom and B. K. Ahring, Bioresour. Technol., 2008, 99, 6602–6607 CrossRef PubMed.
- M. Yoshida, Y. Liu, S. Uchida, K. Kawarada, Y. Ukagami, H. Ichinose, S. Kaneko and K. Fukuda, Biosci., Biotechnol., Biochem., 2008, 72, 805–810 CrossRef CAS PubMed.
- J. J. Villaverde, J. Li, M. Ek, P. Ligero and A. Vega, J. Agric. Food Chem., 2009, 57, 6262–6270 CrossRef CAS PubMed.
- T. Le Ngoc Huyen, C. Rémond, R. M. Dheilly and B. Chabbert, Bioresour. Technol., 2010, 101, 8224–8231 CrossRef CAS PubMed.
- C. Reichardt, Green Chem., 2005, 7, 339–351 RSC.
- U. Domanska and R. Bogel-Lukasik, J. Phys. Chem. B, 2005, 109, 12124–12132 CrossRef CAS PubMed.
- M. E. Zakrzewska, E. Bogel-Lukasik and R. Bogel-Lukasik, Energy Fuels, 2010, 24, 737–745 CrossRef CAS.
- H. Yoon, G. H. Lane, Y. Shekibi, P. C. Howlett, M. Forsyth, A. S. Best and D. R. MacFarlane, Energy Environ. Sci., 2013, 6, 979–986 CAS.
- D. Fu, G. Mazza and Y. Tamaki, J. Agric. Food Chem., 2010, 58, 2915–2922 CrossRef CAS PubMed.
- K. Shill, S. Padmanabhan, Q. Xin, J. M. Prausnitz, D. S. Clark and H. W. Blanch, Biotechnol. Bioeng., 2011, 108, 511–520 CrossRef CAS PubMed.
- H. Rodríguez, S. Padmanabhan, G. Poon and J. M. Prausnitz, Bioresour. Technol., 2011, 102, 7946–7952 CrossRef PubMed.
- S. Padmanabhan, M. Kim, H. W. Blanch and J. M. Prausnitz, Fluid Phase Equilib., 2011, 309, 89–96 CrossRef CAS PubMed.
- E. Husson, S. Buchoux, C. Avondo, D. Cailleu, K. Djellab, O. Wattraint, C. Sarazin and I. Gosselin, Bioresour. Technol., 2011, 102, 7335–7342 CrossRef CAS PubMed.
- T. Auxenfans, S. Buchoux, E. Husson and C. Sarazin, Biomass Bioenergy, 2014, 62, 82–92 CrossRef CAS PubMed.
- T. Auxenfans, S. Buchoux, K. Djellab, C. Avondo, C. Sarazin and E. Husson, Carbohydr. Polym., 2012, 90, 805–813 CrossRef CAS PubMed.
- D. A. Fort, R. C. Remsing, R. P. Swatloski, P. Moyna, G. Moyna and R. D. Rogers, Green Chem., 2007, 9, 63–69 RSC.
- N. Sun, M. Rahman, Y. Qin, M. L. Maxim, H. Rodríguez and R. D. Rogers, Green Chem., 2009, 11, 646–655 RSC.
- T. K. Ghose, Pure Appl. Chem., 1987, 59, 257–268 CAS.
- D. Templeton and T. Ehrman, LAP 003-Standard Method for the Determination of Acid-Insoluble Lignin in Biomass, 1995, http://www.cobweb.ecn.purdue.edu/%7Elorre/16/research/LAP-003.pdf, accessed 20 March 2010.
- H. T. Tan and K. T. Lee, Chem. Eng. J., 2012, 183, 448–458 CrossRef CAS PubMed.
- J. X. Sun, X. F. Sun, H. Zhao and R. C. Sun, Polym. Degrad. Stab., 2004, 84, 331–339 CrossRef CAS PubMed.
- Y. Teramoto, S. Lee and T. Endo, Bioresour. Technol., 2009, 100, 4783–4789 CrossRef CAS PubMed.
- L. Segal, J. J. Creely, A. E. Martin Jr and C. M. Conrad, Text. Res. J., 1959, 29, 786–794 CrossRef CAS PubMed.
- S. Park, J. O. Baker, M. E. Himmel, P. A. Parilla and D. K. Johnson, Biotechnol. Biofuels, 2010, 3, 10 CrossRef PubMed.
- R. H. Newman, Holzforschung, 2004, 58, 91–96 CrossRef CAS.
- Y. Lin, W. Zhang, C. Li, K. Sakakibara, S. Tanaka and H. Kong, Biomass Bioenergy, 2012, 47, 395–401 CrossRef CAS PubMed.
- R. P. Swatloski, S. K. Spear, J. D. Holbrey and R. D. Rogers, J. Am. Chem. Soc., 2002, 124, 4974–4975 CrossRef CAS PubMed.
- H. Xie, S. Li and S. Zhang, Green Chem., 2005, 7, 606–608 RSC.
- X. Wanga, H. Li, Y. Cao and Q. Tang, Bioresour. Technol., 2011, 102, 7959–7965 CrossRef PubMed.
- T.-Q. Yuan, W. Wan, F. Xu and R.-C. Sun, Bioresour. Technol., 2013, 144, 429–434 CrossRef CAS PubMed.
- E.-S. R. E. Hassan, F. Mutelet and M. Bouroukba, Carbohydr. Polym., 2015, 127, 316–324 CrossRef CAS PubMed.
- M. Zavrel, D. Bross, M. Funke, J. Büchs and A. C. Spiess, Bioresour. Technol., 2009, 100, 2580–2587 CrossRef CAS PubMed.
- A. Brandt, J. P. Hallett, D. J. Leak, R. J. Murphy and T. Welton, Green Chem., 2010, 12, 672 RSC.
- G. E. P. Box and D. W. Behnken, Technometrics, 1960, 2, 455–475 CrossRef PubMed.
- E.-S. R. E. Hassan, F. Mutelet, S. Pontvianne and J.-C. Moise, Environ. Sci. Technol., 2013, 47, 2809–2816 CrossRef CAS PubMed.
- E.-S. R. E. Hassan, F. Mutelet and J.-C. Moise, RSC Adv., 2013, 3, 20219–20226 RSC.
- D. Ciolacu, F. Ciolacu and V. I. Popa, Cellul. Chem. Technol., 2011, 45, 13–21 CAS.
- P. Mansikkamaki, M. Lahtinen and K. Rissanen, Cellulose, 2005, 12, 233–242 CrossRef.
- Z. G. Wang, T. Yokoyama, H. M. Chang and Y. Matsumoto, J. Agric. Food Chem., 2009, 57, 6167–6170 CrossRef CAS PubMed.
- M. Matulova, R. Nouaille, P. Cappek, M. Péan, E. Forano and A. M. Delort, Appl. Environ. Microbiol., 2005, 71, 1247–1253 CrossRef CAS PubMed.
- E. Locci, S. Laconi, R. Pompei, P. Scano, A. Lai and F. C. Marincola, Bioresour. Technol., 2006, 99, 4279–4284 CrossRef PubMed.
- W.-Z. Li, M.-T. Ju, Y.-N. Wang, L. Liu and Y. Jiang, Carbohydr. Polym., 2013, 92, 228–235 CrossRef CAS PubMed.
- T. Bauchop and S. R. Elsden, J. Gen. Microbiol., 1960, 23, 457–469 CrossRef CAS.
- S. J. Coppella and P. Dhurjati, Chem. Eng. J., 1989, 41, B27–B35 CrossRef CAS.
- N. G. Cheng, M. Hasan, A. C. Kumoro, C. F. Ling and M. Tham, J. Sci. Technol., 2009, 17, 399–408 Search PubMed.
- Z. Yue, C. Teater, J. MacLellan, Y. Liu and W. Liao, Biomass Bioenergy, 2011, 35, 1946–1953 CrossRef CAS PubMed.
- Z. Yue, C. Teater, Y. Liu, J. MacLellan and W. Liao, Biotechnol. Bioeng., 2010, 105, 1031–1039 CAS.
- L. Tan, Y.-Q. Tang, H. Nishimura, S. Takei, S. Morimura and K. Kida, Prep. Biochem. Biotechnol., 2013, 43, 682–695 CrossRef CAS PubMed.
Footnote |
† Electronic supplementary information (ESI) available. See DOI: 10.1039/c5ra08946h |
|
This journal is © The Royal Society of Chemistry 2015 |
Click here to see how this site uses Cookies. View our privacy policy here.