Preparation and characterization of MWCNTs functionalized by N-(3-nitrobenzylidene)-N′-trimethoxysilylpropyl-ethane-1,2-diamine for the removal of aluminum(III) ions via complexation with eriochrome cyanine R: spectrophotometric detection and optimization

F. Nasiri Azada, M. Ghaedi*a, K. Dashtiana, M. Montazerozohoria, S. Hajatib and E. Alipanahpoura
aChemistry Department, Yasouj University, Yasouj, 75918-74831, Iran. E-mail: m_ghaedi@mail.yu.ac.ir; Fax: +98-74-33223048; Tel: +98-74-33223048
bDepartment of Physics, Yasouj University, Yasouj, 75918-74831, Iran

Received 11th May 2015 , Accepted 7th July 2015

First published on 8th July 2015


Abstract

A novel adsorbent was fabricated by covalently anchoring N-(3-nitro-benzylidene)-N′-trimethoxysilylpropyl-ethane-1,2-diamine onto multiwalled carbon nanotubes (NBATSPED-MWCNTs). This novel material was characterized by different techniques such as XRD, SEM, FT-IR and TGA-DTA. Subsequently, it was used for the ultrasound-assisted removal of aluminum(III) ions via its complexation with eriochrome cyanine R (ECR) indicator. The influences of variables such as initial ECR concentration (X1), initial Al3+ ion concentration (X2), adsorbent dosage (X3) and contact time (X4) on the efficiency of the removal process were investigated by small central composite design (CCD) under response surface methodology and genetic algorithm (GA). The process was empirically modeled to reveal the significant variables and their possible interactions. The optimization conditions were set as: 3 min, 20.238 mg, 20 mg L−1 and 15 mg L−1 for sonication time, adsorbent mass, initial Al3+ ions concentration and initial ECR concentration, respectively. Finally, it was found that the equilibrium and kinetics of the adsorption process follow the Langmuir isotherm and pseudo-second-order kinetic model, respectively. From the Langmuir isotherm, the maximum monolayer capacity (qmax) was found to be 46.74 mg g−1 at optimum conditions.
1. Introduction

The most abundant metallic element in the Earth's crust is aluminum, most of which is in the form of Al3+ ions. Al3+ ions strongly affect human and animals health via damaging their nervous system, tissues and cells. It may cause Alzheimer's and other diseases such as dementia, encephalopathy, Parkinson's and various types of cancers.1–4 Therefore, the detection and removal of Al3+ ions as well as the development of efficient quantification methods are of high importance to mitigate medical and environmental risks. Many methods like chemical precipitation, ion exchange, coagulation, membrane filtration and electrochemical techniques are efficiently applied for metal ions removal. However, some of these methods have been proven to be inefficient and extremely expensive in controlling heavy metal ion levels in wastewaters.5,6 Therefore, researchers seek to design and develop cheap, in situ, easy, fast and novel approaches for the removal of metal ions. The adsorption-based processes are of interest to implement the most of these considerations and requirements.7–9 Carbon-based materials are good and promising candidate due to their high surface area, porous structure, large adsorption capacities, fast adsorption kinetics and cost-effectiveness.10–13 Amongst them, multiwalled carbon nanotubes (MWCNTs) with unique physicochemical properties such as extremely high surface area and reactive surface sites, high mechanical and thermal stability, as well as good conductivity, etc. have become of high interest over last years.14–17 Chemical modification of MWCNT with different chelating agents or complexation centers significantly changes its nature, increases the number of reactive functional groups as well as enhances its selectivity and sorption capacity.17–23 The rate of adsorption can be accelerated by ultrasound irradiation via the enhancement in the mass transfer due to high-pressure shake waves and high-speed micro jets appeared following violent collapse of cavitations' bubbles.24,25

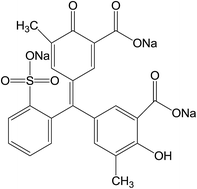
In this work, MWCNT was modified with Schiff base-like structure following its reaction with N-(3-nitro-benzylidene)-N′-trimethoxysilylpropyl-ethane-1,2-diamine (NBATSPED-MWCNT) as a novel adsorbent followed by the characterization using different techniques such as Fourier transform infrared spectroscopy (FTIR), thermal gravimetric analysis-differential thermal analysis (TGA-DTA), X-ray diffraction (XRD) and scanning electron microscopy (SEM). This adsorbent was used for the ultrasound-assisted removal of Al3+ ions after the complexation with ECR indicator (Fig. 1). The influences of variables such as sonication time, amount of adsorbent, initial Al3+ ions and ECR concentrations as well as their possible interactions were investigated and successfully optimized by central composite design (CCD) under response surface methodology (RSM) and genetic algorithm (GA). The UV-Vis spectroscopy was used for the determination of Al3+ ions concentration in solution after adsorption process. The adsorption kinetics and isotherms were also studied.


image file: c5ra08746e-f1.tif
Fig. 1 Chemical structure of ECR.

2. Experimental

2.1. Reagents and instruments

Chemical reagents including aluminum nitrate nonahydrate, sodium hydroxide and hydrochloric acid with highest purify available were obtained from Merck (Darmstadt, Germany). Eriochrome cyanine R, N-(3-(trimethoxysilyl)-propyl)ethylenediamine (TSPED) and 2-nitrobenzaldehyde (NBA) were purchased from Sigma-Aldrich. Multiwalled carbon nanotubes (MWCNTs) were supplied from Riedel-de Hean (Hannover, Germany), and other reagents were used in analytical grade from Merck Company.

The pH was adjusted and measured using pH/Ion meter model 686 (Metrohm, Switzerland, Swiss). Al3+ ions concentration was determined using Jasco UV-VIS spectrophotometer model V-530 (Jasco, Japan) at 534 nm following its complexation with ECR. The ultrasonic bath (Tecno-GAZ SPA Ultrasonic system, Italy) was used at frequency of 60 Hz and power of 130 W. The morphology of samples was studied by scanning electron microscopy (SEM: KYKY-EM3200) under an acceleration voltage of 26 kV. The FT-IR spectra of compounds were recorded on a JASCO-680 instrument in the range of 400–4000 cm−1 using KBr pellet with ratio 1[thin space (1/6-em)]:[thin space (1/6-em)]100 for samples to KBr. Thermal gravimetric analysis and differential thermal analysis were carried out on PerkinElmer Pyris Diamond from room temperature to 800 °C by a rate of 10 °C min−1 in air.

2.2. Preparation of NBATSPED-MWCNT

At first step, trimethoxysilylpropylethylene diamine supported on MWCNT (NH2-MWCNT) was synthesized by the reaction of 1.8 mL N-(3-(trimethoxysilyl)-propyl)ethylenediamine and 0.1 g MWCNT in 20 mL of dichloromethane under reflux at 40 °C in the oil bath for 24 hours. Then, the obtained solid was filtered, rinsed sequentially with ethanol and dried in an oven at 50 °C. Then, 0.9 g of 2-nitrobenzaldehyde was added to the resulting substance in 20 mL of methanol and refluxed at 60 °C in oil bath for 24 hours. The product was filtered, washed with 50 mL of ethanol, distilled water and then dried in oven for 10 h at 50 °C. In this way, N-(3-nitro-benzylidene)-N′-trimethoxysilylpropyl-ethane-1,2-diamine supported on MWCNT (NBATSPED-MWCNT) was obtained as a new adsorbent. The steps for the synthesis of the adsorbent are presented in Scheme 1.
image file: c5ra08746e-s1.tif
Scheme 1

2.3. Adsorption experiments

The adsorption of Al3+ ions onto NBATSPED-MWCNT after complexation with ECR was found to follow physical process through π–π and hydrogen bond interaction between ECR π bond and the π bond of functional groups of N-(3-nitro-benzylidene)-N′-trimethoxysilylpropyl-ethane-1,2-diamine. According to experimental runs in the CCD, the pH of various solutions with different concentration of Al3+ ions and ECR was adjusted using concentrated HCl and/or NaOH into a 50 mL Erlenmeyer flask while mixed thoroughly with specific amounts of adsorbent. The experiments were performed at room temperature during predetermined sonication time in an ultrasonic bath. At the end of the adsorption process, the sample solution was immediately centrifuged and the supernatant containing residual was analyzed by UV-Vis spectroscopy. The removal percentage of Al3+ ions (R%) at a given time and the amount of Al3+ ions adsorbed after reaching the equilibrium (qe (mg g−1)) were calculated from the following equations:
 
R% = ((C0Ct)/C0) × 100 (1)
 
qe = ((C0Ce) × V)/W (2)
where C0 is the initial Al3+ ions concentration (mg L−1), Ce is the residual Al3+ ions concentration at equilibrium state (mg L−1), Ct is the residual Al3+ ions concentration at time t, V is the volume of the solution (L) and W is the weight of the adsorbent (g) used.

2.4. Statistical analysis

Small central composite design as most applicable type of RSM was applied for modeling and the optimization of effects of concentration of ECR (X1) and Al3+ ions (X2), amount of adsorbent (X3) and contact time (X4) on the ultrasonic-assisted adsorption of Al3+ ions by NBATSPED-MWCNT. Four independent variables were set at five levels at which the R% of Al3+ ions as response was determined and shown in Tables 1 and 2. Analysis of variance (ANOVA) was performed to evaluate the important and effective terms for modeling the response based on F-test and p-values.31,32
Table 1 Experimental factors and levels in the central composite design
Factors Unit Surface factors
Levels Star point α = 2
(Low) −1 (Central) 0 (High) +1 α
(X1) Initial ECR concentration mg L−1 10 15 20 5 25
(X2) Initial Al3+ concentration mg L−1 15 20 25 10 30
(X3) Adsorbent dosage mg 15 20 25 10 30
(X4) Contact time min 2 3 4 1 5


Table 2 The design matrix and the response
Runs Block X1 X2 X3 X4 R%
1 1 15 20 20 3 96.39
2 1 10 25 15 4 88.23
3 1 15 20 10 3 65.24
4 1 15 20 20 3 92.27
5 1 15 30 20 3 94.9
6 1 20 25 15 2 59.11
7 1 10 15 15 2 91.17
8 1 15 20 20 3 93.74
9 1 5 20 20 3 90.92
10 1 15 10 20 3 84.74
11 1 15 20 20 1 69.35
12 1 15 20 20 3 93.21
13 1 20 25 25 2 75.5
14 2 15 20 20 3 94.86
15 2 25 20 20 3 79.67
16 2 10 15 25 2 90.08
17 2 15 20 30 3 94.99
18 2 20 15 30 4 94.37
19 2 15 20 20 5 92.44
20 2 20 15 15 4 79.65
21 2 10 25 25 4 96.42


2.5. Desirability function and genetic algorithm

The obtained polynomial equation was used for the evaluation of the DF and fitness function for GA for finding the best optimum levels of all variables. The main advantages of this method are its ability to obtain qualitative and quantitative response by simple and rapid transformation for each measurement.33,34 Desirability is a function between 0 and 1 corresponding to a completely undesirable and ideal situation, respectively. Genetic algorithm is based on population of individuals (independent variables) in random fashion, while fitness of each variable is evaluated using a semi-empirical model obtained from CCD. Subsequently, genetic operations such as mutation, selection function and cross over were applied to individuals selected according to their fitness to produce the next generation of individuals for fitness evaluation. This process were continued until finding an optimal condition.

3. Results and discussion

3.1. Characterization of adsorbent

The IR spectrum of MWCNTs (Fig. 2a), shows absorption peak at 1715 cm−1 corresponding to the stretching vibration of carbonyl groups. The broad peaks at 1180 cm−1 could be assigned to C–O stretching from phenolic, alcoholic, etheric groups and to C–C bonds. The new peak appearing at ∼3400 cm−1 corresponds to OH stretching. This peak can be assigned to the hydroxyl group of moisture, or carboxylic groups. The aromatic C[double bond, length as m-dash]C stretch is observed at ∼1580 cm−1 in spectra of MWCNT before the functionalization.26 After the modification with NBATSPED, the FT-IR spectrum of NH2-MWCNT (Fig. 2a) displays a new peak as a weak shoulder at 2931 cm−1, which corresponds to the stretching vibrations of C–H bonds in propyl group. After the addition of 2-nitrobenzaldehyde, the new peak appeared at 1650 cm−1 is related to C[double bond, length as m-dash]N which indicates successful synthesis of NBATSPED. Following the addition of NBA (Fig. 2a), two peaks at 1350 and 1540 cm−1 are attributed to –NO2 groups which confirm again the success of this step.27
image file: c5ra08746e-f2.tif
Fig. 2 FT-IR spectrum (a), TG, DTA and DTG curve of NBATSPED-MWCNT (b).

Thermal analysis of NBATSPED-MWCNT (Fig. 2b–d) reveals small mass reduction (about 0.1 mg) following the increase in temperature from room temperature to 150 °C which is probably related to the removal of physically adsorbed water molecules. Low mass reduction (about 0.15 mg) within the temperature variation from 300 to 400 °C is related to the removal of NO2 group from the NBATSPED and maximum sample weight loss over the temperature range of 450 to 800 °C is due to the degradation process of the grafted organic groups of NBATSPED on MWCNT.28

The morphological features of the samples studied by SEM are shown in Fig. 3a and b. MWCNTs are observed to be smooth, homogeneous, tidy and approximately uniform in size distribution (Fig. 3a). After the surface modification with NBATSPED, the NBATSPED-functionalized MWCNTs became rough, larger and bundled (Fig. 3b).29


image file: c5ra08746e-f3.tif
Fig. 3 SEM images of MWCNT (a), NBATSPED-MWCNT (b), and XRD pattern of NBATSPED-MWCNT (c).

The XRD pattern of the NBATSPED-MWCNTs (Fig. 3c) represents a peak at 26.07° (002) corresponding to the interlayer spacing of the nanotube. The peaks at 43.34° (100), 53.49° (004) and 78.5° (100) correspond to diffractions and reflections from the carbon atoms.30 As seen, the highly crystalline nature of the MWCNTs after functionalizing with NBATSPED is confirmed, while the high intensity of peak at 53.49° (004) shows that there has been a small amount of material in amorphous state. The observed XRD pattern indicates that the prepared NBATSPED-MWCNT is well-synthesized.

3.2. Spectral characteristics

In this work, the complex formation ability of ECR for binding most conventional metal ions was investigated and it was found that ECR has good discriminating ability for Al3+ ions toward other ions (at pH 5). Hence, absorbance spectra of ECR (20 mg L−1) in single solutions and in the presence of Al3+ ions with different concentrations are shown in Fig. 4. A red shift of the peak at 508 nm towards 534 nm was observed which corresponds to the complexation of ECR via Al3+ ions. This shift is possibly due to the loss of a proton from indicator after the enhanced covalent binding that is associated with the conjugation of the system, which influences charge distribution during the dissociation of the Al3+ ions. Therefore, the wavelength of 534 nm was chosen as a sensitive wavelength for further analytical measurements of Al3+ ions concentration after adsorption process.
image file: c5ra08746e-f4.tif
Fig. 4 The change in UV-Vis spectra after the addition of 1–7 mg L−1 Al3+ to 20 mg L−1 ECR at pH 6 (a), absorption spectrum of ECR (20 mg L−1) and Al3+ ions (7 mg L−1) at different adsorbent dosages (0–30 mg) (b), and chemical structure of ECR inset of Fig. 3a.

Fig. 4b shows the absorption spectra of ECR (20 mg L−1) and Al3+ ions (3 mg L−1) before and after removal at condition set as 3 min sonication time, at pH 6 while mixing the solution thoroughly with 10–30 mg adsorbent. As seen, the addition of adsorbent at higher values leads to an improvement in adsorption efficiency at the wavelength of 534 nm.

3.3. Effect of pH

Effects of initial solution pH on the complexation of Al(III)–ECR over NBATSPED-MWCNT were investigated and the maximum removal percentage was obtained over pH range of 4–6 (Fig. 5). At lower pH, probable protonation of ECR is followed with generation of positive charge on adsorbent surface that hinders the complex formation, which is attributed to repulsive force and thus decreases the mass transfer and the adsorption rate. The obtained complex, due to its reasonable lipophilicity, has more tendency to be adsorbed onto the adsorbent. At pH in the range of 4–6, the deprotonation of ECR leads to an improvement in the complex formation and mass transfer to the adsorbent surface. At pH higher than 6, due to probable competition of hydroxide ion with ECR and its complexation with Al3+ ions, a significant decrease in the removal percentage of Al3+ ions is observed.
image file: c5ra08746e-f5.tif
Fig. 5 Effect of pH on the removal of Al3+ ions in range of 2–9.

3.4. Analysis of small central composite design

ANOVA was performed to obtain information on the most important variables and their possible interactions (Table 3). Accordingly to the model, F-value of 26.20 and very small p-values (<0.0001) for most terms indicated the high suitability and applicability of the model for the predication of Al3+ ions removal within 95% confidence level. The “Lack of Fit F-value” of 5.68 and the corresponding p-value implied the significance of this model for the prediction of experimental data. The values of the determination coefficient R2 (0.9839) and the adjusted R2 (0.9464) also confirm the applicability of the model for predicting the removal percentage of Al3+ ions. Therefore, the following semi-empirical expression applies to model the removal percentage (R%) of Al3+ ions:
 
R% = 117.014 − 4.9804X1 − 1.79490X2 + 3.3501X3 − 16.95650X4 + 0.1242X1X3 + 1.4457X1X4 + 0.8318X2X4 − 0.0863X12 − 0.1407X32 − 3.2581X42 (3)
Table 3 The results of ANOVA for the response surface quadratic model for R% of Al3+ ions
Source Sum of squares Degree freedom Mean square F value p-value prob > F
Model 2369.08 14 169.22 26.2 0.0003
X1 63.28 1 63.28 9.8 0.0203
X2 51.61 1 51.61 7.99 0.0301
X3 596.7 1 596.7 92.4 <0.0001
X4 266.57 1 266.57 41.28 0.0007
X1X2 0.71 1 0.71 0.11 0.7515
X1X3 72.06 1 72.06 11.16 0.0156
X1X4 198.32 1 198.32 30.71 0.0015
X2X3 14.99 1 14.99 2.32 0.1785
X2X4 75.56 1 75.56 11.7 0.0141
X3X4 7.24 1 7.24 1.12 0.3305
X12 117.55 1 117.55 18.2 0.0053
X22 26.78 1 26.78 4.15 0.0879
X32 300.31 1 300.31 46.5 0.0005
X42 267.41 1 267.41 41.41 0.0007
Residual 38.75 6 6.46    
Lack of fit 28.65 2 14.33 5.68 0.0678
Pure error 10.09 4 2.52    
Cor total 2407.82 20      


To make another convenient assessment on the applicability of the model, the predicted and observed values of the removal percentage of Al3+ ions on NBA-TPEDA-MWCNT were compared (Fig. 6) which showed a good fit.


image file: c5ra08746e-f6.tif
Fig. 6 The experimental versus the predicted data of normalized removal of Al3+ ions.

3.5. Optimization condition

Fig. 7 shows the desirability profile for the removal percentage of Al3+ ions. The values of 1.0, 0.5 and 0.0 for the desirability correspond to the maximum (96.42%) minimum (59.11%) and mean (77.65%) response as shown in the top right hand side of Fig. 7, while their individual desirability scores are illustrated on the left hand side of Fig. 7 (bottom). Since desirability 1.0 was selected as the target value, the overall response obtained from these plots with the current level of each variable in the model was depicted at the top (left) of Fig. 7. Based on these calculations and desirability score of 0.948, maximum recovery was obtained to be 94.8%, at mild optimum condition set as: 3 min, 20.3 mg, 20 mg L−1 and 15 mg L−1 for the sonication time, adsorbent mass, Al3+ ions concentration and ECR concentration, respectively.
image file: c5ra08746e-f7.tif
Fig. 7 Profile for predicated values and desirability function for removal percentage of Al3+ ions.

The GA was applied to optimize the input fitness functions of the central composite design model. As shown in Fig. 8a, the maximum GA condition for the removal of Al3+ ions was found at 15 mg L−1, 19.998 mg L−1, 20.997 mg and 3.093 min for Al3+ ions, ECR, of adsorbent mass and sonication time, respectively. Fig. 8b represents the best fitness plot achieved during the iterations of GA over 55 generation and describes the gradual convergence of results toward the optimal solution for the removal of Al3+ ions.


image file: c5ra08746e-f8.tif
Fig. 8 Converged (best individuals) values of parameters (a), and GA predicted plot for minimum overcut (b).

The conditions for the optimum removal of Al3+ ions predicted by DF and GA are further compared with experimental results for the same set of parameters (Table 4). Table 4 shows that the results obtained from DF and GA-based optimization are in good agreement with experimental observations.

Table 4 Comparison of optimum condition from CCD, DF and GA for Al3+ ion
Factors DF GA
Initial concentration of ECR 15.000 15.000
Initial concentration of Al3+ ions 20.000 19.998
Adsorbent dosage 20.238 20.997
Sonication time 3.00 3.093


3.6. Contour plots

The contour plots of Al3+ ions removal percentage versus significant variables are shown in Fig. 9. The experimental results reveal that lower ECR concentration is associated with lower extent of complex formation and reduction in removal percentage, as mentioned above. At higher ECR concentration, due to probable change in stoichiometry and subsequent increase in mass transfer, the removal percentage was higher.
image file: c5ra08746e-f9.tif
Fig. 9 Contour plots for X1X3 (a), X1X4 (b) and X2X4 (c).

The effect of adsorbent dosage on the Al3+ ions removal percentage is shown in Fig. 9a. As seen, the Al3+ ions removal increases as the adsorbent mass increases up to 18 mg while the adsorption rate slows down afterwards. At lower adsorbent dosage, the removal percentage significantly decreases because of high ratio of Al3+ ions to vacant sites. The rapid increase in adsorption at higher amount of adsorbent is attributed to greater surface area and availability of more adsorption sites, while at lower adsorption mass the process slows down due to the limitation in the number of active sites and higher amount of ECR indicator in the solution.

The effect of contact time on the Al3+ ions removal percentage is shown in Fig. 9b and c. As seen, the maximum Al3+ ions adsorption could be achieved in short sonication time that strongly supports high contribution of ultrasound power in mass transfer and thus the higher efficiency for the adsorption of Al3+ ions. In other words, the application of ultrasound simultaneously increases the diffusion coefficient of ECR–Al3+ ions and mass transfer of aggregate to the surface area and vacant sites of adsorbent.

Fig. 9c shows the effect of initial Al3+ ions concentration on its removal percentage, which indicates reverse correlation among Al3+ ions concentrations and its removal percentage. The low ratio of solute concentrations to adsorbent sites leads to high Al3+ ions removal percentage at lower initial concentration.

3.7. Adsorption equilibrium study

The experimental adsorption equilibrium data was evaluated for studying the mechanism of Al3+ ions adsorption onto NBATSPED-MWCNT using different models such as Langmuir, Freundlich, Temkin, Dubinin–Radushkevich isotherms17,35,36 in their conventional linear form. Subsequently, their corresponding constants were evaluated from the slopes and intercepts of respective lines (Table 5). These models were applied at two dosages of adsorbent while other variables were kept at optimal condition (Table 5). Fitting the experimental data to these isotherm models and considering the higher values of correlation coefficients (R2 = 0.999), it was concluded that the Langmuir isotherm is the best model to explain the Al3+ ions adsorption onto NBATSPED-MWCNT, which quantitatively describes the formation of a monolayer of adsorbate on the outer surface of the NBATSPED-MWCNT. It also shows the equilibrium distribution of metal ions between the solid and liquid phase.
Table 5 Isotherm constant parameters and correlation coefficients calculated for the adsorption of Al3+ ions
Isotherm Equation Parameters 15 mg 20 mg
Langmuir 1/qe = 1/(KaQmCe) +1/QmA plot Ce/qe versus Ce should indicate a straight line of slope 1/Qm and an intercept of 1/(Ka Qm). Qm (mg g−1) 46.74 36.10
Ka (L mg−1) 1.75 8.66
R2 0.996 0.999
Freundlich ln[thin space (1/6-em)]qe = ln[thin space (1/6-em)]KF + (1/n) ln[thin space (1/6-em)]Ce the values of KF and 1/n were determined from the intercept and slope of linear plot of ln[thin space (1/6-em)]qe versus ln[thin space (1/6-em)]Ce, respectively. 1/n 0.1184 0.958
KF (L mg−1) 4.58 4.36
R2 0.962 0.895
Temkin qe = B1[thin space (1/6-em)]ln[thin space (1/6-em)]KT + B1[thin space (1/6-em)]ln[thin space (1/6-em)]Ce values of B1 and KT were calculated from the plot of qe against ln[thin space (1/6-em)]Ce. B1 4.4395 2.8558
KT (L mg−1) 1863.1 38[thin space (1/6-em)]561.1
R2 0.945 0.910
Dubinin–Radushkevich ln[thin space (1/6-em)]qe = ln[thin space (1/6-em)]Qs2(1/n) ln[thin space (1/6-em)]Ce values of Qm and B were calculated from the plot of ε2 against ln[thin space (1/6-em)]qe. Qs (mg g−1) 41.96 35.27
B × 10−7 −0.4 −0.2
E 3536 5000
R2 0.783 0.993


3.8. Adsorption kinetics study

The kinetic of reactions in adsorption process is strongly influenced by several parameters related to the state of the solid and to the physico-chemical conditions under which sorption is occurred. To investigate the sorption processes of Al3+ ions onto the adsorbent, different kinetics models such as pseudo-first-order, pseudo-second-order, Elovich and intraparticle diffusion models were studied.17,35,37 The various parameters were calculated from the plots of the kinetic model equations (Table 6). Among these models, the criterion for their applicability is based on the judgment on the respective correlation coefficient (R2) and agreement between experimental and calculated values of qe. The high values of R2 (0.989) and good agreement between two qe values indicate that this adsorption system follows pseudo-second-order kinetic model which was developed based on the assumption that limiting step may be a chemisorption process. In this model, the second-order rate constant of adsorption (k2) decreases in direction corresponding to increasing equilibrium adsorption time.
Table 6 Kinetic parameters for the adsorption of Al3+ ions onto NBATSPED-MWCNT adsorbent
Model Parameters Value
10 mg L−1 15 mg L−1
Pseudo-first-order kinetic k1 (min−1) 0.944 0.887
qe (mg g−1) 33.24 48.68
R2 0.661 0.820
Pseudo-second-order kinetic k2 (min−1) 0.0374 0.0177
qe (mg g−1) 24.93 40.48
R2 0.983 0.989
Intraparticle diffusion Kdiff (mg g−1 min−1/2) 6.152 11.306
C (mg g−1) 7.160 7.2465
R2 0.979 0.982
Elovich β (g mg−1) 0.949 01136
α (mg g−1 min−1) 75.52 65.04
R2 0.949 0.981
qe (exp) (mg g−1) 20.98 31.99


3.9. Comparison of this adsorbent and method with literature

A comparative analysis of Al3+ ions adsorption capacity of different adsorbents is reported in Table 7. As observed, the NBATSPED-MWCNT is a prospective adsorbent compared to others for Al3+ ions removal. The contact time (3 min) considered in this work is considerably shorter than that in other works (Table 7). Therefore, the ultrasound-assisted Al3+ ions removal is a promising method over others for Al3+ ions removal.
Table 7 Comparison to literature
Adsorbent Contact time (min) Adsorption capacity (mg g−1) Reference
NBATSPED-MWCNT 3 46.74 This work
Date-pit activated carbon 20 5.831 38
BDH activated carbon 20 6.562 38
Chemically treated African beech sawdust 150 0.854 39
Raw African beech sawdust 120 1.913 39


4. Conclusion

In this work, we observed that the spectrophotometric method as an efficient, fast and cost-effective method for measuring the final concentration of Al3+ ions via complexation with eriochrome cyanine. A successful removal of Al3+ ions was found using a novel sorbent prepared by covalently anchoring N-(3-(trimethoxysilyl)-propyl)ethylenediamine and 2-nitrobenzaldehyde on multiwalled carbon nanotubes. The influences of experimental parameters and their possible interactions on the Al3+ ions removal percentage were successfully investigated by experimental design methodology. The optimization was performed using CCD combined with DF and GA. Among isotherm models investigated for the adsorption process, the equilibrium data were well described by the Langmuir model. Adsorption kinetic data were well fitted with pseudo-second-order models. The very rapid (3 min) adsorption process assisted by ultrasound proved the well applicability of this work for the removal of Al3+ ions.

Acknowledgements

The authors are grateful for financial support from the research council of the Yasouj University. The authors acknowledge financial support from the Iran National Science Foundation (INSF).

References

  1. J. Lee, H. Kim, S. Kim, J. Y. Noh, E. J. Song, C. Kim and J. Kim, Dyes Pigm., 2013, 96, 590–594 CrossRef CAS PubMed.
  2. H. M. Park, B. N. Oh, J. H. Kim, W. Qiong, I. H. Hwang, K.-D. Jung, C. Kim and J. Kim, Tetrahedron Lett., 2011, 52, 5581–5584 CrossRef CAS PubMed.
  3. S. Kim, J. Y. Noh, K. Y. Kim, J. H. Kim, H. K. Kang, S.-W. Nam, S. H. Kim, S. Park, C. Kim and J. Kim, Inorg. chem., 2012, 51, 3597–3602 CrossRef CAS PubMed.
  4. S. Vallejos, A. Muñoz, S. Ibeas, F. Serna, F. Garcia and J. M. Garcia, ACS Appl. Mater. Interfaces, 2014, 7, 921–928 Search PubMed.
  5. F. Fu and Q. Wang, J. Environ. Manage., 2011, 92, 407–418 CrossRef CAS PubMed.
  6. Y.-X. Zhang, Y. Jia, Z. Jin, X.-Y. Yu, W.-H. Xu, T. Luo, B.-J. Zhu, J.-H. Liu and X.-J. Huang, CrystEngComm, 2012, 14, 3005–3007 RSC.
  7. S. Hajati, M. Ghaedi and S. Yaghoubi, J. Ind. Eng. Chem., 2015, 21, 760–767 CrossRef CAS PubMed.
  8. M. Ghaedi, H. Mazaheri, S. Khodadoust, S. Hajati and M. K. Purkait, Spectrochim. Acta, Part A, 2015, 135, 479–490 CrossRef CAS PubMed.
  9. M. Ghaedi, M. Shahamiri, S. Hajati and B. Mirtamizdoust, J. Mol. Liq., 2014, 199, 483–488 CrossRef CAS PubMed.
  10. M. Ghaedi, E. Alam Barakat, A. Asfaram, B. Mirtamizdoust, A. A. Bazrafshan and S. Hajati, RSC Adv., 2015, 5, 42376–42387 RSC.
  11. M. Ghaedi, S. Y. S. Jaberi, S. Hajati, M. Montazerozohori, A. Asfaram and M. Zare, IEEE Sens. J., 2015, 15, 2974–2983 CrossRef CAS.
  12. M. Ghaedi, S. Y. Shajaripour Jaberi, S. Hajati, M. Montazerozohori, M. Zare, A. Asfaram, L. K. Kumawat and V. K. Gupta, Electroanalysis, 2015, 27, 1516–1522 CrossRef CAS PubMed.
  13. M. Ghaedi, H. A. Larki, S. N. Kokhdan, F. Marahel, R. Sahraei, A. Daneshfar and M. Purkait, Environ. Prog. Sustainable Energy, 2013, 32, 535–542 CrossRef CAS PubMed.
  14. A. Duran, M. Tuzen and M. Soylak, J. Hazard. Mater., 2009, 169, 466–471 CrossRef CAS PubMed.
  15. M. Ghaedi, S. Haghdoust, S. N. Kokhdan, A. Mihandoost, R. Sahraie and A. Daneshfar, Spectrosc. Lett., 2012, 45, 500–510 CrossRef CAS PubMed.
  16. M. Ghaedi, S. Hajati, M. Zare, M. Zare and S. Y. Shajaripour Jaberi, RSC Adv., 2015, 5, 38939–38947 RSC.
  17. M. Ghaedi, A. Hassanzadeh and S. N. Kokhdan, J. Chem. Eng. Data, 2011, 56, 2511–2520 CrossRef CAS.
  18. M. Ghaedi, A. Najibi, H. Hossainian, A. Shokrollahi and M. Soylak, Toxicol. Environ. Chem., 2012, 94, 40–48 CrossRef CAS PubMed.
  19. M. Ghaedi, A. Shokrollahi, H. Hossainian and S. N. Kokhdan, J. Chem. Eng. Data, 2011, 56, 3227–3235 CrossRef CAS.
  20. M. Ghaedi, H. Khajehsharifi, A. H. Yadkuri, M. Roosta and A. Asghari, Toxicol. Environ. Chem., 2012, 94, 873–883 CrossRef CAS PubMed.
  21. M. Ghaedi, M. Montazerozohori, M. N. Biyareh, K. Mortazavi and M. Soylak, Int. J. Environ. Anal. Chem., 2013, 93, 528–542 CrossRef CAS PubMed.
  22. M. Ghaedi, M. Montazerozohori, E. Nazari and R. Nejabat, Hum. Exp. Toxicol., 2013, 32, 687–697 CAS.
  23. M. Ghaedi, M. Montazerozohori, N. Rahimi and M. N. Biysreh, J. Ind. Eng. Chem., 2013, 19, 1477–1482 CrossRef CAS PubMed.
  24. M. Roosta, M. Ghaedi, N. Shokri, A. Daneshfar, R. Sahraei and A. Asghari, Spectrochim. Acta, Part A, 2014, 118, 55–65 CrossRef CAS PubMed.
  25. M. Roosta, M. Ghaedi, A. Daneshfar, R. Sahraei and A. Asghari, Ultrason. Sonochem., 2014, 21, 242–252 CrossRef CAS PubMed.
  26. M. Asadollahzadeh, H. Tavakoli, M. Torab-Mostaedi, G. Hosseini and A. Hemmati, Talanta, 2014, 123, 25–31 CrossRef CAS PubMed.
  27. C. Kütahyalı, Ş. Sert, B. Çetinkaya, E. Yalçıntaş and M. B. Acar, Wood Sci. Technol., 2012, 46, 721–736 CrossRef.
  28. K. Yetilmezsoy and S. A. Abdul-Wahab, Desalination, 2014, 344, 171–180 CrossRef CAS PubMed.
  29. S. Khodadoust and M. Hadjmohammadi, Anal. Chim. Acta, 2011, 699, 113–119 CrossRef CAS PubMed.
  30. B. Zhang, Y. Xu, Y. Zheng, L. Dai, M. Zhang, J. Yang, Y. Chen, X. Chen and J. Zhou, Nanoscale Res. Lett., 2011, 6, 431–440 CrossRef PubMed.
  31. Y. Liu, G. Cui, C. Luo, L. Zhang, Y. Guo and S. Yan, RSC Adv., 2014, 4, 55162–55172 RSC.
  32. A. Asfaram, M. Ghaedi, S. Hajati, A. Goudarzi and A. A. Bazrafshan, Spectrochim. Acta, Part A, 2015, 145, 203–212 CrossRef CAS PubMed.
  33. S. Sajjadi, H. Ghourchian, H.-A. Rafiee-Pour and P. Rahimi, J. Iran. Chem. Soc., 2012, 9, 111–119 CrossRef CAS.
  34. R. Das, S. Bee Abd Hamid, E. Ali, S. Ramakrishna and W. Yongzhi, Curr. Nanosci., 2015, 11, 23–35 CrossRef.
  35. M. Ghaedi, B. Sadeghian, A. A. Pebdani, R. Sahraei, A. Daneshfar and C. Duran, Chem. Eng. J., 2012, 187, 133–141 CrossRef CAS PubMed.
  36. S. Hajati, M. Ghaedi, B. Barazesh, F. Karimi, R. Sahraei, A. Daneshfar and A. Asghari, J. Ind. Eng. Chem., 2014, 20, 2421–2427 CrossRef CAS PubMed.
  37. M. Toor and B. Jin, Chem. Eng. J., 2012, 187, 79–88 CrossRef CAS PubMed.
  38. A. B. Albadarin, C. Mangwandi, H. Ala'a, G. M. Walker, S. J. Allen and M. N. Ahmad, Chem. Eng. J., 2012, 179, 193–202 CrossRef CAS PubMed.
  39. S. A. Al-Muhtaseb, M. H. El-Naas and S. Abdallah, J. Hazard. Mater., 2008, 158, 300–307 CrossRef CAS PubMed.

This journal is © The Royal Society of Chemistry 2015