DOI:
10.1039/C5RA08717A
(Paper)
RSC Adv., 2015,
5, 52361-52368
PVDF layer as a separator on the solution-side of air-cathodes: the electricity generation, fouling and regeneration†
Received
11th May 2015
, Accepted 8th June 2015
First published on 8th June 2015
Abstract
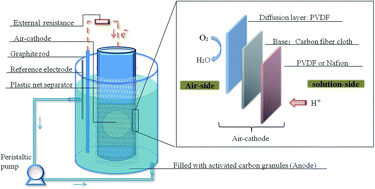
Cost effective air-cathodes are very important for application of Microbial Fuel Cells (MFCs). Carbon fiber cloth was used as the base for preparing air-cathodes with cheap polyvinylidene fluoride (PVDF) coating on the solution-side to replace expensive Nafion as a separator regardless of the ion exchange part. The separator on the solution-side was a vital part for stable electricity generation. Another PVDF layer was coated on the air-side via a thickness-controllable method as the diffusion layer. The comparisons between Nafion and PVDF on the solution-side of cathode in electricity generation and fouling/regeneration were tested in MFCs without any catalyst. The cell voltage of the Nafion air-cathode MFC (0.23 V) was slightly higher than the PVDF MFC (0.2 V). Biofouling and cation deposition on air-cathodes became more severe with time, negatively affecting electricity generation. Soaking the air-cathode with solution-side Nafion in HCl (maximum power density: 338.1 mW m−2) can regenerate the cathodes and enhance the electricity generation much more than that regenerated by ultraviolet light (UV) irradiation.
1. Introduction
In typical two-chambered microbial fuel cells (MFCs), the anode chamber and cathode chamber are separated and a polymeric proton exchange membrane (PEM) is used. In anode chambers, the electricigens metabolize various organic matters and generate electricity.1 In cathode chambers, necessary aeration of aqueous solution presents the main drawback of this kind of MFC, that energy is consumed to provide dissolved oxygen, similar to wastewater treatment with activated sludge in membrane bioreactors, which typically requires 0.6 kW h m−3, with up to 50% of this energy used for aeration.2 In air-cathode MFCs, aeration is eliminated and cost lowered, that oxygen from air permeates through the cathodes and is reduced at the cathodes, combines with proton from solution either through the PEM on solution-side of air cathodes3 or without PEMs for enhanced power generation.4,5 Air-cathode MFCs have been demonstrated in successfully recovering energy from biomass wastes and wastewater.6–9
It is critical to develop MFCs with lower cost of air cathodes for commercial application, which is expected from using inexpensive PEM/binder and catalyst or even without catalyst, while maintaining reasonable power generation level. Air-cathodes with a diffusion layer and catalyst/PEM layer as a strong candidate significantly improve MFC performance with simultaneously decreased water loss.10,11 There have been studies to replace the expensive polytetrafluoroethylene (PTFE) with the cheap polyvinylidene fluoride (PVDF) as the diffusion layer and the power output was relatively good.12,13 As PVDF is widely used due to its high hydrophobicity, chemical resistance against most solvents and relatively inexpensive cost. When it comes to the catalyst/PEM layer, the most commonly used is Nafion, due to its good proton conductivity and stability for catalyst that Nafion can serve as both catalyst binder and PEM.4,12,14 Efforts have been made to reduce the cost of this layer by replacing Nafion with PTFE15 or using PVDF as catalyst binder together with a PEM to work as catalyst/PEM layer.16–18 Ma et al. reported temporal variation of cathode performance (0.5 mg Pt cm−2) coated with different commercial separators including Nafion, polyethersulfone and the different fouling effects were discussed.19 Little is studied when using PVDF to replace Nafion on the solution-side, without PEM addition or catalyst, to study the importance of the separator (regardless of the ion exchange function) for stable electricity generation. This simple configuration shows more promise for application and the absence of catalyst helps to investigate the function of cathodes.
In air-cathode MFCs, a steady power generation in a long-term operation is hard to guarantee due to biofouling and salt precipitation.3,14 Biofouling,20 the deposition and accumulation of microorganisms, colloids, solutes, and cell debris, is undesirable for air cathodes.19 The biofouling on the cathode may consume the oxygen diffused through the membrane.4,19,21 Cations once precipitate on the cathode, occupy negatively charged groups of PEM and consequently reduce proton transfer.3,21 Biofouling and cations deposition together are identified as the main causes of cathode fouling in this study. Overall, the accumulated biofouling and cations lead to greater electrical resistance.22
Therefore, the purpose of this research is to prepare a cost effective air-cathode by replacing Nafion with PVDF on the solution-side and coating PVDF layer on the air-side of carbon fiber cloth as the diffusion layer. The PVDF layer on the solution-side was used as a separator (and as anion exchange membrane in the Nafion case) to investigate the importance of the separator (regardless of the ion exchange function) for stable electricity generation. The diffusion layer was for oxygen diffusion and water leakage prevention, and the thickness of this PVDF layer was accurately controlled during the casting procedure with a thickness-controllable coating knife via phase inversion approach. Recently, there was reports appeared using phase inversion in coating PVDF for air-cathodes.23 The electricity generation, fouling and regeneration of cathodes in Nafion and PVDF MFCs were compared. The fouling of air-cathode and the regeneration of fouled air-cathodes (soaking in HCl or irradiation with UV) were studied and operation conditions were investigated.
2. Experimental
2.1 Preparation of the cathodes
The cathodes (9.82 cm2) were made of carbon fiber cloth (240 g m−2, Yixing Red Nations High Performance Fiber Products CO., LTD, China) coated with PVDF diffusion layer on the air-side, and Nafion or PVDF layer on the solution-side (Fig. 1). The PVDF diffusion layer was prepared by coating the carbon fiber cloth with a solution containing 12% PVDF and 88% N-methyl-2-pyrrolidone (the solution was stirred for 2 hours using a magnetic bar and then sat for 2 hours before coating) uniformly with a thickness-controllable coating knife, followed by the immersion of the coated cloth in water for 2 hours to remove the solvent (phase inversion method). Allow it to air-dry overnight. Cathodes with various PVDF thicknesses (0.8 mm, 1.0 mm, 1.2 mm and 1.5 mm, respectively) were tested for optimizing. The carbon fiber cloth with the optimized PVDF thickness was referred as C0.
 |
| Fig. 1 Preparation of the air-cathode MFC system in this study. | |
The Nafion mixture solution contained 0.2 mL DI water, 1.6 mL Nafion (5% Nafion, Sigma, USA) and 0.8 mL isopropanol. The mixture was stirred for 5 minutes using a magnetic bar and was coated on the other side of cathode C0 by dripping. Allow it to air-dry for 3 hours (Fig. 1). This cathode was labeled as C1 in the following section.
The mixture of 6% PVDF and 94% N-methyl-2-pyrrolidone was stirred for 2 hours using a magnetic bar and was dripped on the solution side of cathode C0 (Fig. 1). It was immersed in water for 2 hours and then air-dried overnight. This cathode was labeled as C2.
2.2 MFC construction
Single chamber cylindrical air-cathode MFCs were constructed, the anode chamber has a net liquid volume of 850 mL and a tubular hollow air-cathode was put in the center of the cylinder reactor. The annular space between the air-cathode and the outer wall of the anode chamber was filled with activated carbon granules (diameter: 2 mm; length: 3–6 mm) and a graphite rod (diameter: 8 mm) was used to collect electrons. Anodes were pre-acclimated in other reactors and transferred to reactors with new air-cathodes. The anode and cathode were connected using stainless steel wire and a load of external resistance of 500 Ω. The air-cathode was set in the middle of the anode chamber vertically. A tubular-shaped plastic mesh was used to separate the cathode from the activated carbon granules. The MFCs with cathode C1 and C2 were designed as MFC1 and MFC2, respectively. The medium was simulate wastewater containing 3 g L−1 sucrose, 3.83 g L−1 sodium acetate, 0.573 g L−1 NH4Cl, 0.139 g L−1 K2HPO4, 0.048 g L−1 KH2PO4, 0.05 g L−1 CaCl2 and 0.1 g L−1 MgSO4 in tap water.
2.3 MFC operation
The two MFCs were operated under the same condition. At the beginning of a batch cycle, 850 mL wastewater was fed into the MFCs. As illustrated in Fig. 3 Period I, each day 5 mL wastewater was added into the MFC for 18 days and in the next 12 days no water was fed. During Period II, the MFCs were under fed-batch mode (the first batch cycle lasted 9 days, the second lasted 13 days). During Period III, MFCs were operated under fed-batch mode (10 days) with water circulation using peristaltic pumps, that the solution from the bottom of the anode chamber was pumped to the top in the anode chamber at different speed (rpm: 3, 6 and 1 respectively). Peristaltic pumps were operated in 5 min “on” and 1 min “off” mode by time switch. During Period IV (10 days), half of each cathode remained in the MFCs, peristaltic pumps worked at speed of 1 rpm (1.52 ± 0.2 mL min−1) under fed-batch mode. In Period V, the remained half cathodes were treated under UV (254 nm germicidal) for 1 hour, washed with deionized water and put back in the MFCs to run for 8 days under the same condition as in Period IV. After that, the cathodes were immersed in the 0.06 M HCl for 30 hours, washed with deionizer water and put back in the MFCs in the same way described above.
2.4 Measurements and electro-chemical analysis
The measurements of water qualities in MFCs like chemical oxygen demand (COD), concentrations of ammonium (NH4+–N) and total phosphate (TP) were carried out according to the standard methods.24
The voltage (U) across an external resistor (500 Ω) in the MFC circuit and the electrode potential were monitored by the data acquisition system (PISO-813, Taiwan) connected to a computer. The current (I, A) was calculated by I = U/R where R is the external resistance (Ω) and U is the voltage across the resistor. The power output of the cell (P, W) was calculated as P = UI and normalized by cathode area. The polarization curve was obtained by varying the external resistance over a range of 1–9999 Ω and recording the voltage by a multi-meter. The curves normalized to the cathode surface area for comparison. During the power curve measurements, the voltage over each external resistance was recorded using a multimeter until steady state was reached (about 5–10 min). The internal resistance was calculated by the polarization curve slope method, according to which, the slope of the fit line of voltage and current is the internal resistance.
Cyclic voltammetry (CV) was performed using an electrochemical workstation (CHI600E, Shanghai) with a three-electrode test system consisting of a working electrode, a counter electrode and a reference electrode (scan rate of 10 mV s−1). The analysis of the cathode material (abiotic) was conducted by CV with the cathode as the working electrode, a Pt sheet (surface area 1 cm2) as the counter electrode and a saturated calomel electrode (type of 232, 0.2244 V vs. SHE) as the reference electrode in 0.2 M NaCl. The cathodic biofilms in the MFCs was also analyzed by CV, with the bio-cathode as the working electrode, the anode as the counter electrode and a saturated calomel electrode as the reference electrode.
2.5 Cathode oxygen permeability, characterization, fouling and regeneration
Oxygen permeability affects the performance of MFC system, it is important for investigating air cathode property. Oxygen concentrations were monitored with a non-consumptive dissolved oxygen probe (FDO-925 DO meter, WTW, Germany) which was fixed in the middle of the anode chamber (no microorganisms inoculated). The detection range of dissolved oxygen concentration is from 0.00 to 20.00 mg L−1. The deionizer water (600 mL) in the anode chamber was aerated with N2 for half an hour to remove oxygen. Dissolved oxygen concentrations were recorded for 5 hours after exposure to air. Oxygen permeability over cathode C0 was characterized by a mass transfer coefficient, k (cm s−1), defined by eqn (1):10 |
 | (1) |
where v is the volume of the anode chamber (600 mL), A is the area of the cathode (9.8125 cm2), C is the bulk oxygen concentration in the anode chamber at time t, and Cs is the concentration at the air-side of the cathode (assumed to the saturated dissolved oxygen concentration in water, 7.8 mg L−1). The diffusion coefficient (D) of the cathode can be estimated as D = kL, where L is the thickness of the PVDF water proof layer (0.8 mm, 1.0 mm, 1.2 mm and 1.5 mm, respectively) on the cathode as the carbon fiber clothe cathode is porous that can hardly affects the oxygen diffusion.
The biofilm on the solution side of the cathode was observed and quantified by scanning electron microscope (SEM, QUANTA 200F, FEI) and Energy Dispersive X-ray Spectrometer (EDX, EDAX, USA).
Regeneration of fouled cathode was carried out by soaking in HCL solution for 30 hours or UV irradiation for 1 hour. The UV light source was a 20 W germicidal low-pressure mercury lamp with a main wavelength of 254 nm and the light intensity was 297 μW cm−2 (with Al reflector surrounding the cathode and the lamp).
3. Results and discussion
3.1 Optimal thickness of PVDF diffusion layer on the air-side of carbon fiber cloth
The PVDF diffusion layer was coated on the air-side of the carbon fiber cloth via a phase inversion approach and the thickness of PVDF was accurately controlled by the thickness-controllable casting knife during the casting procedure. The PVDF diffusion layer on the air-side was for oxygen diffusion and water leakage prevention.
Increasing thickness of the PVDF layer on the cathode (air side) adversely affected the oxygen permeability (Fig. 2). The diffused oxygen level through the cathode increased slowly after the first 4 hours' rapid growth. The oxygen mass transfer coefficient (k) for the cathode with a PVDF thickness of 0.8 mm was 0.924 × 10⁻³ cm s−1 (Table 1). The k was negatively affected by the thickness, when the thickness of PVDF was 1.2 mm, k decreased to 0.593 × 10⁻³ cm s−1 (by 36%). These values of mass transfer coefficients are comparable to those studies previously reported.10 In addition, the comparison of MFCs with different thicknesses of PVDF layer had been studied, as shown in ESI† that the MFC with the cathode coated with 1.2 mm thickness PVDF showed the best performance (Fig. S1C, F and G†). As a result, the cathode with 1.2 mm thickness PVDF was chosen to be the cathode C0 in this study. The concentrations of dissolved oxygen inside MFC with these cathodes were monitored. The distance between the dissolved oxygen probe and the cathode was 1 cm. No oxygen can be detected, suggesting that the microbes on the cathode and in the anode chamber were consuming oxygen diffusing through the membrane while oxidizing substrate in the anode chamber. This air-cathode can ensure the anaerobic circumstances in the anode chamber.
 |
| Fig. 2 Concentration of diffused oxygen through cathodes of various PVDF thicknesses. | |
Table 1 Thickness of PVDF layer on the air side and the oxygen mass transfer coefficient (k) and the resistance
PVDF thickness (mm) |
0.8 |
1.0 |
1.2 |
1.5 |
0.0 |
k × 10−3 (cm s−1) |
0.924 ± 0.166 |
0.746 ± 0.82 |
0.593 ± 0.143 |
0.471 ± 0.107 |
— |
Surface resistance (Ω cm−1) |
4.4 ± 0.9 |
8.4 ± 0.7 |
8.8 ± 1.2 |
11.9 ± 1.9 |
3.7 ± 0.6 |
3.2 The vital role of a separator on the solution-side of air-cathode
The air-cathodes with diffusion layer on the air-side and no layers on the solution-side were tested in MFCs. The cell potential, cathode potential and anode potential (ESI, Fig. S1†) showed that cathodes with no solution-side layer did work as air-cathode, but the cell voltage of MFCs decreased rapidly to zero (details see ESI†). Air-cathodes with no solution-side layer suffer from biofilms formation on the surfaces because the substrates and bacteria easily reach the cathodes without hindrance.25 The separator on the solution-side is vital for stable electricity generation. As a result, the air-cathode must have double-side coatings.
In MFC1, the air-cathode was coated by Nafion (as both the PEM and the separator) on the solution-side and PVDF diffusion layer on the air-side. In MFC2, PVDF (as separator) is on the solution-side and PVDF diffusion layer is on the air-side.
3.3 Operation conditions and MFC performance with different air-cathodes
3.3.1 Wastewater treatment and electricity generation at a low concentration of COD. The concentration of COD, NH4+ and TP was shown in Fig. 3 that the degradation was relatively slow compared with other studies. The fed-batch cycle time in this study was typically 10 days long, which was longer than those MFCs fed with domestic wastewater (3.7 days)26 and acetate (3.1 days)27 due to the bigger volume of MFC (850 mL net volume) and the slow degradation of organic matters by microbes. Usually, influent COD concentrations with domestic wastewater range from 50 to 11
100 mg L−1 in continuous flow tests.26,28–31
 |
| Fig. 3 Time courses of operational parameters in MFCs. (A) The concentration of COD and the operation period. (B) The cell potentials. (C) The concentration of NH4+ (solid) and TP (hollow). (D) Conductivity (solid) and temperature (hollow). Vertical dashed lines indicate the time points when 80 mL influent was fed. | |
The cell potentials were marginally affected by the COD variation (from 200 to 50 mg L−1, Fig. 3A). In Period II, the cell potential decreased when the concentration of COD dropped (COD ≤ 50 mg L−1, Fig. 3).
3.3.2 Fed-batch mode and solution circulation were good for electricity generation (discussed in Period II, III and IV). The cell potentials of both MFCs fluctuated when the wastewater was fed every day in Period I. And in the first batch cycle of Period II (add 50 mL simulate wastewater every 10 days), the average cell potential increased by 1% in MFC1 and 162% in MFC2 (Fig. 3B). This was probably due to the dissolved oxygen in the waste water or the disturbance of the microbial community by the wastewater in high concentration.MFCs were operated under fed-batch mode at various solution circulation speeds: 3, 6 and 1 rpm, respectively (Fig. 3A). Both the cell potentials dropped when the flow speed was changed from 3 to 6 rpm, and increased when the speed was changed to 1 rpm (Fig. S2†). The cell potentials reach the highest (enhanced by 9% in MFC1 and 13% in MFC2, Fig. 3), compared with that under fed-batch mode, in spite of the influence of COD concentration. The circulation improves the cathode performance by enhancing protons transport as the circulation is from the bottom to the top of the MFCs (the air-cathode is on the top). Feeding at 1 rpm, the cathode potential in MFC1 was lower than that at the speed of 3 rpm: the reason may be the PVDF membrane fouling that will be discussed in Section 3.4.
In Period IV, the MFCs were operated at a fixed circulation speed of 1 rpm with half the air-cathode (from 9.82 cm2 to 4.91 cm2) as the other half cathode was cut off for SEM at the end of Period III (Fig. 4). Since the area of cathodes was reduced, the power densities of MFC1 and MFC2 decreased by 6.91% and 39.16%, respectively (calculated by average data in Fig. 3B). The power output of MFCs is constricted by the smaller surface area of the cathode.32–34
 |
| Fig. 4 Top: SEM images of cathode coated with Nafion (A1 and A2), blank cathode (B1 and B2) and cathode coated with PVDF (C1 and C2). Bottom: atomic distribution of three used air-cathodes measured by SEM-EDX to compare the cation occupation ratio among the three samples. The inset shows the same measurement on an adapted scale. | |
3.4 Biofilm on air-cathode affected electricity generation
The bacteria on the air-cathode is complicated and its dual roles as biocathode and biofouling have been extensively studied.19,35 For the blank used cathode without solution-side coating, it was wrapped by colloids microbes (Fig. 4B2), that the electron transport may be affected by potentially competition from non-electrogenic bacteria.36 On the one hand, too much biofilm accompanied with cations deposition on the air-cathode slowly decreased the electricity generation by hindering the necessary transfer of oxygen and proton and subsequently increase its resistance.22,25 This was probably the reason why MFCs with no solution-side layer on the cathode could not generate electricity for a longer time. Even though there were more microbes (Fig. 4A2 and C2) on coated Nafion or PVDF than the blank cathode (Fig. 4B2). The layer separated the biofilm from carbon fibers, critical for rapid decline of electricity generation (see ESI†). On the other hand, certain amount of biofilm formed on the cathodes can reduce oxygen transfer into the anolyte, increase coulombic efficiency, reduce the polarization resistance and even served as bioelectrocatalysts for ORR.14,37 These may explain the comparable power output in Fig. S1B and C† and the beginning of the run (see ESI†).
The atomic percentages of O and P were 11.4% and 0.66% on the Nafion cathode in MFC1; 28.52% and 7.98% on PVDF cathode in MFC2, respectively (Fig. 4). Though part of the scaled O may come from the phosphate, the remnant O on the Nafion cathode was still less than that on the PVDF cathode. It verified the claim that there were more microorganisms on the surface of the PVDF cathode as the atomic percentages of O and P were higher than that on the Nafion cathode.
The internal resistance of MFC1 increased from 248.4 Ω to 282.0 Ω and that of MFC2 increased from 310 to 374 Ω (in 15 days, Table 2), while the cell voltages of the two MFCs did not decrease during this time (Fig. 3B). From Period II to Period III (3 rpm), the maximum power density decreased from 146.8 to 116.2 mW m−2 in MFC1 and increased from 78.3 to 84.8 mW m−2 in MFC2 (Fig. 5). These results were the combined effect of air-cathode fouling over time and solution circulation in Period III.
Table 2 Comparison of internal resistance and maximum power density in MFCsab
Period |
Nafion |
PVDF |
Half-cathode Nafion |
Half-cathode PVDF |
R |
PDmax |
R |
PDmax |
R |
PDmax |
R |
PDmax |
R: internal resistance Ω. PDmax: maximum power density mW m−2. |
Period II |
248 |
146.8 |
310 |
78.3 |
|
|
|
|
Period III |
282 |
116.2 |
374 |
84.8 |
|
|
|
|
Period V-after UV day 73 |
|
|
|
|
306 |
231.8 |
472 |
117.7 |
Period V-after UV day 78 |
|
|
|
|
328 |
114.5 |
516 |
126.6 |
Period V-after UV day 79 |
|
|
|
|
271 |
198.6 |
560 |
97.7 |
Period V-after HCl |
|
|
|
|
158 |
338.1 |
509 |
119.6 |
 |
| Fig. 5 Polarization curves of MFC1 (Nafion) and MFC2 (PVDF) in Period II (day 41), Period III (day 56). | |
In Period V, the internal resistance of MFC1 increased from 306 to 328 Ω (from day 73 to day 78, Table 2) under the wastewater circulation fed-batch mode, indicating that air-cathode fouling leads to an increase in internal resistance after a long operation time. Similar results had been monitored in MFC2 and other studies too.3,14,25
3.5 Regeneration of fouled cathodes
The cell voltage, cathode potential and anode potential of MFC1 and MFC2 were recorded (Fig. S1†), to investigate the influence of UV irradiation and HCl soaking treatment on the electricity generation. The UV irradiation aims at sterilizing the biofilm attached on the air-cathode, while the HCl treatment aims at removing both the biofilm and cations deposited. The aerobic biofilm on the cathode consumes the crossover oxygen and physically block the proton transfer from the anode to the cathode, which reduces the MFC performance further. The cations in MFCs actively bind to the negatively charged functional groups that play a critical role in proton transfer through the membrane.25
In MFC2 with PVDF as separator, the average cell voltages increased almost the same (by 8.97%) after the UV and HCl treatment. Similar internal resistances, maximum power densities and cyclic voltammograms were detected (Table 2, Fig. S3†). In MFC2 the cations deposition have little effect on MFC performance compared with biofouling. Performances of air-cathode coated with PVDF change little after HCl and UV treatment (117.7 and 119.6 mW m−2, respectively). In MFC1 with Nafion as the separator and PEM, the average cell voltage increased by 1.75% after UV treatment and 7.46% after HCl treatment. The internal resistances were 306 Ω after UV treatment and 158 Ω after HCl treatment (Table 2). The maximum power density after HCl treatment (338.1 mW m−2) was 1.45 times higher than that after UV treatment. The polarization curves and the cyclic voltammograms after the two treatments showed significantly difference (Fig. S3†).
This clearly suggests that for the cathode coated with Nafion, the HCl treatment can greatly improve the performance compared with UV treatment. The cations deposition on the cathode is more detrimental to MFC performance than biofouling in MFC1. Internal resistance of the MFC using a Nafion membrane as the separator has been found increased because of the attachment of cations on sulfonate functional groups that prevented proton transfer, rather than membrane biofouling.3
4. Conclusions
It is necessary for the carbon fiber cloth air-cathode to have the double sides coated: the coating on solution-side guaranteed the stable electricity generation and the coating on the air-side as diffusion layer. As inevitable air-cathode fouling decreased the MFC performance when there was no layer on the solution-side. Lowering the costs of air-cathode materials by using cheap PVDF and no catalysts, PVDF was used to replace Nafion on the solution-side and PVDF diffusion layer was coated on the air-side via a simple phase inversion method. The thickness of PVDF layer on the air-side was accurately controlled with a thickness-controllable coating knife.
The cell voltage of the Nafion air-cathode MFC (0.23 V) was higher than that of the PVDF MFC (0.2 V). The air-cathode with solution-side Nafion could be restored by soaking in HCl solution, the cell potential increase 4.26 times higher than that restored by UV irradiation. The maximum power density reached the highest (338.1 mW m−2). Performances of air-cathode with solution-side PVDF did not change much after HCl and UV treatment (117.7 and 119.6 mW m−2, respectively).
Overall, Nafion is better than PVDF in almost every aspect. However, the average energy output reached 0.82 × 10⁻⁵ $ and 1.23 × 10⁻⁵ $, per cathode respectively in the PVDF and Nafion MFCs for 80 days. Assuming the electrode regeneration is synchronous, the reduction of energy output by replacing Nafion with PVDF is less, while the saving in cost is much more (Nafion and PVDF costs 7.625 $ and 0.004 $ per cathode, respectively). For future application, PVDF is a good candidate for air-cathode material though more rigorous investigations are required.
Acknowledgements
This research was supported by the China national natural science foundation (Project no. 21177018), and the Program of Introducing Talents of Discipline to Universities (B13012).
References
- B. E. Logan and K. Rabaey, Science, 2012, 337, 686–690 CrossRef CAS PubMed.
- P. L. McCarty, J. Bae and J. Kim, Environ. Sci. Technol., 2011, 45, 7100–7106 CrossRef CAS PubMed.
- M. J. Choi, K. J. Chae, F. F. Ajayi, K. Y. Kim, H. W. Yu, C. W. Kim and I. S. Kim, Bioresour. Technol., 2011, 102, 298–303 CrossRef CAS PubMed.
- H. L. B. E. Logan, Environ. Sci. Technol., 2004, 38, 4040–4046 CrossRef.
- W.-W. Li, G.-P. Sheng, X.-W. Liu and H.-Q. Yu, Bioresour. Technol., 2011, 102, 244–252 CrossRef CAS PubMed.
- M. Miyahara, K. Hashimoto and K. Watanabe, J. Biosci. Bioeng., 2013, 115, 176–181 CrossRef CAS PubMed.
- X. Xue, J. C. Tokash, F. Zhang, P. Liang, X. Huang and B. E. Logan, Environ. Sci. Technol., 2013, 47, 2085–2091 CrossRef PubMed.
- Q. Wen, F. Kong, H. Zheng, J. Yin, D. Cao, Y. Ren and G. Wang, J. Power Sources, 2011, 196, 2567–2572 CrossRef CAS PubMed.
- Y. A. Lijiao Ren and B. E. Logan, Environ. Sci. Technol., 2014, 4199–4206 Search PubMed.
- S. Cheng, H. Liu and B. E. Logan, Electrochem. Commun., 2006, 8, 489–494 CrossRef CAS PubMed.
- H. L. Shaoan Chen and B. E. Logan, Environ. Sci. Technol., 2006, 40, 364–369 CrossRef.
- Z. Qiu, M. Su, L. Wei, H. Han, Q. Jia and J. Shen, J. Power Sources, 2015, 273, 566–573 CrossRef CAS PubMed.
- L. Zhuang, S. Zhou, Y. Wang, C. Liu and S. Geng, Biosens. Bioelectron., 2009, 24, 3652–3656 CrossRef CAS PubMed.
- Y. Ahn, F. Zhang and B. E. Logan, J. Power Sources, 2013, 247, 655–659 CrossRef PubMed.
- B. Wei, J. C. Tokash, G. Chen, M. A. Hickner and B. E. Logan, RSC Adv., 2012, 2, 12751–12758 RSC.
- L. Zhang, C. Liu, L. Zhuang, W. Li, S. Zhou and J. Zhang, Biosens. Bioelectron., 2009, 24, 2825–2829 CrossRef CAS PubMed.
- M. Lu, S. Kharkwal, H. Y. Ng and S. F. Y. Li, Biosens. Bioelectron., 2011, 26, 4728–4732 CrossRef CAS PubMed.
- L. Zhuang, C. Feng, S. Zhou, Y. Li and Y. Wang, Process Biochem., 2010, 45, 929–934 CrossRef CAS PubMed.
- J. Ma, Z. Wang, D. Suor, S. Liu, J. Li and Z. Wu, J. Power Sources, 2014, 272, 24–33 CrossRef CAS PubMed.
- S.-R. C. Fangang Meng, A. Drews and M. Kraume, Water Res, 2009, 43, 1489–1512 CrossRef PubMed.
- M. C. Kyu Jung Chae, F. F. Ajayi, W. Park, I. S. Chang and I. S. Kim, Energy Fuels, 2008, 22, 169–176 CrossRef.
- J.-H. C. Hong-Joo Lee, J. Cho and S.-H. Moon, J. Membr. Sci., 2002, 203, 115–126 CrossRef.
- W. Yang, W. He, F. Zhang, M. A. Hickner and B. E. Logan, Environ. Sci. Technol. Lett., 2014, 1, 416–420 CrossRef CAS.
- American Public Health Association (APHA), American Water Works Association (AWWA) and Water Environment Federation (WEF), 21st edn, 2005.
- J. X. Leong, W. R. W. Daud, M. Ghasemi, K. B. Liew and M. Ismail, Renewable Sustainable Energy Rev., 2013, 28, 575–587 CrossRef CAS PubMed.
- Y. Ahn and B. E. Logan, Appl. Microbiol. Biotechnol., 2013, 97, 409–416 CrossRef CAS PubMed.
- Y. Ahn and B. E. Logan, Appl. Microbiol. Biotechnol., 2012, 93, 2241–2248 CrossRef CAS PubMed.
- B. E. L. Booki Min, Environ. Sci. Technol., 2004, 38, 5809–5814 CrossRef.
- F. Z. Sarah Hays and B. E. Logan, J. Power Sources, 2011, 196, 8293–8300 CrossRef PubMed.
- Z. Y. Liling Wei, M. Cui, H. Han and J. Shen, Int. J. Hydrogen Energy, 2012, 37, 1067–1073 CrossRef PubMed.
- G. C. P. Jung Rae Kim, F. R. Hawkes, J. Rodríguez, R. M. Dinsdale and A. J. Guwy, Bioresour. Technol., 2010, 101, 1190–1198 CrossRef PubMed.
- B. E. L. Sang-Eun Oh, Appl. Microbiol. Biotechnol., 2006, 70, 162–169 CrossRef PubMed.
- H. H. Yanzhen Fan and H. Liu, J. Power Sources, 2007, 171, 348–354 CrossRef PubMed.
- S. M. C. Hamid Rismani-Yazdi, A. D. Christy and O. H. Tuovinen, J. Power Sources, 2008, 180, 683–694 CrossRef PubMed.
- X.-W. Liu, X.-F. Sun, Y.-X. Huang, G.-P. Sheng, S.-G. Wang and H.-Q. Yu, Energy Environ. Sci., 2011, 4, 1422–1427 CAS.
- U. Karra, E. Troop, M. Curtis, K. Scheible, C. Tenaglier, N. Patel and B. Li, Int. J. Hydrogen Energy, 2013, 38, 5383–5388 CrossRef CAS PubMed.
- X.-W. Liu, W.-W. Li and H.-Q. Yu, Chem. Soc. Rev., 2014, 43, 7718–7745 RSC.
Footnote |
† Electronic supplementary information (ESI) available. See DOI: 10.1039/c5ra08717a |
|
This journal is © The Royal Society of Chemistry 2015 |
Click here to see how this site uses Cookies. View our privacy policy here.