Multi-scale study of hydrodynamics in an interconnected fluidized bed for the chemical looping combustion process

Shuai Wang*a, Juhui Chen*b, Huilin Lua, Guodong Liua and Liyan Suna
aSchool of Energy Science and Engineering, Harbin Institute of Technology, Harbin, 150001, China. E-mail: shuaiwang@hit.edu.cn; Fax: +86 0451 8622 1048; Tel: +86 0451 8641 2258
bSchool of Mechanical Engineering, Harbin University of Science and Technology, Harbin, 150080, China. E-mail: chenjuhui@hit.edu.cn; Fax: +86 0451 8639 0550; Tel: +86 0451 8639 0550

Received 8th May 2015 , Accepted 9th June 2015

First published on 9th June 2015


Abstract

During the chemical looping combustion (CLC) process, the gas–solid hydrodynamic behaviors have a direct influence on the stability of the reactor system and the combustion efficiency of the fuel. To gain a better insight into the CLC system, a multi-scale computational fluid dynamic (CFD) simulation is implemented with an integrated drag model considering the impact of bubbles and clusters under the framework of the two-fluid model. A cluster-structure dependent drag model and a bubble-structure dependent drag model are employed to describe the meso-scale effects caused by clusters and bubbles. By comparisons of the gas pressure profile, the model prediction agrees well with experimental results. The distributions of local structural parameters including velocities in the bubble and emulsion, bubble fraction and local velocities in clusters are analyzed.

1. Introduction

Chemical looping combustion (CLC) technology has attracted more and more attention owing its inherent CO2 separation and low NOx emissions.1–3 Hakonsen et al.4 tested the performance of Cu-based oxygen carriers on a lab-scale rotating bed reactor and evaluated the effects of process parameters including reactor temperature, gas flows and bed rotating frequency. It was pointed out that the optimal performance was restricted by nonadjustable factors. Cuadrat et al.5 investigated the impact of operating conditions on the combustion efficiency of CLC with coal. The results revealed that the coal conversion can be enhanced using a low solids circulation rate. Zheng et al.6 discussed the impact of gasification intermediate and temperature on the performance of CaSO4 oxygen carrier in a CLC process with carbon. It was found that increasing the reaction temperature aggravated the SO2 emission. The above researchers mainly focused on the performance of oxygen carriers under different conditions during the CLC process. In the CLC system, the complicated multiphase flow mechanics and hydrodynamic characteristics in reactors also greatly influence the whole reaction performance.

Computational fluid dynamics (CFD) provides a possibility for deep insight into flow mechanics in the CLC system.7–9 Kruggel-Emden et al.10 proposed an interconnected multi-phase model to demonstrate transient behaviors in a CLC system. The data exchange between different reactors was achieved by means of time-dependent boundary conditions. Guan et al.11 established a three-dimensional hydrodynamic model based on the two-fluid model and applied it to the investigation of an interconnected CLC fluidized bed. The impact of different drag models on flow behaviors was evaluated. The results revealed that the selectivity of drag model significantly influenced the flow behavior of oxygen carriers.

A CLC system comprises two reactors: fuel reactor (FR) and air reactor (AR). In general, these two reactors are designed as an interconnected system including a fast fluidized bed and a bubbling fluidized bed. In the fast fluidized bed, the cluster is regards as the meso-scale structure. Whereas in the bubbling fluidized bed, the bubble plays a similar role as the cluster in fast fluidized beds. As a result of the meso-scale structure effect caused by clusters and bubbles, the conventional drag model can not capture the heterogeneous feature of gas–solid flow in reactors.

In recent years, various of models have been developed to reflect the meso-scale effects.12–14 Li et al.15 proposed the energy minimization multi-scale (EMMS) method for the solution of multi-scale problems in multiphase flow. The heterogeneous drag coefficient was obtained by a sum of drag components at different scales of interaction. Yang et al.16 and Wang et al.17 extended the EMMS model to the simulations of typical fluidized beds. The results indicated that the model predictions had a significant improvement. Milioli et al.18 and Schneiderbauer et al.19 built filtered drag models to describe the unresolved structure effect by means of highly resolved simulations.

In our previous work, a cluster-structure-dependent (CSD) drag model was proposed to describe the heterogeneous gas–solid flow in fast fluidized beds, which was validated by simulating the high and low mass flux risers.20 Meanwhile, a bubble-structure-dependent (BSD) drag model for bubbling fluidized beds was established considering effects of bubble-induced added mass force and solid pressure.21 The above two models incorporated the impact of local structural parameters into the calculation of drag coefficient and revealed the dependence of the multi-scale drag coefficient on local structural parameters.

This paper focuses on the study of hydrodynamics in an interconnected fluidized bed for the CLC process by means of the multi-scale method. Under the framework of Eulerian–Eulerian two-fluid model, an integrated multi-scale model incorporating the CSD drag model and the BSD drag model is employed to describe the effects of different meso-scale structures in reactors. CFD simulations of an interconnected CLC fluidized bed are carried out. The distributions of local structural parameters including velocities in the bubble and emulsion, bubble fraction and local velocities in clusters are obtained. The variation of the cluster and bubble size with solids volume fraction in reactors is also analyzed.

2. Hydrodynamic model

In this work, the two-fluid model is employed as the basic framework of the multi-scale simulation. The granular kinetic theory is used for closure.22 It is assumed that the solid phase has a uniform size.

2.1. Gas–solid hydrodynamics

2.1.1. Mass conservation equations.
 
image file: c5ra08603e-t1.tif(1)
 
image file: c5ra08603e-t2.tif(2)
2.1.2. Momentum conservation equations.
 
image file: c5ra08603e-t3.tif(3)
 
image file: c5ra08603e-t4.tif(4)
where β is inter-phase drag coefficient and the detailed solution is described in the following Section 2.2. τg and τs denote stress tensors of gas and solid phases. ps represents solid pressure. At a high solid concentration, the frictional contributions to solid stress tensor and solid pressure require further consideration besides the kinetic contributions. Here, the friction stress model of Srivastava and Sundaresan23 is applied. The corresponding constitutive correlations are listed in Table 1.
Table 1 Constitutive correlations used in two-fluid model
1 Stress tensor image file: c5ra08603e-t12.tif (T1-1)
image file: c5ra08603e-t13.tif (T1-2)
2 Solid pressure image file: c5ra08603e-t14.tif (T1-3)
image file: c5ra08603e-t15.tif (T1-4)
image file: c5ra08603e-t16.tif (T1-5)
3 Solid shear viscosity image file: c5ra08603e-t17.tif (T1-6)
image file: c5ra08603e-t18.tif (T1-7)
image file: c5ra08603e-t19.tif (T1-8)
4 Bulk viscosity image file: c5ra08603e-t20.tif (T1-9)
5 Thermal conductivity of particles image file: c5ra08603e-t21.tif (T1-10)
6 Production of granular energy through slip between phases image file: c5ra08603e-t22.tif (T1-11)
7 Dissipation of fluctuation kinetic energy image file: c5ra08603e-t23.tif (T1-12)


2.1.3. Conservation equation of granular temperature.
 
image file: c5ra08603e-t5.tif(5)
where ks is the thermal conductivity of particles and given by eqn (T1-10). Dgs and γs represent the production of granular energy through slip between phases and the energy dissipation rate per unit volume, which are expressed as eqn (T1-11) and (T1-12).

2.2. Multi-scale drag model

In a fast fluidized bed and a bubbling fluidized bed, clusters and bubbles are treated as meso-scale structures respectively. Accordingly, a cluster-structure-dependent drag model and a bubble-structure-dependent drag model are separately established in our previous studies.20,21 In a fast fluidized bed, the local heterogeneous flow is resolved into three homologous sub-phases: particle-rich dense phase, gas-rich dilute phase and the interface between phases. By a sum of drag components in three sub-phases, we derive an effective drag with consideration of the cluster effect. The expression of an effective drag coefficient is written as follows:
 
image file: c5ra08603e-t6.tif(6)

For the CSD drag coefficient solution, eight independent structural parameters (εdil, εden, f, dc, Ug,dil, Ug,den, Us,dil, Us,den) are required by solving six eqn (T2-1)–(T2-6) in Table 2 and a stability criterion of the minimum energy dissipation consumed by drag force (T2-7).

Table 2 Cluster structure-dependent drag model
1 Balance equations image file: c5ra08603e-t24.tif (T2-1)
image file: c5ra08603e-t25.tif (T2-2)
image file: c5ra08603e-t26.tif (T2-3)
2 Equation for momentum equation of the dense phase image file: c5ra08603e-t27.tif (T2-4)
3 Equation for momentum equation of the dilute phase image file: c5ra08603e-t28.tif (T2-5)
4 Equation for pressure drop balance image file: c5ra08603e-t29.tif (T2-6)
5 Stability criterion by minimization of the energy dissipation by drag force image file: c5ra08603e-t30.tif (T2-7)


Similarly, the non-uniform local flow in a bubbling fluidized bed is resolved into bubble phase, emulsion phase and the interface, where it is assumed that there is no gas in the bubble phase. The BSD drag coefficient is expressed as follows:

 
image file: c5ra08603e-t7.tif(7)

To calculate the BSD drag coefficient, six independent parameters (δb, εe, Uge, Use, Ub, db) are solved by a set of nonlinear eqn (T3-1)–(T3-5) in Table 3 and one stability criterion (T3-6).

Table 3 Bubble structure-dependent drag model
1 Balance equations image file: c5ra08603e-t31.tif (T3-1)
image file: c5ra08603e-t32.tif (T3-2)
image file: c5ra08603e-t33.tif (T3-3)
2 Solid momentum equation in the emulsion phase along the flow direction image file: c5ra08603e-t34.tif (T3-4)
3 Pressure drop balance equation between gas in the emulsion phase and bubbles image file: c5ra08603e-t35.tif (T3-5)
4 Stability criterion by minimization of the energy dissipation by drag force image file: c5ra08603e-t36.tif (T3-6)


For high concentration of particles, the BSD drag coefficient is calculated in the range of (εmf, εd). εmf and εd represent the gas minimum fluidizing fraction and the voidage when the ratio of the BSD and Gidaspow drag coefficients22 equals 1.0. The Gidaspow drag coefficient is expressed as:

 
image file: c5ra08603e-t8.tif(8)

When this range is exceeded, the Gidaspow drag coefficient is used. Whereas at low solid volume fractions, the CSD drag coefficient is employed in the range of (εh 1). εh is the voidage when the ratio of the CSD and Gidaspow drag coefficients equals 1.0.

3. Model implement descriptions

In the current study, an interconnected CLC fluidized bed reactor on the experimental setup of Adanez et al.24 is chosen as the simulated objective, which consists of fuel reactor and air reactor. A loop seal is set up between the two reactors to prevent the mixing and leakage of two gas streams. A separator is used to transport the regenerated oxygen carriers to fuel reactor. Here, the flow rate of solid entering the FR depends on the entrainment of air reactor to reflect the effect of the unsteady mass flow into the FR and the diverting solids valve allowing the change of the solid flow rates is assumed to be negligible. The sketch of the system is shown in Fig. 1. The air reactor comprises a bubbling fluidized bed of 0.05 m bed diameter with bed height of 0.1 m, connected with a riser of 0.02 m in diameter and 1.0 m in height. The fuel reactor in form of a bubbling fluidized bed has a bed diameter of 0.05 m with bed height of 0.1 m. The solid particles have a mean density of 2470 kg m−3 and a diameter of 200 μm, belonging to Geldart-B particles. Detailed system descriptions and operating parameters are listed in Table 4.
image file: c5ra08603e-f1.tif
Fig. 1 Sketch of a CLC reactor system.
Table 4 System properties and parameters for the simulations
Description Unit AR FR
Reactor height m 0.15/1.0 0.25
Reactor diameter m 0.05/0.02 0.05
Particle diameter μm 200 200
Particle density kg m−3 2470 2470
Static bed height m 0.1 0.1
Initial concentration of particles 0.5 0.5
Inlet gas velocity m s−1 0.46/0.59 0.1
Inlet gas temperature K 300/300 300
Restitution coefficient of particles 0.9 0.9
Restitution coefficient of particle-wall 0.9 0.9
Specularity coefficient 0.5 0.5


At the initial state, the particles are filled with the initial solid inventory of 1.0 kg. The gas inlets locate at the bottom of reactors. The pressure-outlet is specified at the top of separator. For the wall, no-slip boundary condition is adopted for gas phase and the boundary condition of Johnson and Jackson25 is employed for the solid phase:

 
image file: c5ra08603e-t9.tif(9)
 
image file: c5ra08603e-t10.tif(10)
 
image file: c5ra08603e-t11.tif(11)

With respect to the computational domain, a two-dimensional simulation is performed using the M-FIX program, which is an open-source CFD code to describe the dense or dilute fluid–solid flows with interphase exchanges and allows embedding extra equations and modifications, as reviewed by Syamlal.26 The above multi-scale model is programmed and implemented under this framework. To increase the accuracy of the computations, second order accurate discretization schemes are adopted. To improve the speed of the implement, an adjusted automatic time-step between 10−6 and 10−4 is employed. The simulation is carried out over 30 s, which costs one week on the Pentium 1.8 GHz workstation. The statistic results are time-averaged from 10 to 30 s after reaching the quasi steady state.

4. Results and discussion

To analyze the feasibility of the present model, the axial profile of predicted gas pressure in reactors is compared with experimental results,27 as shown in Fig. 2. It is found that the model prediction can capture the measured pressure along the reactor height very well, although there is a bit difference in the bottom of AR, which is due to the discrepancy of the inlet condition between simulation and experiment. The gas pressure change in the bottom of FR is more evident than that in the AR owing to a lower FR operating velocity. There is a slight reduction of gas pressure at the upper riser of AR. In general, the present model obtains reasonable predictions on experimental data.
image file: c5ra08603e-f2.tif
Fig. 2 Comparisons of simulated gas pressure and experimental data.

Fig. 3 displays the time-averaged distribution of gas and solid velocities in emulsion phase along the lateral direction of FR. A similar profile of velocities in the emulsion is found for different heights of FR. Both the gas and solid velocities in the emulsion show a high value at the center of the bed and decrease towards the wall. Near the wall, the solid velocity is negative, which means the back mixing of particles occurs. With the height increased, the lateral discrepancy of velocities becomes small. Overall, the difference of the magnitude between gas and solid velocities in the emulsion is not evident as a result of a comparative fraction.


image file: c5ra08603e-f3.tif
Fig. 3 Lateral profiles of gas and solid velocities in emulsion phase.

Lateral distribution of bubble velocities and bubble fractions at different heights of FR is displayed in Fig. 4. It can be observed that the bubble velocity shows a similar shape as the velocities in the emulsion. However, the magnitude of bubble velocity is slight higher at the middle region. This is due to the fact that the gas tends to form bubbles to pass through the bed. The wall friction results in a reduction of bubble velocity near the wall. In contrast to the bubble velocity, the bubble fraction is promoted along the height, which is attributed to the coalescence and growth of bubbles during the motion.


image file: c5ra08603e-f4.tif
Fig. 4 Lateral profiles of bubble velocity and bubble phase fraction.

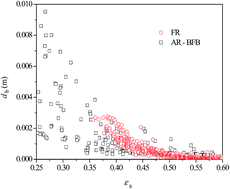
Fig. 5 demonstrates the variation of solved bubble diameter with solid volume fractions in the bottom bubbling fluidized beds of AR and FR. Here, the bubble diameter is obtained through solving the local momentum equations in the grid cell. We can find that the bubble diameter becomes weak as the solid volume fraction is increased. In the bottom of AR, a higher operating velocity leads to a relatively greater bubble size. At a high solid volume fraction, the effect of bubbles is reduced. With respect to the FR, the variation range of bubble diameter is narrow.


image file: c5ra08603e-f5.tif
Fig. 5 Profiles of solved bubble diameter with solid volume fraction.

Fig. 6 reveals the lateral distribution of gas and solid superficial velocities in the dense phase and dilute phase in the riser of AR. For the dilute phase, the magnitude of solid superficial velocity is much lower than that of gas superficial velocity owing to a lower solid fraction in the dilute phase. However, the shape of the profiles is nearly the same. By contrast, the difference between gas and solid velocities in the dense phase is a bit obvious. The profiles of solid velocities are relatively flat compared to those of gas velocities at the middle region, which indicates that the cluster weakens the gas–solid interaction.


image file: c5ra08603e-f6.tif
Fig. 6 Lateral profiles of gas and solid velocity in dense phase and dilute phase in the riser of AR.

Fig. 7 shows the predicted cluster diameter with solid volume fraction in the riser section of AR. It can be seen that the cluster diameter gradually increases with the solid volume fraction increased. When the solid volume fraction approaches to 0.05, the cluster diameter reaches the maximum value, which means the gas–solid interaction is weakest. And then the cluster diameter decreases as the solid volume fraction is further improved. The oxygen carriers are entrained up by the second air and flow into the riser of AR. The heterogeneous structures in form of clusters and dispersed particles are formed in the riser, which will have a direct influence on the regeneration degree of oxygen carriers.


image file: c5ra08603e-f7.tif
Fig. 7 Distribution of cluster diameter with solid concentration in the riser of AR.

5. Conclusion

A multi-scale hydrodynamic model taking into account the influence of meso-scale structures including clusters and bubbles is developed on the basis of the two-fluid model, where the cluster-structure dependent drag model and the bubble-structure dependent drag model are integrated. Flow behaviors in a CLC fluidized bed reactor are investigated. The distribution of local structural parameters is obtained. The results reveal that whether in the bubble-emulsion or in the cluster, the non-uniformity of local velocities is shown. The bubble effect is reduced with the solid volume fraction approaching to the solid packing volume fraction. The clusters hinder the gas–solid interaction and enlarge the discrepancy between gas velocity and solid velocity in the clusters.

A three-dimensional CFD simulation for the system is expected to reflect the impact of the cyclone, leap seals and pipes more accurately. Meanwhile, the effects of different operating parameters including the flow rate of solid entering the FR will be our further investigation in the next step.

Nomenclature

aAcceleration (m s−2)
CDDrag coefficient of a single particle
dcCluster diameter (m)
dbBubble diameter (m)
dsParticle diameter (m)
fVolume fraction of dense phase
FDrag force (N)
gGravity (m s−2)
NdfEnergy dissipation (W kg−1)
pPressure (Pa)
uVelocity (m s−1)
USuperficial velocity (m s−1)
UmfMinimum fluidizing gas velocity (m s−1)
UslipSuperficial slip velocity (m s−1)

Greek letters

βDrag coefficient (kg m−3 s−1)
γCollisional energy dissipation (kg m−1 s−3)
εVolume fraction
θGranular temperature (m2 s−2)
λThermal conductivity (W m−1 K−1)
μViscosity (Pa s)
ξBulk viscosity (Pa s)
ρDensity (kg m−3)
τStress tensor (Pa)
δBubble holdup

Subscripts

bBubble phase
cCluster
eEmulsion phase
denDense phase
dilDilute phase
intInterface
gGas phase
sSolids phase
wWall

Acknowledgements

This research is conducted with financial support from the National Natural Science Foundation of China (51390494, 51406045) and the Natural Science Foundation of Heilongjiang Province of China (Grant no. E201441).

References

  1. S. Z. Wang, G. X. Wang, F. Jiang, M. Luo and H. Y. Li, Chemical looping combustion of coke oven gas by using Fe2O3/CuO with MgAl2O4 as oxygen carrier, Energy Environ. Sci., 2010, 3, 1353–1360 CAS.
  2. F. Petrakopoulou, G. Tsatsaronis and T. Morosuk, Advanced exergoenvironmental analysis of a near-zero emission power plant with chemical looping combustion, Environ. Sci. Technol., 2012, 46, 3001–3007 CrossRef CAS PubMed.
  3. V. Manovic and E. J. Anthony, Integration of calcium and chemical looping combustion using composite CaO/CuO-based materials, Environ. Sci. Technol., 2011, 45, 10750–10756 CrossRef CAS PubMed.
  4. S. F. Hakonsen and R. Blom, Chemical looping combustion in a rotating bed reactor-finding optimal process conditions for prototype reactor, Environ. Sci. Technol., 2011, 45, 9619–9626 CrossRef PubMed.
  5. A. Cuadrat, A. Abad, F. Garcia-Labiano, P. Gayan, L. F. de Diego and J. Adanez, Effect of operating conditions in Chemical-Looping Combustion of coal in a 500 Wth unit, Int. J. Greenhouse Gas Control, 2012, 6, 153–163 CrossRef CAS PubMed.
  6. M. Zheng, L. H. Shen and J. Xiao, Reduction of CaSO4 oxygen carrier with coal in chemical-looping combustion: effects of temperature and gasification intermediate, Int. J. Greenhouse Gas Control, 2010, 4, 716–728 CrossRef CAS PubMed.
  7. S. Wang, H. L. Lu, F. X. Zhao and G. D. Liu, CFD studies of dual circulating fluidized bed reactors for chemical looping combustion processes, Chem. Eng. J., 2014, 236, 121–130 CrossRef CAS PubMed.
  8. S. Wang, Y. C. Yang, H. L. Lu, P. F. Xu and L. Y. Sun, Computational fluid dynamic simulation based cluster structures-dependent drag coefficient model in dual circulating fluidized beds of chemical looping combustion, Ind. Eng. Chem. Res., 2012, 51, 1396–1412 CrossRef CAS.
  9. K. Mahalatkar, J. Kuhlman, E. D. Huckaby and T. O'Brien, Computational fluid dynamic simulations of chemical looping fuel reactors utilizing gaseous fuels, Chem. Eng. Sci., 2011, 66, 469–479 CrossRef CAS PubMed.
  10. H. Kruggel-Emden, S. Rickelt, F. Stepanek and A. Munjiza, Development and testing of an interconnected multiphase CFD-model for chemical looping combustion, Chem. Eng. Sci., 2010, 65, 4732–4745 CrossRef CAS PubMed.
  11. Y. J. Guan, J. Chang, K. Zhang, B. D. Wang and Q. Sun, Three-dimensional CFD simulation of hydrodynamics in an interconnected fluidized bed for chemical looping combustion, Powder Technol., 2014, 268, 316–328 CrossRef CAS PubMed.
  12. S. Y. Wang, Z. H. Shen, H. L. Lu, L. Yu, W. T. Liu and Y. L. Ding, Numerical predictions of flow behavior and cluster size of particles in riser with particle rotation model and cluster-based approach, Chem. Eng. Sci., 2008, 63, 4116–4125 CrossRef CAS PubMed.
  13. T. S. Milinkumar, P. U. Ranjeet, O. T. Moses, M. E. Geoffrey and K. P. Vishnu, Effect of a cluster on gas–solid drag from lattice Boltzmann simulations, Chem. Eng. Sci., 2013, 102, 365–372 CrossRef PubMed.
  14. S. Radl and S. Sundaresan, A drag model for filtered Euler–Lagrange simulations of clustered gas–particle suspensions, Chem. Eng. Sci., 2014, 117, 416–425 CrossRef CAS PubMed.
  15. J. Li and M. Kwauk, Particle–fluid two-phase flow, the energy minimization multi-scale method, Metallurgical Industry Press, Beijing, 1994 Search PubMed.
  16. N. Yang, W. Wang, W. Ge and J. H. Li, CFD simulation of concurrent-up gas–solid flow in circulating fluidized beds with structure-dependent drag coefficient, Chem. Eng. J., 2003, 96, 71–80 CrossRef CAS PubMed.
  17. W. Wang and J. Li, Simulation of gas–solid two-phase flow by a multi-scale CFD approach-Extension of the EMMS model to the sub-grid level, Chem. Eng. Sci., 2007, 62, 208–231 CrossRef CAS PubMed.
  18. C. C. Milioli, F. E. Milioli, W. Holloway, K. Agrawal and S. Sundaresan, Filtered two-fluid models of fluidized gas–particle flows: new constitutive relations, AIChE J., 2013, 59, 3265–3275 CrossRef CAS PubMed.
  19. S. Schneiderbauer and S. Pirker, Filtered and heterogeneity-based subgrid modifications for gas–solid drag and solid stresses in bubbling fluidized beds, AIChE J., 2014, 60, 839–854 CrossRef CAS PubMed.
  20. S. Wang, G. B. Zhao, G. D. Liu, H. L. Lu, F. X. Zhao and T. Y. Zhang, Hydrodynamics of gas–solid risers using cluster structure-dependent drag model, Powder Technol., 2014, 254, 214–227 CrossRef CAS PubMed.
  21. S. Wang, H. L. Lu, Q. H. Zhang, G. D. Liu, F. X. Zhao and L. Y. Sun, Modeling of bubble-structure-dependent drag for bubbling fluidized beds, Ind. Eng. Chem. Res., 2014, 53, 15776–15785 CrossRef CAS.
  22. D. Gidaspow, Multiphase Flow and Fluidization: Continuum and Kinetic Theory Descriptions, Academic Press, Boston, 1994 Search PubMed.
  23. A. Srivastava and S. Sundaresan, Analysis of a frictional-kinetic model for gas–particle flow, Powder Technol., 2003, 129(1–3), 72–85 CrossRef CAS.
  24. J. Adanez, C. Dueso, L. F. de Diego, F. Garcıa-Labiano, P. Gayan and A. Abad, Methane combustion in a 500 Wth chemical looping combustion system using an impregnated Ni-based oxygen carrier, Energy Fuels, 2009, 23, 130–142 CrossRef CAS.
  25. P. C. Johnson and R. Jackson, Frictional–collisional constitutive relations for granular materials, with application to plane shearing, J. Fluid Mech., 1987, 176, 67–93 CrossRef CAS.
  26. M. Syamlal, W. Rogers and T. J. O'Brien, MFIX Documentation Theory Guide, Morgantown Energy Technology Center, Office of Fossil Energy, U.S. Department of Energy, Morgantown, WV, Technical Note, DOE/METC-94/1004, NTIS/DE94000087, 1993 Search PubMed.
  27. E. Johansson, A. Lyngfelt, T. Mattisson and F. Johnsson, Gas leakage measurements in a cold model of an interconnected fluidized bed for chemical-looping combustion, Powder Technol., 2003, 134, 210–217 CrossRef CAS.

This journal is © The Royal Society of Chemistry 2015
Click here to see how this site uses Cookies. View our privacy policy here.