DOI:
10.1039/C5RA08336B
(Paper)
RSC Adv., 2015,
5, 60085-60089
Fabrication of fluorescent nitrogen-rich graphene quantum dots by tin(IV) catalytic carbonization of ethanolamine†
Received
6th May 2015
, Accepted 3rd July 2015
First published on 6th July 2015
Abstract
A novel metal catalytic strategy, arising from the coordinated interaction between metal ions tin(IV) and ethanolamine, was presented to prepare nitrogen-rich graphene quantum dots (N-rich GQDs) with excellent luminescence properties. In contrast to previous GQDs produced by the bottom-up route, which usually involves complex and harsh synthetic procedures, we obtained N-rich GQDs using a single reactant source under mild reaction conditions. Moreover, the prepared N-rich GQDs have shown promising applications as a fluorescence probe toward folic acid.
Introduction
As a rising star in the family of carbon materials, graphene quantum dots (GQDs) have emerged and attracted increased interest because of their specific electronic and optical properties,1 which originate from pronounced quantum confinement and edge effects.2 However, the development of zero dimension GQDs remain inchoate and synthesis is only a recent advance. Up to now, GQDs were generally produced from graphene-based starting materials3 or the rigid synthetic chemistry of graphene-like smaller polycyclic aromatic hydrocarbon molecules.4 A new tendency has been focused on preparing GQDs from small organic molecules which can generate aromatic molecules.5 Nevertheless, most of the developed methods were unsatisfactory because whether a “top-down” chemical cutting progress or a “bottom-up” polymerization and carbonization route inevitably have some shortcomings, such as harsh reaction conditions and tedious synthetic steps. As we all know, nitrogen doping of carbon nanodots or graphene quantum dots can significantly improve their properties and expand their novel application.6 Despite several successes in the area of introducing abundant nitrogen into carbon dots,7 it is still a great challenge to obtain nitrogen-rich graphene quantum dots. Therefore, to develop a simple and mild method to obtain N-rich GQDs is imperatively desirable and significant. It is appreciated that metal salts have been developed as available catalysts for pyrolytic synthesis of carbon nanomaterials,8–12 especially in the progress of producing carbon-based quantum dots, like carbon dots9–11 and graphene quantum dots.12 Among most of them, metal ions acted as catalysts based on the effect of ionic strength.9–11 Until now, rare groups have investigated the catalytic mechanism of metal ions involved in carbonization and nucleation of graphene quantum dots. Inspired by the report13 that aromatic pyrazine could be synthesized via catalytic dehydrogenation of ethanolamine with various forms of metal element, we explored the possibility that atomically precise N-rich GQDs could be generated via a metal ion-catalyzed ethanolamine progress.
In this work, a novel metal catalytic strategy, arising from the coordinated interaction between metal ions and ethanolamine, was designed to produce N-rich GQDs with good optical nature at relatively low temperature. Ethanolamine, which possessed the minimum molecular weight to synthesize GQDs, served as both carbon source and nitrogen source. When adding it into a certain ratio of stannic chloride ethanol solution, we realized our hypothesis of preparing N-rich GQDs without further modification through a solvothermal treatment.
Experimental section
Preparation of N-rich graphene quantum dots
Nitrogen-rich graphene quantum dots (N-rich GQDs) were synthesized with a one-step solvothermal route. 0.637 g SnCl4·5H2O was dissolved in 55 mL ethanol. Next, 110 μL of ethanolamine was added, and stirred to form a clear precursor solution, and then the mixed solution was transferred into a 100 mL poly (tetrafluoroethylene) (Teflon)-lined autoclave to react at 180 °C for 8 h. After the reaction, the reactors were cooled down to room temperature naturally. There are some light brown solids in the bottom of the reactor while the product was brown-yellow and transparent in the solution. The product was further separated by centrifuging at 8000 rpm for 20 min. Through a dialysis membrane (300 MWCO) against DI water for purification, the N-rich GQDs were concentrated by rotary evaporation and drying under vacuum. The solution of N-rich GQDs was obtained by dissolving concentrated product into a certain amount of water. The purified product was used for further characterization and analytical application. A series of N-rich GQDs were prepared with different reactant sources or time via the same procedure in the expanded experiments.
Characterization
The surface morphology of the sample was examined by a JSM-5900LV scanning electron microscope (SEM, JEOL, Japan) and JEM-100CXII transmission electron microscope (TEM, JEOL, Japan). Energy dispersive X-ray spectroscopy (EDS) analyses were performed on the SEM instrument to determine the elemental compositions of material. The atomic force microscopy (AFM) images were obtained using a tapping mode of Agilent 5500 atomic force microscope to characterization the thickness of the material. Wide-angle (10–70°, 40 kV/35 Ma) XRD patterns of the samples were carried out using X′ Pert Pro X-ray diffractometer (Philips) with Cu Kα radiation (λ = 1.79 Å). X-ray photoelectron spectroscopy (XPS) was performed with a XSAM 800 electron spectrometer (Kratos) using monochromatic Al Ka radiation. Fourier transform infrared (FTIR) spectra were recorded in KBr discs on a Nicolet IS10 FTIR spectrometer (Thermo Inc., America). The UV absorption and emission spectra were measured by a U-2910 UV-Vis spectrophotometer and an F-7000 fluorescence spectrophotometer (Hitachi Co., Tokyo, Japan). Elemental analysis was performed on Flash EA 1112. Each data was parallel at least thrice and the average values were obtained by measuring three kinds of sample batches. Raman spectra were measured with a Raman Microscope (Lab RAM HR) with radiation at 633 nm. The FL lifetime measurements were performed on an FLS920 time-resolved fluorescence spectrometer (Edinburgh Instruments).
Results and discussions
Structure and morphology
The as-prepared N-rich GQDs were yellow-brown colloidal material and highly dispersible in water, ethanol and methanol, but low solubility in other common organic solvents (such as acetone, chloroform, toluene and carbon tetrachloride) (Fig. S1†). The aqueous solution of N-rich GQDs exhibited a homogeneous light yellow phase without any noticeable precipitation at room temperature. Calculated by measuring several hundred N-rich GQDs from the transmission electron microscopy (TEM) image, Fig 1b showed the size of N-rich GQDs was distributed in the range of 1 nm to 5 nm. The high-resolution transmission electron microscopy (HRTEM) image clearly indicated that N-GQDs is with good crystallinity and revealed the lattice spacing of 0.334 nm (inset of Fig. 1a). The XRD patterns of N-rich GQDs (Fig. S2†) displayed a broad peak around 25° with the lattice spacing of 0.34 nm, agreed well with the interlayer spacing (002) of GQDs. Atomic force microscopy (AFM; Fig. S3†) was further applied to identify the thickness of N-rich GQDs. Four sites were selected randomly and showed an average thickness at around 0.95 nm, which was close proximity to monolayer graphene.3b On account of the high fluorescence14 or more disordered structures resulting from N atoms intercalating into the conjugated carbon backbone,15 no obvious D (1590 cm−1) and G (1320 cm−1) band were detected in Raman spectra of the obtained N-rich GQDs (Fig. S4†).
 |
| | Fig. 1 (a) High-resolution TEM images of the N-rich GQDs; scale bar: 10 nm (inset: lattice parameters of typical single N-rich GQDs; scale bar: 5 nm). (b) Size distribution of N-rich GQDs. | |
X-ray Photoelectron spectroscopy (XPS) measurements were carried out to determine the chemical composition of as-prepared N-rich GQDs. The full scan XPS spectrum (Fig. 2a) showed a dominant graphitic C1s peak near 284.6 eV and O1s peak around 532 eV for N-rich GQDs. In addition, the typical peak of N1s was clearly observed, which indicate N atom having been effective incorporating into N-rich GQDs.15 The residual tin(IV) ion was completely removed and a small quantity of chlorine was also existed in the N-rich GQDs arising from stannic chloride. The C1s spectrum (Fig. 2b) showed four peaks centered on 284.62, 285.95, 286.54, 288.00 eV, which were assigned to four types of carbons: C–C/C![[double bond, length as m-dash]](https://www.rsc.org/images/entities/char_e001.gif) C, C–N, C–O, and CO. The N1s spectrum (Fig. 2c) consisted of three peaks at 399.64, 400.52, 401.48 eV, which were attributed to pyridic C–N–C, pyrrolic C2–N–H, and graphitic N–C3 respectively. Two peaks were observed at 531.83 and 532.425 eV, corresponding to CO and C–OH/C–O–C group. Fourier transform infrared (FTIR; Fig. S5†) spectra further confirmed the presence of oxygen-containing group (CO, –OH) and C–N.
C, C–N, C–O, and CO. The N1s spectrum (Fig. 2c) consisted of three peaks at 399.64, 400.52, 401.48 eV, which were attributed to pyridic C–N–C, pyrrolic C2–N–H, and graphitic N–C3 respectively. Two peaks were observed at 531.83 and 532.425 eV, corresponding to CO and C–OH/C–O–C group. Fourier transform infrared (FTIR; Fig. S5†) spectra further confirmed the presence of oxygen-containing group (CO, –OH) and C–N.
 |
| | Fig. 2 (a) XPS survey spectrum of N-rich GQDs. High-resolution peak fitting XPS spectra of the C 1s (b), N 1s (c) and O1s (d). | |
Catalytic synthetic mechanism
To gain insight into catalytic synthetic mechanism of N-rich GQDs, a series of control experiments were carried out. Fluorescence intensity of designed N-rich GQDs improved many times compared with those without Sn4+ (Fig. 3a), which directly demonstrated the critical role of Sn4+ in the process of fabricating N-rich GQDs. To elucidate the factors influencing N-rich GQDs formation, the effect of starting material proportion and reaction time was firstly investigated (Fig. S6†). Highly luminescent N-rich GQDs could be obtained with a ratio of tin tetrachloride to ethanolamine being 1![[thin space (1/6-em)]](https://www.rsc.org/images/entities/char_2009.gif) :10 for 8 h at 180 °C (even at a lower temperature of 100 °C; Fig. S6c†).
:10 for 8 h at 180 °C (even at a lower temperature of 100 °C; Fig. S6c†).
 |
| | Fig. 3 (a) Fluorescence spectra of produces obtained from precursor with SnCl4·5H2O and without SnCl4·5H2O. (b) FTIR spectra of ethanolamine dissolved ethanol, SnCl4·5H2O dissolved ethanol and the mixture of precursor solution. (c) Fluorescence spectra of sample deriving from three different processed ethanol (+1 ml H2O, standard ethanol, distillation of ethanol). | |
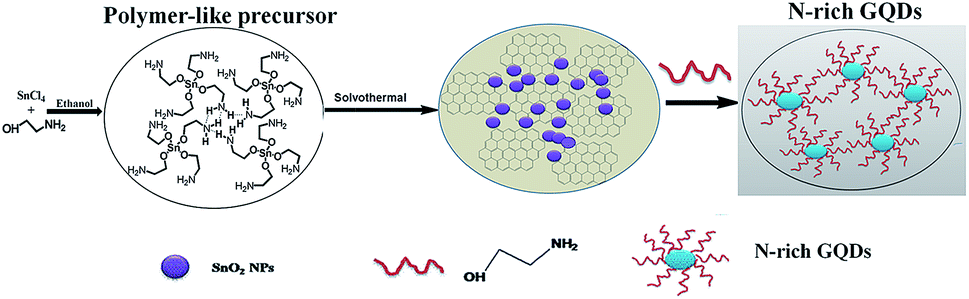
In the case of our experiments, the reaction process was presumably attributed to a metal-catalyzed N-rich GQDs formation. Fourier transform infrared spectra of mixed precursor solution featured Sn–O stretching modes at 723 cm−1 (Fig. 3b), indicating that Sn4+ oriented coordinated with oxygen atom of the ethanolamine. Interestingly, water content in the reaction system had a tremendous impact on yield of N-rich GQDs. By controlling the content of water, we discovered the fluorescence intensity of products enhanced obviously with the decrease content of water (Fig. 3c), which could be ascribed to the possibility that Sn4+ was prior to be assembled with H2O, interfering the coordination between Sn4+ and ethanolamine. Further information about the reaction process was obtained by analyzing the evolution of tin(IV). We discovered Sn4+ ion was gradually converted into SnO2 in the progress of solvothermal treatment and assembled to disk-like aggregates (Fig. S7 and S8†), which enabled easy separation from reaction media for use. Herein, the probable overall procedure for the preparation of N-rich GQDs is illustrated in Fig. 4. At the beginning, tin(IV) tert-ethanolamine (Sn(HOCH2CH2NH2)4) precursors were homogeneously formed in the primary seed-incubation stage. Due to the interaction of hydrogen bonding, some precursors oriented attached to each other and developed into polymer-like aggregation, which were then carbonized and self-assembled to original N-rich GQDs. At the same time, SnO2 nano-particles were produced and entrapped in N-rich GQDs matrix, which can effectively prevent π–π stacking between graphene sheets and allowed us to make N-rich GQDs with the thickness of monolayer graphene. Finally functionalized N-rich GQDs were obtained subsequently by using residual ethanolamine as surface modification agent. We also studied the continuous evolution of optical properties of N-rich GQDs. Different pyrolytic time of N-rich GQDs was discussed (N-rich GQDs@2 h; N-rich GQDs@8 h; N-rich GQDs@15 h). The photoluminescence quantum yield of N-rich GQDs@2 h, N-rich GQDs@8 h and N-rich GQDs@15 h were 0.1060, 0.1262, 0.1558, respectively (Table 1).
 |
| | Fig. 4 Schematic illustration of synthesis of N-rich GQDs. | |
Table 1 The quantum yield was determined using quinine sulfate as a reference (Table S1). N/C atomic ratios were measured from the result of elemental analysis. (Table S2) Oxygen banding composition determined from O1s XPS (Table S3)
| Sample |
QY (ex = 350 nm) |
N/C (wt%) |
CO/O (wt%) |
C–O/O (wt%) |
| N-rich GQDs@2 h |
0.1060 |
34.65 |
92.95 |
7.05 |
| N-rich GQDs@8 h |
0.1262 |
34.02 |
67.51 |
32.49 |
| N-rich GQDs@15 h |
0.1558 |
27.92 |
63.59 |
36.41 |
Furthermore, fluorescence and UV-Vis spectra revealed tiny shift over time (Fig. S9†), accompanying with a decreased stoichiometric amount of nitrogen elemental analysis (Table 1), which is opposite to most of N-doped CQDs.16 Meanwhile, the oxygen bonding composition reflected the fact that more and more oxygen tended to be C–O presented in N-rich GQDs although CO still possessed higher percentage (Table 1). The reason that carbonyl was selectively reduced and hydroxyl groups may be responsible for improved quantum yield because –OH can suppress of non-radiative process and further enhance integrity of π conjugated system.17 More excitingly, we successfully expanded the scope of application of this synthetic approach (Fig. S10†). Same types of organic molecules (ethanolamine, diethanolamine, triethanolamine), different valence states of metal ions (Ag+, Zn2+, Al3+, Sn4+) and solvent (methanol, ethanol) can also be used to prepare N-rich GQDs with the similar photoluminescence via this synthesis strategy. Though tin and stannic oxide had the ability to catalytic synthesis of N-rich GQDs, the tin ion (Sn2+, Sn4+) performed best due to the oriented coordination with ethanolamine.
Photoluminescence property
Similar to N-doped GQDs those created from glucose and aqueous ammonia,18 N-rich GQDs prepared from ethanolamine exhibited three UV absorption band around 220, 260 and 320 nm in the UV/Vis spectra (Fig. 5), which was well corresponding to photoluminescence excitation spectra (PLE, λem = 425 nm). The bright blue photoluminescence (peaked 425 nm) of N-rich GQDs can be easily seen with the naked eye under UV light (inset of Fig. 5). Apart from the strong down conversion PL feature, the PL spectrum of N-rich GQDs revealed a weak converted emission located also around 425 nm. When excited ranging from 220 nm to 360 nm or 550 nm to 750 nm, N-rich GQDs all showed excitation-independent behaviors with emission wavelength at 425 nm shifting less than 10 nm (Fig. 6a and b), which may be ascribed to uniform emissive sites, or they share their specific PL mechanism. The PL of the N-rich GQDs had outstanding photostability. No distinct photobleaching was found using UV lamp at 365 nm with a power of 5 W until 5.5 h (Fig. 6c). PL intensity decreased under a solution of high or low pH, but remained constant when pH changed from 2.28 to 10.48 (Fig. 6d).
 |
| | Fig. 5 UV-Vis absorption spectrum (black line), PLE spectrum (green line) and PL spectrum (red line) of N-rich GQDs. Inset: photographs of N-rich GQDs with UV (365 nm, center) illumination. | |
 |
| | Fig. 6 Fluorescence property of N-rich GQDs. (a and b) Excitation-independent behaviours; effect of time of UV-irradiation (c) and pH (d) on the fluorescence intensity of N-rich GQDs. | |
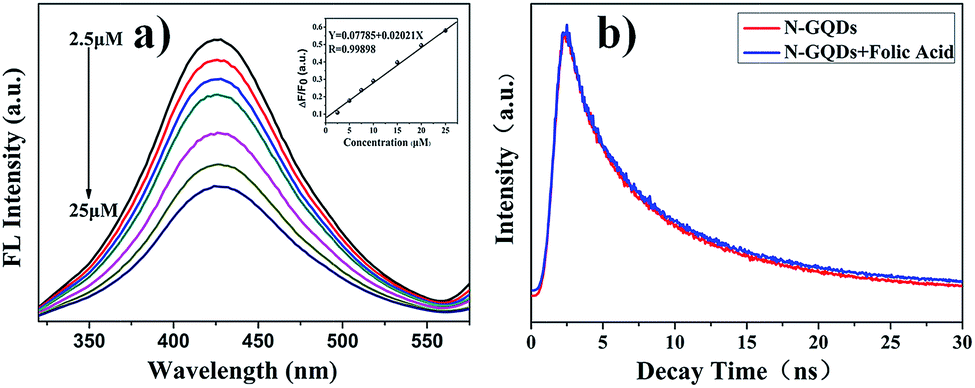
Owning to the excellent luminescent stability, water dispersibility and FL quantum yield of N-rich GQDs, we explored the feasibility of using such N-GQDs for FL probe application. Fig. 7a revealed that N-rich GQDs were highly sensitive to folic acid and their FL intensity decreased with the concentration of folic acid increased. Based on which we designed a FL probe for folic acid. Probe exhibited a linear response concentration range (2.5–25 μM) to folic acid, followed the equation ΔF/F0 = 0.07785 + 0.02021C, with a correlation coefficient (R) of 0.9989 (inset of Fig. 7a). The limit of detection was 0.98 μM (S/N = 3). To get further insight into the luminescence and PL quenching mechanism, time-correlated single-photon counting (TCSPC) was used to study the excitation behavior of N-rich GQDs in the presence and absence of folic acid (Fig. 7b). For the N-rich GQDs, the decay curve exhibited a three-exponential decay (Table S4†) with the lifetime of 1.08 ns (τ1, 9.67%), 5.45 ns (τ2, 40.90%), and 13.53 ns (τ3, 49.43%) at 425 nm emission, with an intensity-weighted average time of 11.38 ns. The fast components (τ1 and τ2) were suggested to be related to intrinsic states. The slow one (τ3) originated from defect states (surface energy states). The observed lifetimes of N-rich GQDs confirmed that the combining effect between intrinsic state emission and defect states emission contributed to fluorescence emission at 425 nm. Either fast component (τ3) or slow component (τ1 and τ2) changed little after adding folic acid. We concluded that the quenching of N-rich GQDs by folic acid was more likely to be a static quenching process and involved generation of new complexes based on N-rich GQDs and folic acid. The UV-Vis spectra of mixed solution (Fig. S11†) displayed slight shift and enhanced absorbance value compared with sole N-rich GQDs solution, which further confirmed the previous speculation. The selectivity of FL probe has been explored carefully (the concentration of folic acid: 20 μM: the concentration of others: 200 μM). As shown in Fig. S12,† the inflorescence intensity of system displayed a relatively good selectivity. Except for ascorbic acid, other substances (uric acid, citric acid, D-fructose, sodium hyaluronate, creatinine, glucose, lactose, GSH) have nearly no interference to FL response of nitrogen-rich graphene quantum dots.
 |
| | Fig. 7 (a) PL spectra of the N-rich GQDs–folic acid system with different concentrations of folic acid (inset: linear calibration plot for folic acid detection). (b) FL decay of N-rich GQDs as a function of time in the presence and absence of folic acid. | |
Conclusions
In summary, we synthesized novel N-rich GQDs by using ethanolamine as a single reactant source with a metal ion-catalyzed route, representing a relatively simple and mild condition to obtain excitation-independent emission N-rich GQDs. The chemical structure, morphology characteristics, PL property and mechanism were investigated in detail. Meanwhile, we discussed metal ion-catalyzed mechanism and expanded the scope of application of the synthetic approach. Moreover, the N-rich GQDs can be applied as a fluorescent probe for the detection of folic acid featured a static quenching mechanism. Future work should be focused on surface modification and expanding their applications, particularly in field of biological imaging and drug delivery.
Acknowledgements
Authors gratefully acknowledge financial support for this project from the National Natural Science Foundation of China (No. 21405107 and J1103315). The authors also thank Analytical & Testing Center and Comprehensive Specialized Laboratory Training Platform of Sichuan University for characterization analysis.
Notes and references
-
(a) R. Sekiya, Y. Uemura, H. Murakami and T. Haino, Angew. Chem., Int. Ed., 2014, 53, 5619–5623 CrossRef CAS PubMed;
(b) D. Y. Pan, J. C. Zhang, Z. Li and M. H. Wu, Adv. Mater., 2010, 22, 734–738 CrossRef CAS PubMed;
(c) J. H. Shen, Y. H. Zhu, C. Chen, X. L. Yang and C. Z. Li, Chem. Commun., 2011, 47, 2580–2582 RSC;
(d) S. J. Zhu, J. H. Zhang, X. Liu, B. Li, X. F. Wang, S. J. Tang, Q. N. Meng, Y. F. Li, C. Shi, R. Hu and B. Yang, RSC Adv., 2012, 2, 2717–2720 RSC.
-
(a) A. Ananthanarayanan, X. W. Wang, P. Routh, B. Sana, S. Lim, D.-H. Kim, K.-H. Lim, J. Li and P. Chen, Adv. Funct. Mater., 2014, 24, 3021–3026 CrossRef CAS PubMed;
(b) Y. Q. Dong, W. R. Tian, S. Y. Ren, R. P. Dai, Y. W. Chi and G. N. Chen, ACS Appl. Mater. Interfaces, 2014, 6, 1646–1651 CrossRef CAS PubMed.
-
(a) V. Gupta, N. Chaudhary, R. Srivastava, G. D. Sharma, R. Bhardwaj and S. Chand, J. Am. Chem. Soc., 2011, 133, 9960–9963 CrossRef CAS PubMed;
(b) L. X. Lin and S. W. Zhang, Chem. Commun., 2012, 48, 10177–10179 RSC;
(c) G. S. Kumar, R. Roy, D. Sen, U. K. Ghorai, R. Thapa, N. Mazumder, S. Sahab and K. K. Chattopadhyay, Nanoscale, 2014, 6, 3384–3391 RSC.
-
(a) R. L. Liu, D. Q. Wu, X. L. Feng and K. Müllen, J. Am. Chem. Soc., 2011, 133, 15221–15223 CrossRef CAS PubMed;
(b) Q. Q. Li, S. Zhang, L. M. Dai and L.-S. Li, J. Am. Chem. Soc., 2012, 134, 18932–18935 CrossRef CAS PubMed.
-
(a) L. B. Tang, R. B. Ji, X. K. Cao, J. Y. Lin, H. X. Jiang, X. M. Li, K. S. Teng, C. M. Luk, S. J. Zeng, J. H. Hao and S. P. Lau, ACS Nano, 2012, 6, 5102–5110 CrossRef CAS PubMed;
(b) T. Ogi, H. Iwasaki, K. Aishima, F. Iskandar, W. N. Wang, K. Takimiya and K. Okuyama, RSC Adv., 2014, 4, 55709–55715 RSC;
(c) Z. L. Wu, M. X. Gao, T. T. Wang, X. Y. Wan, L. L. Zheng and C. Z. Huang, Nanoscale, 2014, 6, 3868–3874 RSC.
-
(a) L. Wang and H. S. Zhou, Anal. Chem., 2014, 86, 8902–8905 CrossRef CAS PubMed;
(b) J. Ju, R. Z. Zhang, S. J. He and W. Chen, RSC Adv., 2014, 4, 52583–52589 RSC;
(c) M. K. Barman, B. Jana, S. Bhattacharyya and A. Patra, J. Phys. Chem. C, 2014, 118, 20034–20041 CrossRef CAS.
-
(a) C. F. Wang, X. Wu, X. P. Li, W. T. Wang, L. Z. Wang, M. Gu and Q. Li, J. Mater. Chem., 2012, 22, 15522–15525 RSC;
(b) W. Kwon, S. Do, J. Lee, S. Hwang, J. K. Kim and S.-W. Rhee, Chem. Mater., 2013, 25, 1893–1899 CrossRef CAS;
(c) X. X. Chen, Q. Q. Jin, L. Z. Wu, C. H. Tung and X. J. Tang, Angew. Chem., Int. Ed., 2014, 53, 1–7 CrossRef PubMed.
- S.-H. Yu, X. J. Cui, L. L. Li, K. Li, B. Yu, M. Antonietti and H. Colfen, Adv. Mater., 2004, 16, 1636–1640 CrossRef CAS PubMed.
- X. H. Wang, K. G. Qu, B. L. Xu, J. S. Rena and X. G. Qu, J. Mater. Chem., 2011, 21, 2445–2450 RSC.
- Z.-C. Yang, M. Wang, A. M. Yong, S. Y. Wong, X.-H. Zhang, H. Tan, A. Y. Chang, X. Li and J. Wang, Chem. Commun., 2011, 47, 11615–11617 RSC.
- A. B. Bourlinos, A. Stassinopoulos, D. Anglos, R. Zboril, V. Georgakilas and E. P. Giannelis, Chem. Mater., 2008, 20, 4539–4541 CrossRef CAS.
- J. Lu, P. S. E. Yeo, C. K. Gan, P. Wu and K. P. Loh, Nat. Nanotechnol., 2011, 6, 247–252 CrossRef CAS PubMed.
- J. G. Aston, T. E. Peterson and J. Holowchak, J. Am. Chem. Soc., 1942, 56, 153–154 CrossRef.
- S. J. Zhu, Q. N. Meng, L. Wang, J. H. Zhang, Y. B. Song, H. Jin, K. Zhang, H. C. Sun, H. Y. Wang and B. Yang, Angew. Chem., Int. Ed., 2013, 125, 4045–4049 CrossRef PubMed.
- Y. Li, Y. Zhao, H. H. Cheng, Y. Hu, G. Q. Shi, L. M. Dai and L. T. Qu, J. Am. Chem. Soc., 2012, 134, 15–18 CrossRef CAS PubMed.
-
(a) X. Y. Zhai, P. Zhang, C. J. Liu, T. Bai, W. C. Li, L. M. Dai and W. G. Liu, Chem. Commun., 2012, 48, 7955–7957 RSC;
(b) Y. Q. Dong, H. C. Pang, H. B. Yang, C. X. Guo, J. W. Shao, Y. W. Chi, C. M. Li and T. Yu, Angew. Chem., Int. Ed., 2013, 125, 7954–7958 CrossRef PubMed.
-
(a) L.-L. Li, J. Ji, R. Fei, C.-Z. Wang, Q. Lu, J.-R. Zhang, L.-P. Jiang and J.-J. Zhu, Adv. Funct. Mater., 2012, 22, 2971–2979 CrossRef CAS PubMed;
(b) G. Eda, Y. Y. Lin, C. Mattevi, H. Yamaguchi, H. A. Chen, I. S. Chen, C. W. Chen and M. Chhowalla, Adv. Mater, 2010, 22, 505–509 CrossRef CAS PubMed;
(c) K. P. Loh, Q. Bao, G. Eda and M. Chhowalla, Nat. Chem., 2010, 2, 1015–1024 CrossRef CAS PubMed.
- L. B. Tang, R. B. Ji, X. M. Li, G. X. Bai, C. P. Liu, J. H. Hao, J. Y. Lin, H. X. Jiang, K. S. Teng, Z. B. Yang and S. P. Lau, ACS Nano, 2014, 8, 6312–6320 CrossRef CAS PubMed.
Footnote |
| † Electronic supplementary information (ESI) available: All experimental details, Fig. S1–S11 and Table S1–S4. See DOI: 10.1039/c5ra08336b |
|
| This journal is © The Royal Society of Chemistry 2015 |
Click here to see how this site uses Cookies. View our privacy policy here.