Jian Yang*a,
Wei Gongab,
Shuo Shia,
Lin Duac,
Jia Suna,
Bo Zhua,
Ying-ying Maab and
Sha-lei Songd
aState Key Laboratory of Information Engineering in Surveying, Mapping, and Remote Sensing, Wuhan University, 129 Luoyu Road, Wuhan 430079, China. E-mail: wind_yang@whu.edu.cn; Tel: +86-15927498085
bCollaborative Innovation Center for Geospatial Technology, No. 129, Luoyu Road, Wuhan, China 430079
cSchool of Physics and Technology, Wuhan University, 299 Bayi Road, Wuhan 430072, China
dWuhan Institute of Physics and Mathematics, Chinese Academy of Sciences, 30 West of Xiaohongshan, Wuhan 430071, China
First published on 24th June 2015
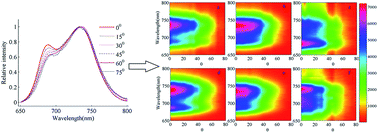
To differentiate and analyze plant types and species, a spectral identification approach is proposed founded on the characteristics of fluorescence spectral spatial distribution. Pseudo-color images of fluorescence spectral spatial distribution outperforming steady-state fluorescence spectra are constructed to serve as individual fingerprints for plant types and species, which can be utilized to accurately discriminate different plant types and species especially the different species of the same family. The introduced method provides a more reliable and stabilized means for identifying and analyzing plant species in the fields of vegetation-ecology and remote sensing. Stability and reliability are validated by using the spatial distribution of fluorescence spectra measurements of paddy rice and Dracaena sanderiana at two different incident angles of excitation light source in an additional experiment.
In the last few decades, many techniques of passive and active remote sensing9–12 have been presented to detect vegetation types and species. Spectral reflectance measurements of plant region mainly afford only frank information associating with how much of a region being scanned is wrapped by plant containing chlorophyll. These may be very valuable information, especially for those interested in the changing of detecting regional plant. However, further significant utilizing of the detecting data is depended on the capacity to accurately distinguish and identify vegetation species or vegetation groups. Thus, all of these reasons prompt investigators to search for new technologies. A remote sensing technique has been investigated by Chappelle et al.13 in the past many years which employed the laser-induced fluorescence (LIF) characteristics of vegetation as a likely approach to identify different vegetation types and species. The feasibility of the LIF as an active remote sensing has been verified by use aircraft.14 Thus, it could be established from satellites in a fashion similar to passive multi-spectral reflectance scanners. Whereas, it is usually insufficient for identifying varieties of plant species, especially those that contained the same family, that traditional LIF technology depending on measurements of single-photon emission fluorescence spectra. To compensate for these limitations and flexibly to traditional LIF technologies, time-resolved fluorescence15,16 and fluorescence decay measurements17–19 have been studied. These approaches will greatly improve the ability of discrimination of different plant species, but the application of fluorescence decay is restricted by the complicacy of the deconvolution of the time response, and the time-resolved fluorescence is limited due to the signal to noise ratio (SNR), etc.
The LIF spectral intensities and shapes of vegetation change over angle were mentioned by Saito et al. to analyze the number of constituents and the interior structure of the leaves.20 Thus, in this paper, the pseudo-color image of the fluorescence spectral spatial distribution (PCIFSD) of vegetation is proposed by employing the changes of the intensities and shapes of LIF spectra and utilizing this approach to identify and distinguish different plant species. Compared with the ordinary LIF spectra, more information contained in the two-dimensional false-color fluorescence spectral image of plant species which including both the relative fluorescence intensity and the shapes of the LIF spectra. This method has the advantage of high sensitivity and high discrimination for detecting the plant types or species, which is making classification more reliable and accurate.
Label | Sample | Class |
---|---|---|
a | Camphora officinarum | Dicots |
b | Scindapsus aureus | Monocots |
c | Cinnamomum kotoense | Dicots |
d | Dracaena sanderiana | Monocots |
e | Paddy rice | Monocots |
f | Bamboo | Monocots |
![]() | (1) |
The exponential function is integrated over the leaf thickness R. Thus, the principle shows that it is possible to classify the taxonomically similar plant species by using the characteristics of fluorescence spectral spatial distribution.
![]() | ||
Fig. 1 Schematic of LIF system. PC is a personal computer, BE is a 10 times of beam expander, ICCD is intensified change-coupled device. |
The excitation light source is an Nd:YAG, the repetition frequency is 20 Hz with output power and width per pulse are 1.5 mJ and 5 ns, respectively. The fiber optics with a diameter of 200 μm is employed to gather the fluorescence signal. The fluorescence excited was transmitted into the fiber optics and then focused through a 0.05 mm slit entered the spectrometer. The fluorescence signal varies with wavelength was acquired by utilizing intensified charge-coupled device (ICCD), and the data were stored by using a person computer (PC). In order to eliminate the reflected light from the laser entering the fiber optics, an additional 355 nm cut-off filter was placed in front of the fiber optics. In this paper, the scans range of spectrometer is ranging from 650 nm to 800 nm and the sampling interval is 0.5 nm.
The fluorescence spectrum of the plant varying with angle was obtained by measuring the fluorescence intensity at different fluorescence emission angles. Thus, the intensities and shapes of the steady-state LIF spectra of the plant species related with the angle of fluorescence emission. As shows in Fig. 3, it gives an example that the shapes of fluorescence spectra of Scindapsus aureus change over angle. In this illustration, the angles of acceptance were set to 0°, 15°, 30°, 45°, 60°, and 75° respectively. This change demonstrates that the shapes of the fluorescence spectrum in the spatial distribution will vary with angle, which can be also known from eqn (1). These variations in the fluorescence spectra rely on the plant species, which can be conveniently utilized to discriminate different plant species.
![]() | ||
Fig. 3 The normalized LIF spectra of Scindapsus aureus with different angles. The angle of fluorescence emission were set to 0°, 15°, 30°, 45°, 60°, and 75° respectively. |
Pseudo-color images which are employing angle and fluorescence wavelength as axes are utilized to demonstrate the spatial distribution of LIF spectra. Zero angle on the x-axis corresponds to the initial measuring position. As shown in Fig. 4, the angle range of fluorescence emission along the abscissa is 80°, with a sampling interval of 5°. What's more, the longitudinal axis of PCIFSDs constructed at 355 nm excitation wavelength has wavelengths ranging from 650 nm to 800 nm with a 0.5 nm sampling interval. Thus, LIF spectra should be measured at 17 different angles of fluorescence emission for each sample of the plant species to build an intact PCIFSD. In order to improve the SNR and avoid the effect of laser energy fluctuation on the fluorescence intensity, the fluorescence spectrum of each sample has been repeatedly measured 5 times. Thus, less than 1 minute is required for each sample when repetition rate of excitation light source is 20 Hz. The pseudo-color images demonstrating the difference in the characteristic of fluorescence spectral spatial distribution as well as the shapes of fluorescence spectra over angle can be served as unique fingerprints for plant species (Fig. 4). These PCIFSDs of plant are quite different from each other, demonstrating that the fluorescence spectral spatial distribution based approach can effectively distinguish different plant types and species.
A series of LIF spectra, which is associated with the angle, can be acquired along the vertical axis. In addition, the variations in the relative fluorescence intensity of certified emission wavelengths can be also measured along the horizontal axis. Compared with that in LIF, the difference among the PCIFSDs of different plant species is more distinct. Plant species samples (e.g., (a) Camphora officinarum (b) Scindapsus aureus, and (f) bamboo) can be effortless distinguished by using this approach even though they cannot be discriminated by traditional LIF.
In order to show the stability and reliability of the provided approach in discriminating plant types and species, the PCIFSDs of other samples of paddy rice and Dracaena sanderiana are acquired at different incident angle (90° and 45°) of excitation light source in an additional experiment. Paddy rice and Dracaena sanderiana at two different incident angle all have similar PCIFSDs (Fig. 4e and g, Fig. 4d and h), respectively. The results demonstrate that LIF fluorescence properties of plant species could be as unique fingerprint to distinguish different plant types and species. It also provides an evidence of the repeatability of the experiment.
This journal is © The Royal Society of Chemistry 2015 |