Dispersive micro-solid-phase extraction of dopamine, epinephrine and norepinephrine from biological samples based on green deep eutectic solvents and Fe3O4@MIL-100 (Fe) core–shell nanoparticles grafted with pyrocatechol

T. Khezeli and A. Daneshfar*
Department of Chemistry, Faculty of Science, Ilam University, Ilam, 69315-516, Iran. E-mail: daneshfara@yahoo.com; adaneshfar@mail.ilam.ac.ir; Fax: +98-843-2227022; Tel: +98-843-2227022

Received 1st May 2015 , Accepted 24th July 2015

First published on 24th July 2015


Abstract

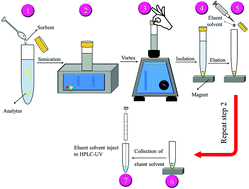
A selective and sensitive method based on dispersive micro-solid-phase extraction and green deep eutectic solvents (DESs) was developed for the extraction of dopamine (DA), epinephrine (EP) and norepinephrine (NE) from biological samples prior to high performance liquid chromatography (HPLC-UV). The Fe3O4@MIL-100 (Fe) core–shell nanoparticles grafted with pyrocatechol were synthesized and characterized using scanning electron microscopy (SEM), transmission electron microscopy (TEM), vibrating sample magnetometry (VSM) and infrared spectroscopy (IR). The fractional factorial design (FFD) and central composite design (CCD) of response surface methodology (RSM) were used in the experimental design and optimization of the extraction efficiency. Under optimized conditions, calibration graphs of DA, EP and NE were linear in a concentration range of 1–300 μg L−1 with correlation coefficients of more than 0.9966. Limits of detection and quantification were in the range of 0.22–0.36 μg L−1 and 0.78–1.20 μg L−1, respectively. This procedure was successfully employed in determining target analytes in spiked human urine and serum samples; the relative mean recoveries ranged from 91.4 to 103.4%.


Introduction

Dopamine (DA), epinephrine (EP) and norepinephrine (NE) belong to the catecholamine family and exist in the mammalian central nervous system.1,2 They can play an important role in the regulation of the central and peripheral nervous system and can be clinically measured in the diagnosis and therapeutic of several diseases.3,4 A deficiency in DA, EP and NE level can cause some serious diseases such as Parkinson, epilepsy and senile dementia in humans.5,6 Common methods for the determination of DA, EP and NE include chemiluminescence, fluorimetry, ultraviolet-visible spectrometry, and capillary electrophoresis.7–10 Because of their electrochemical activity, they can also be determined with electrochemical methods. Electrochemical techniques have advantages such as low limit of detection, high speed and accuracy.11 However, a major drawback frequently encountered in the electrochemical detection of catecholamines (especially DA) is interference of ascorbic acid which exists in biological samples in relatively high concentrations.12,13 Accordingly, the determination of trace concentration of catecholamines and related compounds in biological samples requires highly specific and sensitive methods. Nowadays, there is considerable interest to micro-extraction techniques because of low limit of detection, simplicity, high sensitivity and pre-concentration capability of them. Among the micro-extraction methods, dispersive micro-solid-phase extraction is widely used for the pre-concentration of analytes prior to chromatography separation. Dispersive micro-solid-phase extraction is based on the dispersion of adequate amount of micro or nano-adsorbents in the aqueous solution in order to absorption of target analytes. Different adsorbents such as activated carbon, modified silica gel and magnetic nanoparticles (MNPs) have been used in this technique.14–16 Among the nano-sorbents, MNPs are interest because they can be easily isolated from matrix using an external magnetic field.17 The major drawbacks of MNPs are easy aggregation and oxidation.18,19 A usual procedure to overcome these limitations is coating the surface of MNPs with different organic reagents.16,20 Coated MNPs have more stability and selectivity than MNPs.21

Recently, metal-organic frameworks (MOFs), built up from organic linkers and inorganic connectors, as a novel class of nanoporous adsorbents have drawn special interest in SPE.22,23 MOFs exhibit several advantages such as their easy tunable composition (metal ions and organic linkers), versatility in the synthetic preparation conditions, high specific surface areas, crystallized structure, much wide range of pore sizes and facilely tailorable functionality.24–26 MOFs, unlike all their advantages are unstable under acidic conditions.27,28 Some literatures reported ways to modification of MOFs using different materials.29,30 Postsynthetic modification has been utilized as a powerful tool for introducing functionality to MOFs by covalent reactions. The incorporation of functional groups on the linking ligands can provide an opportunity to develop MOFs with a variety of functionalities.31,32 Many researcher groups systemically investigated the application of MOFs from sample collection to chromatographic separation.33 Chen et al. and Qiu et al. synthesized and characterized magnetic MOF core–shell named Fe3O4@MIL-100 (Fe) (MIL: Material Institute Lavoisier) for the analytical propose. They selected Fe3O4 nanoparticles as the core due to their good magnetic properties and low toxicity.34,35

Although, the selection of proper sorbent is crucial in adsorption step of dispersive micro-solid-phase extraction, selecting suitable eluent solvent to completely desorb analytes from sorbent is important too. Ionic liquids (ILs) can be increased the desorption capacity of extraction method through the hydrogen bonding and dipole–dipole interaction with analytes. ILs contain organic cations and inorganic anions with unique properties such as low melting temperature, high thermal stability, wide liquid phase range, non-flammability and low vapor pressure.36,37 High price and toxicity are the disadvantage of imidazolium-based ILs.38,39 Deep eutectic solvents (DESs) are green solvents belong to ILs class. DES formed by complexion of quaternary ammonium salt (usually choline chloride) together with a hydrogen bond donor (HBD) containing functional groups such as carboxylic acids, urea or alcohols.40,41 The formation of hydrogen bonding between the halide anion of choline chloride and functional groups of hydrogen donor agents is responsible for the decrease in the freezing point of DESs relative to the melting points of the individual components.42,43 Green DESs have many application in different fields such as catalysis, organic synthesis, electrochemistry, solubility studies and etc.44–47

In this study we report an extraction method based on dispersive micro-solid-phase extraction. Our method is novel from two aspects. First, for the first time the Fe3O4@MIL-100 (Fe) core–shell grafted with pyrocatechol were used for the selective extraction of DA, EP and NE from biological samples. Second, hazardous solvents that many used in desorption step were substituted with environmental friendliness and safety solvent (DES).

The effects of several factors on the extraction efficiency of analytes were studied based on response surface methodology (RSM). Applying univariate optimization facilitates the interpretation of the obtained results, but the interactions among the factors were not taken into consideration. Moreover, univariate optimization requires a high number of experiments and is also time consuming. So as to overcome the foregoing problems, simultaneously study based on fractional factorial design (FFD) for the screening of factors and central composite designs (CCD) for the optimization of significant factors were done.

Reagents and solutions

Dopamine (DA), epinephrine (EP), norepinephrine (NE), sodium hydroxide, sodium chloride, hydrochloric acid, acetonitrile, methanol, mercaptoacetic acid (MAA), pyrocatechol, benzene-1,3,5-tricarboxylic acid (BTC), choline chloride, urea, ethylene glycol and glycerol were supplied by Merck (Darmstadt, Germany). A stock solution of target analytes (100 mg L−1) was prepared in 0.2% (v/v) phosphoric acid and working standard solutions were prepared by dilution of stock solution with double distilled water.

Instrumentations

The HPLC system (model SCL-10Avp, Shimadzu, Japan) consists of a UV detector (model SPD-10Avp), operating at a wavelength of 275 nm, dual solvent pump (model LC-10Avp) and an injection valve (model EIG 001). A KNAUER column (4.6 mm × 250 mm, particle size, 5 μm, Eurospher 100-5 C8) with a pre-column (Eurospher 100-5 C8) was used for separation. The mobile phase was made up of phosphate buffer and methanol (90[thin space (1/6-em)]:[thin space (1/6-em)]10, v/v; pH 2.5). The flow rate was set at 1 mL min−1. The pH measurements were made with a 780 pH meter (Metrohm, Switzerland) equipped with a combined Ag/AgCl glass electrode. The Centurion Scientific Centrifuge (K280R, UK) was used for centrifuging. Fourier transform-infrared spectrometer (Bruker, Vertex 70, FT-IR spectrometer) was used to identify functional groups using KBr pellet technique. Transmission electron microscope (TEM) and scanning electron microscope (SEM, FE-SEM, Hitachi S4160) images were recorded to visualize the morphology and size of magnetic NPs.

Synthesis of grafted magnetic core–shell NPs

The synthesis of grafted magnetic core–shell adsorbent consists of three steps.
(a) Synthesis of Fe3O4 NPs. Fe3O4 NPs were synthesized by the solvothermal method.48 Briefly; FeCl3·6H2O (2 g) and FeCl2·4H2O (5.4 g) were dissolved in 100 mL deionized water at 80 °C under vigorous stirring and nitrogen stream. Then, concentrated ammonia (10 mL) was injected into the mixture and allowed to stir for 30 min. The resulting black precipitate was separated with an external magnet and washed several times with degassed water and dried in oven (40 °C).
(b) Synthesis of Fe3O4@MIL-100 (Fe) core–shell. Fe3O4@MIL-100 (Fe) core–shell were synthesized according to a reported literature.24 Briefly, Fe3O4 NPs (0.1 g) were added to 20 mL of an ethanol solution of MAA (0.58 mmol L−1) under shaking for 24 h. The product was collected with an external magnet and washed several times with distilled water and ethanol, respectively. Subsequently, 0.1 g of the MAA-functionalized Fe3O4 NPs was dispersed in 5 mL of FeCl3·6H2O ethanol solution (10 mmol L−1) for 15 min and then in 5 mL of BTC ethanol solution (10 mmol L−1) for 30 min at 70 °C. Finally, the resulting brown materials were washed with ethanol and dried in an oven at 100 °C.
(c) Synthesis of Fe3O4@MIL-100 (Fe) core–shell grafted with pyrocatechol. Fe3O4@MIL-100 (Fe) NPs (20 mg), ethanol (2 mL) and pyrocatechol (100 mg) were mixed together in around-bottomed flask. The mixture was refluxed at 70 °C for 24 h. The resulting dark brown materials were collected and washed with fresh ethanol and dried under vacuum at 70 °C for 24 h.

Preparation of DESs

All DESs were prepared according to the method described by Abbot et al.49,50 Briefly, DES1, DES2 and DES3 were synthesized by mixing choline chloride with urea, ethylene glycol and/or glycerol in screw-capped bottle (molar ratios 1[thin space (1/6-em)]:[thin space (1/6-em)]2), respectively. The mixture was then stirred in an oil-bath at a temperature of 80 °C until a clear liquid was formed.

Dispersive micro-solid-phase extraction procedure

10 mL of aqueous sample solution containing analytes (100 μg L−1) and 22 mg of adsorbent (grafted Fe3O4@MIL-100 (Fe) NPs) were placed in a 15 mL flat-bottom sample vial. The mixture was firstly sonicated for a few seconds and secondly shaken vigorously using a vortex agitator for 5 min. After this time, the magnetic adsorbent was collected using an external magnet. The aqueous solution was discarded and 50 μL of eluent solvent (phosphate buffer[thin space (1/6-em)]:[thin space (1/6-em)]DES1; 7[thin space (1/6-em)]:[thin space (1/6-em)]3 v/v) was added to the adsorbents and the mixture was sonicated for 12[thin space (1/6-em)]:[thin space (1/6-em)]30 min. Then, the magnetic particles were collected by an external magnet and the eluent solvent was withdrawn using a micro-syringe. About 20 μL of the eluent solvent was injected into the HPLC system for analysis.

Collection of serum and urine samples

Human serum and urine samples were collected from volunteers. The urine sample was filtered using Whatman no. 42 filter paper and then stored at 4 °C in the dark. Before analysis of human serum, in order to precipitate proteins and decrease the matrix effect of this complicated sample, 3 mL of acetonitrile was added to the 1 mL of human serum and centrifuged at 2000 rpm for 10 min and the supernatant was collected and diluted with water. Urine sample was centrifuged at 2000 rpm for 10 min and diluted with water. Finally, 10 mL of diluted human serum or urine sample was submitted to the above mentioned procedure.

Results and discussion

Characterization of Fe3O4, Fe3O4@MIL-100 (Fe), grafted Fe3O4@MIL-100 (Fe) NPs and DESs

FT-IR spectra of BTC, Fe3O4, Fe3O4@MIL-100 (Fe) and grafted Fe3O4@MIL-100 (Fe) NPs were examined and the results are shown in Fig. 1a. In the Fe3O4 spectrum, the characteristic peak presented at 582 cm−1 verifies the Fe–O vibration. The incorporation of MOF into Fe3O4 NPs has been highlighted in a previous reported literature using FT-IR spectroscopy. In the FT-IR spectra of Fe3O4@MIL-100 (Fe) NPs absorption bands of O–C–O (1567 and 1444 cm−1), bending vibration of C[double bond, length as m-dash]C (709 cm−1), bending vibration of C–H (760 cm−1) and vibration of O–H (3457 cm−1) belonging to BTC are demonstrated. These results are similar to those obtained by other researchers.32,51 The FT-IR spectra of pure BTC indicates a characteristic band at 1720 cm−1 (C[double bond, length as m-dash]O vibration). Yaghi et al. reported that the absorption band of COOH at 1730–1690 cm−1 was absent in the FT-IR spectrum of MOF. This fact indicates the complete deprotonation and reaction of BTC with metal ions center of MOF.52 As it can be observed from Fig. 1a, in the FT-IR spectra of Fe3O4@MIL-100 (Fe) NPs the intensity of C[double bond, length as m-dash]O vibration of bonded BTC (1720 cm−1) in comparison with that of pure BTC decreased significantly. The low intensity band at 1720 cm−1 clarifies the existence of free COOH groups. The incorporation of pyrocatechol into Fe3O4@MIL-100 (Fe) NPs is more difficult to demonstrate by spectroscopy. When we compare the FT-IR spectra of grafted Fe3O4@MIL-100 (Fe) NPs with that of Fe3O4@MIL-100 (Fe) NPs, it is clearly visible that there is a significant decrease in the intensity of 1720, 1567 and 1444 cm−1 bands. This may be due to the existence of interaction between the free COOH groups of BTC and OH groups of pyrocatechol and π–π interaction of aromatic rings.
image file: c5ra08058d-f1.tif
Fig. 1 (a) FT-IR spectra of BTC, Fe3O4, Fe3O4@MIL-100 (Fe) and grafted Fe3O4@MIL-100 (Fe) NPs; (b) SEM and (c) TEM image of grafted Fe3O4@MIL-100 (Fe) NPs; (d) VSM of Fe3O4 and grafted Fe3O4@MIL-100 (Fe) NPs; (e) FT-IR spectra of urea, ethylene glycol, glycerol, DES1, DES2 and DES3.

The morphology of grafted Fe3O4@MIL-100 (Fe) NPs was identified by SEM and TEM techniques. SEM investigations reveal that grafted Fe3O4@MIL-100 (Fe) NPs are nearly spherical (Fig. 1b). The TEM image showed that finally formed grafted Fe3O4@MIL-100 (Fe) magnetic microspheres are composed of a Fe3O4 core and a grafted MIL-100 (Fe) NPs shell, clearly demonstrating the formation of a core–shell structure (Fig. 1c). Vibrating sample magnetometry (VSM) was used to investigate the magnetic properties of the resultant core–shell (see Fig. 1d). The prepared microspheres exhibited strong magnetic properties (magnetization saturation values were 67.6 and 49.1 emu g−1 for Fe3O4 and grafted Fe3O4@MIL-100 (Fe) NPs, respectively) which indicated that the magnetic microspheres could be used for magnetic separation. Compared with pure Fe3O4 NPs, grafted Fe3O4@MIL-100 (Fe) NPs exhibit a lower saturation magnetization. It is considered that the presence MIL-100 (Fe) shell and pyrocatechol, mainly results in the reduction of saturation magnetization.

FT-IR spectra of pure choline chloride, urea, ethylene glycol, glycerol and DESs were examined and the results are shown in Fig. 1e. The formation of hydrogen bonding between the halide anion of choline chloride and urea, ethylene glycol and/or glycerol is the main force for the formation of DESs. In the FT-IR spectra the characteristic peak presented at 3279 cm−1, 3393 cm−1 and 3401 cm−1 is due to the O–H vibration of choline chloride, ethylene glycol and glycerol, respectively. The vibrations positioned at 3469 cm−1 and 1063 cm−1 belonging to N–H and C–N vibrations of urea and choline chloride, respectively. In the FT-IR spectrum of DESs the O–H vibrations of ethylene glycol and glycerol and N–H vibration of urea shifted to 3377 cm−1, 3387 cm−1 and 3415 cm−1, respectively. Because the cloud of electrons of the oxygen atom of ethylene glycol and glycerol and nitrogen atom of urea transfer to the hydrogen bonding, resulting in a smaller force constant. Thus, the shift of the O–H and N–H vibrations suggests the existence of hydrogen-bonding between HBDs and choline chloride when the DESs are formed.

Selection of type of buffer

Different buffers such as phosphate, acetate, citrate and borate were tested as eluent solvents. Under the same extraction and desorption conditions, the desorption efficiency of mentioned buffers decreased in the following order: phosphate > citrate > acetate > borate (Fig. 2a). This order is compatible with Ka value (acidity constant) of phosphoric, citric, acetic and boric acid. The highest Ka value of phosphoric acid led to better ionization and solubilization of target analytes.
image file: c5ra08058d-f2.tif
Fig. 2 Effect of type of buffer (a), type of DES (b) and volume ratio of DES[thin space (1/6-em)]:[thin space (1/6-em)]buffer (c) on the extraction of DA, EP and NE.

Effect of type and amount of DES

Because of the polarity of DESs and existence of OH, NH2 and/or NH groups in both DESs (solvents) and DA, EP and NE (solutes), the desorption ability of eluent buffer in the presence of DESs can be increased through the hydrogen bonding and dipole–dipole interaction between solutes and solvents. Accordingly, different mixtures of phosphate buffer and DESs at volume ratio 9[thin space (1/6-em)]:[thin space (1/6-em)]1 were tested. The extraction efficiency of the different mixtures of phosphate buffer and DESs decreased in the following order: DES1 > DES2 > DES3 (Fig. 2b). In the case of DES1 the HBD is urea with a carbonyl and two NH2 groups. Due to the presence of the adjacent carbonyl moiety, the N–H bond in the NH2 group is more strongly polarized than that of the alcohols (ethylene glycol and glycerol). This fact enables DES1 to form stronger H-bonding interactions with DA, EP and NE than DES2 or DES3, meaning that DES1 has higher solute-carrying capacity than the other two DESs. Moreover, the extraction efficiency of DES2 was more than DES3. This can be explained as follow: first, viscosity of DES3 (259 cp at 25 °C) is higher than DES2 (36 cp at 25 °C). Second, DA, EP and NE can be considered as a type of HBD. Therefore, ethylene glycol and glycerol and target compounds can be interacting with a halide anion of choline chloride. In DES3, three hydroxyl groups of glycerol have considerable steric hindrance that prevents the interactions between the target analytes and chloride anion. Therefore, the extraction efficiency more decreased in the presence of DES3.

The effect of volume ratio of phosphate buffer[thin space (1/6-em)]:[thin space (1/6-em)]DES1 was investigated in the range of 10[thin space (1/6-em)]:[thin space (1/6-em)]0 to 3[thin space (1/6-em)]:[thin space (1/6-em)]7. The analytical signal for all target compounds increased up to 7[thin space (1/6-em)]:[thin space (1/6-em)]3 volume ratios of phosphate buffer[thin space (1/6-em)]:[thin space (1/6-em)]DES1. For the volume ratios more than 7[thin space (1/6-em)]:[thin space (1/6-em)]3, the analytical signals decreased because the viscosity of eluent solvent was increased (see Fig. 2c). The volume ratios more than 3[thin space (1/6-em)]:[thin space (1/6-em)]7 were not studied because the viscosity of eluent solvent was very high so that the adsorbent cannot be easily dispersed.

Fractional factorial design

The factors influential in the analytical response were screened by employing FFD with two central points for estimating the pure error. Table 1S lists the coded and actual values of factors and respective responses. In order to minimize the effect of non-controlled variables, the design was performed randomly. The Pareto chart of the main effects shows that the amount of adsorbent (mg), the volume of eluent solvent (μL) and desorption time (min) were significant factors with a 95% confidence level (Fig. 1S). The result discussed in details in ESI section.

Central composite design

The relationship between three independent factors (the amount of adsorbent (mg), the volume of eluent solvent (μL) and desorption time (min)) for the extraction of DA, EP and NE was investigated based on CCD. Table 2S summarizes the experiments design, in coded and actual values, and responses values for the extraction of target analytes. Experiments were carried out in random order and according the run order. Pareto chart for the CCD are shown in Fig. 2S. Aided by RSM, a model was fitted for each design to the extraction efficiency of target analytes. The quadratic model to predict the enrichment factor in terms of actual factors is as follow:
EF = 167.49 + 19.57X1 − 43.08X12 + 3.97X2 − 30.49X22 + 4.51X3 − 7.23X32 + 6.1X1X2
where EF is the average enrichment factor of analytes, X1 is the amount of adsorbent, X2 is the volume of eluent solvent and X3 is desorption time. In order to study the significance and fitness of the model, analysis of variance (ANOVA) was performed (Table 3S). Data were also analyzed to test the normality of the residuals (Fig. 3S). As it can be observed, the errors are normally distributed and lack of any trends testifies to the normality of the hypotheses. The details of ANOVA table were discussed in ESI section. Fig. 3 shows the various 3D plots. The results show that the EF rises with increasing in the adsorbent amount from 10 to 22 mg. For amounts lower than 22 mg, the available surface area of adsorbent is inadequate for a quantitative recovery of analytes. Furthermore, for amounts more than 22 mg, due to aggregation, the adsorbent cannot be easily dispersed in aqueous sample and, as a result, the extraction efficiency of target analytes decreases. Fig. 3 indicates the effect of the volume of eluent solvent in the range of 40–60 μL where the extraction efficiency improves by increasing the volume up to 50 μL. Volumes less than 50 μL are not enough for the elution of the adsorbent during sonication process which decreasing the determination efficiency. For volumes more than 50 μL, the analytical signal was decreased because the dilution effect becomes predominant. Therefore, this factor was set at 50 μL. According to result obtained from Fig. 4, 22 mg of adsorbent, 50 μL of eluent solvent and 12[thin space (1/6-em)]:[thin space (1/6-em)]30 min of desorption time was chosen as the optimum conditions for the extraction of DA, EP and NE. Finally, five set of experiments were performed at an optimum predicted value for each factor. The results show that a good agreement exists between the predicted values by the model and the experimental values at the points of interest. It should be noted that the relative standard deviation (RSD) of analytes replicate extraction from the predicted values was less than 5.4%.

image file: c5ra08058d-f3.tif
Fig. 3 3D plots of significant factors: X1: amount of sorbent (mg); X2: volume of eluent solvent (μL) and X3: desorption time (min).

image file: c5ra08058d-f4.tif
Fig. 4 The effect of interference of ascorbic acid on the extraction efficiency of target analytes (a); comparison the extraction efficiency of Fe3O4@MIL-100 (Fe) NPs with grafted Fe3O4@MIL-100 (Fe) NPs (b).

The study of the reusability of grafted Fe3O4@MIL-100 (Fe) NPs

In order to determination the reusability of grafted Fe3O4@MIL-100 (Fe) NPs, the magnetic sorbent isolated from the aqueous solution by an external magnetic force, washed with methanol and reused for the next micro-extraction run. Fig. 4S shows that the grafted Fe3O4@MIL-100 (Fe) NP does not exhibit any change in its adsorption performance after six runs.

Sorption capacity

The sorption capacity which is defined as the amount of analyte sorbed per gram of sorbent is an important factor to evaluate the synthesized magnetic adsorbent. In order to investigate the sorption capacity of grafted Fe3O4@MIL-100 (Fe) NPs, a standard solution containing DA, EP and NE (200 mg L−1) was used. To evaluate the sorption capacity of each analyte, the difference between the concentration of the solution before and after extraction was calculated. The sorption capacity of sorbent was found to be 75.57, 70.48 and 73.26 mg g−1 for DA, EP and NE, respectively.

Selectivity study

The selectivity of grafted Fe3O4@MIL-100 (Fe) NPs for the determination of target analytes was studied under optimized conditions. Generally, ascorbic acid coexists with DA, EP and NE in biological samples. During the extraction process ascorbic acid may be competed with target analytes for adsorption on the adsorbents and decrease the sensitivity of analysis. To investigate the selectivity of grafted Fe3O4@MIL-100 (Fe) NPs, several experiments were conducted at different concentration ratios of analytes to ascorbic acid from 1[thin space (1/6-em)]:[thin space (1/6-em)]0 to 1[thin space (1/6-em)]:[thin space (1/6-em)]10. The results indicate that in the presence of ascorbic acid, no change is seen in the level of analytical signal (Fig. 4a). The reason is due to the electrostatic interactions between the electric field generated by pyrocatechol and the dipole moment of the aromatic ring in DA, EP and NE. Also, interactions of the metal in the MOF with the delocalized π electrons of aromatic ring of target analytes enhanced the selectivity of grafted Fe3O4@MIL-100 (Fe) NP. These interactions are not occurred between ascorbic acid and adsorbent. The high adsorption affinity to DA, EP and NE makes the grafted Fe3O4@MIL-100 (Fe) NPs to be excellent adsorbent in the following study of real sample analysis.

The ability of grafted Fe3O4@MIL-100 (Fe) NPs for the adsorption of target analytes was compared with Fe3O4@MIL-100 (Fe) NPs. As it can be observed from Fig. 4b higher extraction efficiency was obtained using grafted Fe3O4@MIL-100 (Fe) NPs as sorbent. This difference in the extraction efficiency may be due to the functional groups of BTC and pyrocatechol. In the case of Fe3O4@MIL-100 (Fe) NPs, due to the presence of carboxylic groups of BTC the cloud of electrons of benzene ring is lower than that of pyrocatechol, resulting in a smaller π–π interaction of target analytes with sorbent. This again indicates the incorporation of pyrocatechol into Fe3O4@MIL-100 (Fe) NPs.

Method analytical performance

Linearity, limits of detection (LODs), limits of quantification (LOQs) and precision were employed in validating dispersive micro-solid-phase extraction method. LODs and LOQs were calculated as 3 s/m and 10 s/m, respectively. Where ‘s’ is the standard deviation of 10 replicate measurements at lower concentration of calibration curves (1 μg L−1) and ‘m’ is the slope of each calibration curve. LODs and LOQs were in the range of 0.22–0.36 μg L−1 and 0.78–1.20 μg L−1, respectively. The RSDs were tested at the concentration of 100 μg L−1 for target analytes in replicate (n = 3). As it can be observed all RSDs are lower than 5.4%. The results are listed in Table 1.
Table 1 Quantitative results obtained from the extraction of DA, EP and NE
Analyte Linear range (μg L−1) LOD (μg L−1) LOQ (μg L−1) r2 n
DA 1.0–300 0.22 0.78 0.9966 10
EP 1.0–300 0.26 0.87 0.9972 10
NE 1.0–300 0.36 1.20 0.9984 10


To examine the applicability of the proposed method different real samples were analyzed. The concentration of target analytes was determined in replicate (n = 3) using standard addition method. Urine and serum samples were spiked with different concentration levels of target analytes. As it can be seen in Table 2, RSDs are less than 3.3% while the recoveries are more than 91.4%. Representative chromatograms of human urine and serum samples are shown in Fig. 5, where the peaks of analytes are free from interference peaks.

Table 2 Results from recovery of DA, EP and NE from biological samples
Sample Analyte Found (μg L−1) 10 (μg L−1) 100 (μg L−1) 200 (μg L−1)
a Not detected.
Urine DA ND 93.1 96.9 98.9
EP 4.30 96.9 101.5 99.4
NE ND 102.2 98.9 101.5
Serum DA 7.07 103.4 97.9 99.2
EP NDa 101.5 100.6 99.6
NE ND 91.4 103.3 97.2


image file: c5ra08058d-f5.tif
Fig. 5 HPLC-UV chromatograms of extracted by dispersive micro-solid-phase extraction under optimized conditions: (A) standard of analytes (1; EP), (2; DA), (3; NE); (B) human urine; and (C) human serum.

Comparison of dispersive micro-solid-phase extraction with other reported methods

The characteristics of our method (LOD, linear range (LR), r2, RSD, recovery (R), EF and sorption capacity) were compared with molecularly imprinted micro-solid-phase extraction,53 single-walled carbon nanotubes,54 molecularly imprinted solid phase micro-extraction fiber,55 molecularly imprinted poly (nicotinamide)/CuO nanoparticles modified electrode,56 and open-tubular capillary electro-chromatography (CEC) using grapheme oxide molecularly imprinted polymers as the stationary phase.3 As it can be observed from Table 3, the characteristic parameters of this work have proven to be similar to or better than those of other reported methods.
Table 3 Comparison of present method with reported methods for the determination of DA, EP and NE
Parameter Reference
Instrument Analyte EF Sorption capacity RSD (%) R (%) r2 LOD LR
a Capillary electrophoresis.
Electrochemical EP 256.41 ng g−1 2.49 100.0 0.990 0.002 μg L−1 0.005–8 μg L−1 53
Electrochemical DA 4.90 100.9 0.997 2.4 μmol L−1 100–500 μmol L−1 54
CEa-UV DA, EP, NE 100 51–84 ng <6.1 85–94 >0.995 4.8–7.4 nmol L−1 10–600 nmol L−1 55
Electrochemical DA 84.3 mg g−1 6.2 0.998 8 nmol L−1 0.02–25 μmol L−1 56
CEC DA, EP, NE <6.1 90.3–109.6 >0.995 1.25–10 μg mL−1 5–200 μg mL−1 3
HPLC-UV DA, EP, NE 164 73.2–75.5 mg g−1 <5.4 91.4–103.4 >0.996 0.22–0.36 μg L−1 1–300 μg L−1 This work


Conclusions

The present study undertook analyzing the application of synthesized grafted Fe3O4@MIL-100 (Fe) NPs in dispersive micro-solid-phase extraction for the pre-concentration of DA, EP and NE. The extraction method provided a simple, fast, sensitive and selective way for the determination of target analytes without interfere of ascorbic acid from biological samples. Moreover, in this research, eco-friendly, non-toxic and green deep eutectic solvents were used to enhance the extraction efficiency and desorption capacity. Due to the good selectivity of adsorbent and low LODs, the proposed method is a potential tool for the diagnosis of trace amounts of target analytes in complicated matrix.

Acknowledgements

The authors would like to acknowledge Ilam University for funding this work.

Notes and references

  1. K. Liu, H. Pang, J. Zhang, H. Huang, Q. Liu and Y. Chu, RSC Adv., 2014, 4, 8415 RSC.
  2. V. Carrera, E. Sabater, E. Vilanova and M. A. Sogorb, J. Chromatogr. B: Anal. Technol. Biomed. Life Sci., 2007, 847, 88 CrossRef CAS PubMed.
  3. N. Ye and J. Li, J. Sep. Sci., 2014, 37, 2239 CrossRef CAS PubMed.
  4. Y. Weng, H. Zeng, Y. Nakagawa, S. Ikeda, F. Chen, H. Nakajima and K. Uchiyama, Chromatography, 2013, 34, 1 CrossRef.
  5. J. M. Savitt, V. L. Dawson and T. M. Dawson, J. Clin. Invest., 2006, 116, 1744 CAS.
  6. S. D. Iversen and L. L. Iversen, Trends Neurosci., 2007, 30, 188 CrossRef CAS PubMed.
  7. T. Thomas, R. J. Mascarenhas, B. E. K. Swamy, P. Martis, Z. Mekhalif and B. S. Sherigara, Colloids Surf., B, 2013, 110, 458 CrossRef CAS PubMed.
  8. R. Zhu and W. T. Kok, Anal. Chem., 1997, 69, 4010 CrossRef CAS PubMed.
  9. A. Bacaloni, S. Insogna, A. Sancini, M. Ciarrocca and F. Sinibaldi, Biomed. Chromatogr., 2013, 27, 987 CAS.
  10. Y. Wu, R. Fan and J. Di, Chin. J. Anal. Chem., 1996, 24, 873 CAS.
  11. L. F. Xiao, J. Chen and C. S. J. Cha, Electroanal. Chem., 2000, 495, 27 CrossRef CAS.
  12. C. Y. Wang, Z. X. Wang, A. P. Zhu and X. Y. Hu, Sensors, 2006, 6, 1523 CrossRef CAS.
  13. Y. L. Zeng, C. X. Li, C. R. Tang, X. B. Zhang, G. L. Shen and R. Q. Yu, Electroanalysis, 2006, 18, 440 CrossRef CAS.
  14. M. T. García-Valverde, R. Lucena, F. Galán-Cano, S. Cárdenas and M. Valcárcel, J. Chromatogr. A, 2014, 1343, 26 CrossRef PubMed.
  15. F. Galán-Cano, R. Lucena, S. Cárdenas and M. Valcárcel, Microchem. J., 2013, 106, 311 CrossRef.
  16. E. M. Reyes-Gallardo, R. Lucena, S. Cárdenas and M. Valcárcel, J. Chromatogr. A, 2014, 1345, 43 CrossRef CAS PubMed.
  17. A. A. Asgharinezhad, N. Mollazadeh, H. Ebrahimzadeh, F. Mirbabaei and N. Shekari, J. Chromatogr. A, 2014, 1338, 1 CrossRef CAS PubMed.
  18. J. Wang, B. Lijuan, Y. Ji, H. Ma and X. Yin, J. Colloid Interface Sci., 2014, 430, 140 CrossRef CAS PubMed.
  19. L. Tang, Y. Fang, Y. Pang, G. Zeng, J. Wang, Y. Zhou, Y. Deng, G. Yang, Y. Cai and J. Chen, Chem. Eng. J., 2014, 254, 302 CrossRef CAS.
  20. T. H. Lim, L. Hu, C. Yang, C. He and H. K. Lee, J. Chromatogr. A, 2013, 1316, 8 CrossRef CAS PubMed.
  21. J. E. Smith, C. D. Medley, Z. Tang, D. Shangguan, C. Lofton and W. Tan, Anal. Chem., 2007, 79, 3075 CrossRef CAS PubMed.
  22. M. Chen, Z. W. Wang, E. C. Sañudob, H. Zhao and C. S. Liu, Inorg. Chem. Commun., 2014, 43, 121 CrossRef CAS.
  23. F. Ke, L. G. Qiu, Y. P. Yuan, F. M. Peng, X. Jiang, A. J. Xie, Y. H. Shen and J. F. Zhu, J. Hazard. Mater., 2011, 196, 36 CrossRef CAS PubMed.
  24. F. Ke, L. G. Qiu, Y. P. Yuan, X. Jiang and J. F. Zhu, J. Mater. Chem., 2012, 22, 9497 RSC.
  25. A. Corma, H. Garcia and F. X. Llabresi Xamena, Chem. Rev., 2010, 110, 4606 CrossRef CAS PubMed.
  26. T. Lee, M. H. Tsai and H. L. Lee, Cryst. Growth Des., 2012, 12, 3181 CAS.
  27. A. Ahmed, N. Hodgson, M. Barrow, R. Clowes, C. M. Robertson, A. Steiner, P. McKeown, D. Bradshaw, P. Myers and H. Zhang, J. Mater. Chem. A, 2014, 2, 9085 CAS.
  28. Y. Yoo and H. K. Jeong, Cryst. Growth Des., 2010, 10, 1283 CAS.
  29. Y. Wang, H. Chen, J. Tang, G. Ye, H. Ge and X. Hu, Food Chem., 2015, 181, 191 CrossRef CAS PubMed.
  30. M. R. Sohrabi, Microchim. Acta, 2014, 181, 435 CrossRef CAS.
  31. S. Bernt, V. Guillerm, C. Serre and N. Stock, Chem. Commun., 2011, 47, 2838 RSC.
  32. S. Jung, Y. Kim, S. J. Kim, T. H. Kwon, S. Huh and S. Park, Chem. Commun., 2011, 47, 2904 RSC.
  33. Z. Y. Gu, C. X. Yang, N. Chang and X. P. Yan, Acc. Chem. Res., 2012, 45, 734 CrossRef CAS PubMed.
  34. X. Chen, N. Ding, H. Zang, H. Yeung, R. S. Zhao, C. Cheng, J. Liu and T. W. D. Chan, J. Chromatogr. A, 2013, 1304, 241 CrossRef CAS PubMed.
  35. C. F. Zhang, L. G. Qiu, F. Ke, Y. J. Zhu, Y. P. Yuan, G. S. Xu and X. Jiang, J. Mater. Chem. A, 2013, 1, 14329 CAS.
  36. D. D. Patel and J. Lee, Chem. Rec., 2012, 12, 329 CrossRef CAS PubMed.
  37. M. Deetlefs and K. R. Seddon, Green Chem., 2003, 5, 181 RSC.
  38. C. Rub and B. Konig, Green Chem., 2012, 14, 2969 RSC.
  39. A. P. Abbott, G. Frisch, J. Hartley and K. S. Ryder, Green Chem., 2011, 13, 471 RSC.
  40. K. O. Vigier, A. Benguerba, J. Barrault and F. Jérôme, Green Chem., 2012, 14, 285 RSC.
  41. S. Keskin, D. Kayrak-Talay, U. Akman and Ö. Hortaçsu, J. Supercrit. Fluids, 2007, 43, 150 CrossRef CAS.
  42. Z. Maugeri and P. Domínguez de María, RSC Adv., 2012, 2, 421 RSC.
  43. Q. Zhang, K. D. O. Vigier, S. Royer and F. Jerome, Chem. Soc. Rev., 2012, 41, 7108 RSC.
  44. M. C. Gutierrez, F. Rubio and F. Del Monte, Chem. Mater., 2010, 22, 2711 CrossRef CAS.
  45. M. Bougouma, A. van Elewyck, M. Steichen, C. Buess-Herman and T. Doneux, J. Solid State Electrochem., 2013, 17, 527 CrossRef CAS.
  46. A. P. Abbott, G. Capper, D. L. Davies, K. J. McKenzie and S. U. Obi, J. Chem. Eng. Data, 2006, 51, 1280 CrossRef CAS.
  47. J. T. Gorke, F. Srienc and R. J. Kazlauskas, Chem. Commun., 2008, 1235 RSC.
  48. Y. H. Deng, C. H. Deng, Y. M. Zhang, D. W. Qi, C. Liu, J. Liu, X. M. Zhang and D. Zhang, Adv. Mater., 2009, 21, 1377 CrossRef CAS.
  49. A. P. Abbott, G. Capper, D. L. Davies, R. K. Rasheed and V. Tambyrajah, Chem. Commun., 2003, 70 RSC.
  50. R. Esquembre, J. M. Sanz, J. G. Wall, F. Del Monte, C. R. Mateo and M. L. Ferrer, Phys. Chem. Chem. Phys., 2013, 15, 11248 RSC.
  51. A. Dhakshinamoorthy, M. Alvaro, H. Chevreau, P. Horcajada, T. Devic, C. Serre and H. Garcia, Catal. Sci. Technol., 2012, 2, 324 CAS.
  52. O. M. Yaghi, H. Li and T. L. Groy, J. Am. Chem. Soc., 1996, 118, 9096 CrossRef CAS.
  53. B. B. Prasad, A. Srivastava, A. Prasad and M. P. Tiwari, Colloids Surf., B, 2014, 113, 69 CrossRef CAS PubMed.
  54. C. Lete, S. Lupu, B. Lakard, J. Y. Hihn and F. J. del Campo, J. Electroanal. Chem., 2015, 744, 53 CrossRef CAS.
  55. X. Zhang, S. Xu, J. M. Lim and Y. I. Lee, Talanta, 2012, 99, 270 CrossRef CAS PubMed.
  56. B. Li, Y. Zhou, W. Wu, M. Liu, S. Mei, Y. Zhou and T. Jing, Biosens. Bioelectron., 2015, 67, 121 CrossRef CAS PubMed.

Footnote

Electronic supplementary information (ESI) available: Additional description of the experimental design and supplementary tables and figures referenced in the main text. See DOI: 10.1039/c5ra08058d

This journal is © The Royal Society of Chemistry 2015
Click here to see how this site uses Cookies. View our privacy policy here.