Raman study of α-quartz-type Ge1−xSixO2 (0 < x ≤ 0.067) single crystals for piezoelectric applications

Adrien Lignie, Patrick Hermet, Guillaume Fraysse and Pascale Armand*
Institut Charles Gerhardt Montpellier, UMR CNRS 5253, Université de Montpellier, CC 1504, Place Eugène Bataillon, 34095 Montpellier Cedex 5, France. E-mail: pascale.armand@univ-montp2.fr

Received 1st May 2015 , Accepted 17th June 2015

First published on 17th June 2015


Abstract

As potential candidates for high temperature piezoelectric materials, α-quartz-type Ge1−xSixO2 (0 < x ≤ 0.067) single crystals grown by the flux method were structurally and thermally characterized. When compared to pure α-GeO2, room temperature polarized Raman spectra contained additional lines which have been assigned from density functional theory on a α-Ge0.833Si0.167O2 solid solution. The results highlight that Si–O–Ge bridges were involved. Moreover, a linear relationship between the wavenumber position of the main A1 Raman lines and the SiO2 substitution rate x was also observed. The analysis of the temperature dependence of unpolarized Raman signals of an α-Ge1−xSixO2 phase with x = 0.067 pointed out the high-thermal stability up to 1000 °C of the α-quartz-like structure related to the lack of a libration mode and to the absence of a softening mode with temperature.

Introduction

Piezoelectric single crystals with thermal stability up to 1000 °C can be achieved in the α-quartz family (P3221 space group) with GeO2 composition.1–4 Therefore, as the α-quartz-like structure of GeO2 is the metastable phase at room-conditions, unseeded flux-growth experiments of GeO2 single crystals can give rise to a mixing of single crystals with α-quartz-like and rutile-like structure, the latter being the GeO2 room-conditions stable phase.1 Then, the experimental growth conditions have to be carefully controlled with a low temperature cooling rate.1 Furthermore, unseeded flux-grown GeO2 single crystals with the α-quartz-like structure (α-GeO2) do not present the well-known hexagonal prismatic morphology which unambiguously allows identifying the natural crystallographic axes and faces.1

In order to favor the crystallization of the metastable α-quartz-like structure of GeO2, low-content-SiO2-substituted α-GeO2 single crystals were grown by the unseeded flux method.1,5 Compared to pure α-GeO2, mixed α-Ge1−xSixO2 single crystals (0 < x ≤ 0.067) present the hexagonal prismatic morphology and a crystal volume augmentation is obtained at identical cooling rate.1,5 Thus, as potential candidates for high temperature piezoelectric materials, the structural modulations with composition in the as-grown α-Ge1−xSixO2 solid solution (0 < x ≤ 0.067) synthesized by high-temperature flux-growth technique have to be characterized as well as their thermal stability.

Few characterizations studies have been published on single crystals grown in the GeO2-rich part of the GeO2–SiO2 system.1,5–8 The Ge4+/Si4+ substitution in α-GeO2 hydrothermally-grown single crystals lead to additional infrared bands when compared to pure α-GeO2 attributed to oscillations of Ge–O–Si bridges.7,8 However, no specific Raman signature of mixed Ge–O–Si vibrational modes was, to our knowledge, reported in the literature concerning the α-Ge1−xSixO2 solid solution. In this regards, the phonon properties of single crystals from the GeO2–SiO2 solid solution are of interest and still not fully characterized.

In this paper, room temperature polarized Raman spectroscopy was undertaken on as-grown α-Ge1−xSixO2 solid solution with 0 ≤ x ≤ 0.067. In an attempt to assign the observed additional Raman lines when compared to pure α-GeO2, calculations based on density functional theory (DFT) of α-Ge0.833Si0.167O2 was considered and compared to our experimental results. To approach the thermal stability of the α-quartz-like structure of flux-grown α-Ge1−xSixO2 solid solutions, a temperature dependence Raman spectroscopy investigation was also undertaken on α-Ge0.933Si0.067O2.

Experimental details

Flux-grown α-GeO2-based single crystals were synthesized by spontaneous nucleation. Detailed information about the growth conditions can be found elsewhere.1,5

Different starting chemical compositions (Si[thin space (1/6-em)]:[thin space (1/6-em)]Ge ratios) were used to perform high-temperature synthesis giving α-Ge1−xSixO2 as-grown crystals with substitution rates x comprised between 0.018 ± 0.005 and 0.067 ± 0.005. The chemical compositions were measured by the means of Silicon Drift Detector Energy Dispersive X-rays spectroscopy with an accuracy of ±0.5 at% of Si using Co as standard.

Two different Raman spectrometers were used depending on the desired experimental conditions. Room-temperature polarized Raman spectra were measured in a back-scattering geometry with a Jobin-Yvon T64000 spectrometer using an argon laser (λ = 488 nm) and a CCD cooled by nitrogen. The incident and scattered laser beams were polarized by a half-wave retardation plate. The non-polarized Raman measurements were performed on the most convenient crystallographic orientation of the as-grown crystals.

High-temperature Raman spectra were recorded on a LabRam Aramis (Horiba Jobin-Yvon) spectrometer with a blue diode laser (λ = 473 nm, laser spot of approximately 1 μm in diameter). The sample was first placed in a Linkam TS1500 oven and positioned under microscope (Olympus) with a long focal length objective (50×). The temperature was measured at the bottom of the heating stage, close to the sample, by a thermocouple. Raman spectra were recorded by step of 100 °C. The applied heating rate was 20 °C min−1 and the temperature was stabilized during 300 seconds before each measurement (20 seconds of acquisition per spectrum). The standard error on the effective temperature applied was estimated to be ±30 °C up to 600 °C and ±50 °C over this temperature.

To correct the experimental shift due to the equipment, calibration was made on the two Raman spectrometers by measuring pure silicon and α-GeO2 commercial powder (99.999%, PPM Pure Metals).

The positions, full widths at half maximum (FWHM) and intensities were extracted by deconvolution with pseudo-Voigt functions using the PeakFit software9 after a background subtraction and a normalization based on the intensity of the main vibration line around 443 cm−1. The baseline was described by a second-order polynomial function to fit its thermal increase coming from black-body radiation.

Computational details

The α-Ge0.833Si0.167O2 solid solution was built from a 1 × 1 × 2 supercell of α-GeO2 where one Ge-atom was substituted by one Si-atom. This solid solution is the only choice from a 1 × 1 × 2 supercell that allows combining a moderate computational time and a close comparison with the α-Ge0.933Si0.067O2 experimental Raman spectrum. Lattice parameters and atomic positions were relaxed until the maximum stresses and residual forces were less than 2 × 10⁻⁶ GPa and 6 × 10⁻⁵ Ha Bohr−1, respectively. Dynamical matrix (yielding the phonon frequencies and eigenvectors) was calculated within the density functional perturbation theory framework and the local density approximation10 as implemented in the ABINIT package.11 Convergence was reached for a 70 Ha plane-wave kinetic energy cutoff and an 8 × 8 × 8 mesh of special k-points. Raman intensities were obtained as described in ref. 12.

Results and discussion

Substitution effect

The unpolarized Raman spectra recorded at ambient temperature of pure α-GeO2 (x = 0) and mixed α-Ge1−xSixO2 single crystals (with x = 0.018, 0.044, and 0.067) are displayed in Fig. 1. Despite minor differences on the shape and intensity of the lines with respect to the difference of polarization plane recorded (on rhombohedral R, r, or prismatic m faces1), the Raman spectra of SiO2-substituted α-GeO2 single crystals are close to the pure α-GeO2 spectrum. This latter corresponds to the assignment proposed by Fraysse et al.2. No signature of some additional phases, like r-GeO2 (the rutile-like form) or α-SiO2, is visible on Fig. 1. Moreover, the line at 760 cm−1 reported by Kaindl et al. and assigned to Ge–OH bonds or water-distorted GeO4 entities13 is also missing, indicating a lack of water or hydroxyl group inclusions in these flux-grown single crystals.
image file: c5ra08051g-f1.tif
Fig. 1 Raman spectra of α-GeO2 and three SiO2-substituted α-GeO2 single crystals (x = 0.018, 0.044, and 0.067) grown by spontaneous nucleation. For comparison, the assignments of α-GeO2, (black bars), r-GeO2 (wine bars), and α-SiO2 (green bars) are added.2,13,15 Additional Raman lines to the pure GeO2–SiO2 end-members are marked by an asterisk in the enlarged graph.

Nonetheless, despite great similarities, slight distinctions between the SiO2-substituted and the pure α-GeO2 (x = 0) Raman spectra can be found as four new weak lines around 380, 680, 910, and 1023 cm−1 (marked by an asterisk in the enlarged graph in Fig. 1) are evidenced even for the low-SiO2-content solid solution (x = 0.018). In addition, their intensity increases with the silicon content x. These additional lines are not related to α-GeO2, r-GeO2,2 or α-SiO2 (ref. 15) and are consistent with a direct structural effect on the α-GeO2 lattice of the presence of Si-atoms. In the literature, Balitsky et al. have studied hydrothermally-grown α-Ge1−xSixO2 (1.5 ≤ x ≤ 14.0 mol%) single crystals using Fourier transform infrared spectroscopy at room temperature.7,8 Similarly, they observed additional bands compared to the pure α-GeO2 with maxima close to 1040, 915, 665 and 400 cm−1. These weak infrared bands were attributed to oscillations of Si–O–Ge bridges, while a maximum near 380 cm−1 was identified as due to vibration of Si–Ge pairs.7,8

To fully characterize our SiO2-substituted α-GeO2 single crystals, we have carried out polarized Raman experiment combined with DFT based calculations. Experimentally, we preferred working in the y(zz)ȳ geometry (see Fig. 2) because (i) our flux-grown crystals have the naturally occurring m prismatic faces corresponding to Y-faces,1 and (ii) only the transverse optical phonon modes should be active using this geometry. Theoretically, our calculations give us to access to the atomic eigendisplacement vectors obtained from the diagonalization of the dynamical matrix. These vectors are especially relevant to identify the atoms involved in a specific phonon mode.


image file: c5ra08051g-f2.tif
Fig. 2 Polarized Raman spectra of α-GeO2 (x = 0), α-SiO2 (x = 1), and several substituted compounds (x = 0.018, 0.044, and 0.067) at room temperature. The calculated Raman spectrum of Ge0.833Si0.167O2 at 0 K in the y(zz)ȳ geometry is also indicated for comparison. Additional lines to the pure α-GeO2 and α-SiO2 end-members are marked by an asterisk.

Polarized y(zz)ȳ Raman spectrum of flux-grown α-GeO2 single crystal (x = 0) is dominated by four intense lines centered on 163, 261, 442, and 879 cm−1, (Fig. 2) and assigned to transverse optical phonon modes with A1 symmetry.2 Polarized y(zz)ȳ Raman spectra of mixed α-Ge1−xSixO2 single crystals (with x = 0.018, 0.044 and 0.067) present also the four A1 lines, Fig. 2. However, four additional weaker lines, marked by an asterisk, are also visible. The polarized spectrum of hydrothermally-grown α-SiO2 (x = 1) highlights that these weak lines do not arise from Si–O–Si modes (see Fig. 2).

The additional lines around 380, 680, 910, and 1023 cm−1 were already observed for unpolarized Raman experiments in solid solutions (Fig. 1). The experimental polarized Raman lines have been fitted and they are gathered in Table 1 with their position and full width at half maximum (FWHM). The 676 cm−1 lines being very weak and broad, Fig. 2, they were not fitted and so, only their positions were reported in Table 1.

Table 1 Positions and FWHM (between parenthesis) of Raman lines (both in cm−1) of α-Ge1−xSixO2 single crystals (x = 0, 0.018, 0.044, 0.067, and 1) observed in the y(zz)ȳ geometry, along with calculated line positions of the α-Ge0.833Si0.167O2 solid solution
x = 0 x = 0.018 x = 0.044 x = 0.067 x = 0.167 (calc.) x = 1
163.2 (5.1) 163.8 (6.0) 165.2 (6.5) 171.0 (12.0) 183.80 204.2 (24.6)
261.1 (11.0) 261.7 (13.2) 262.5 (16.3) 265.1 (21.4) 273.11 353.6 (5.2)
380.0 (13.2) 379.8 (14.3) 380.0 (13.8) 379.45
442.2 (15.7) 442.3 (14.6) 442.6 (16.7) 443.4 (16.1) 448.93 463.6 (8.7)
677.4 681.6 682.8 672.77 + 677.05
879.2 (6.0) 879.1 (5.7) 879.3 (6.6) 879.2 (8.0) 875.52 1081.3 (7.6)
907.7 (8.0) 908.1 (8.7) 911.0 (11.2) 920.90
1022.6 (5.8) 1023.1 (9.6) 1024.5 (15.1) 1025.49


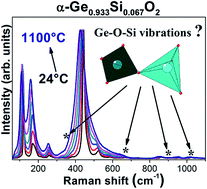
The theoretical Raman spectrum of α-Ge0.833Si0.167O2 reproduces all the experimental lines (position and relative intensity) observed in the SiO2-substituted α-GeO2 spectra (Fig. 2). To identify and to describe the additional Raman lines in our mixed flux-grown single crystals, we compared their position with those obtained by DFT (Table 1). The three observed lines centered around 380, 910, and 1023 cm−1 can directly be assigned to the calculated lines at 379, 921, and 1025 cm−1 in Ge0.833Si0.167O2. For the experimental lines around 680 cm−1, two calculated modes with close wavenumber values can be assigned at 672.78 and 677.05 cm−1, see Table 1. The atomic motions of these modes are displayed in Fig. 3 and highlight that the Si–O–Ge bridges are involved.


image file: c5ra08051g-f3.tif
Fig. 3 Selected normal modes of α-Ge0.833Si0.167O2. Arrows are proportional to the amplitude of the atomic motion. Color of Ge, Si and O atoms is purple, cyan and red respectively.

The slight deviation between the experimental (20 °C) and the calculated (−273 °C) wavenumber positions, see Table 1, could indicate a weak anharmonic behavior in temperature of the Si-substituted flux-grown single crystals (as found in pure α-GeO2 (ref. 2)), despite the Si-richer content considered in the model.

Except for the modes centered on 261 and 1022 cm−1 that broaden the most with the silicon content x, the FWHM of the Raman lines given in Table 1 does not significantly progress as a function of x in α-Ge1−xSixO2 crystals. This behavior is consistent with a good structural and chemical homogeneity in these low-SiO2-substituted α-GeO2 crystals as already pointed out by an X-ray single crystal diffraction investigation.6

The substitution of a part of the Ge4+ cations by Si4+ cations in the α-quartz-like network of GeO2 is accompanied by a frequency-upshift of the most intense Raman line around 442 cm−1, Fig. 4a and Table 1. The two pure end-members α-GeO2 (x = 0) and α-SiO2 (x = 1) recorded in the same experimental conditions are also presented, Fig. 4a and Table 1.


image file: c5ra08051g-f4.tif
Fig. 4 (a) Frequency dependence of the 442 cm−1 Raman line of α-Ge1−xSixO2 single crystals (x = 0, 0.018, 0.044, 0.067, and 1) with the Si-substitution rate x. (b) Positions of the most intense A1 line in polarized Raman spectra of α-Ge1−xSixO2 crystals (x = 0, 0.018, 0.044, 0.067, and 1) with the linear interpolation. Positions of the main Raman lines of several highly SiO2-substituted GeO2 compositions measured by Ranieri et al.15 are also plotted in red.

The position of the most intense Raman line is plotted on Fig. 4b as a function of the substitution rate x. The line on Fig. 4b corresponds to the linear interpolation of the experimental points (black marks only):

 
ν = 442.210 − 0.218(xsi) (1)
where the frequency ν and the Si-substitution rate xSi are given in cm−1 and % respectively.

Red marks on Fig. 4b are the reported positions of the most intense Raman line of highly α-SiO2-substituted GeO2 hydrothermally-grown single crystals measured by Ranieri et al.15 Thus, it appears that the chemical composition of a α-Ge1−xSixO2 solid solution could be directly extrapolated from a simple measurement of the position of its most intense Raman line.

Thermal stability

The thermal dependence of the unpolarized Raman spectrum of a flux-grown α-Ge0.933Si0.067O2 single crystal is reported in Fig. 5.
image file: c5ra08051g-f5.tif
Fig. 5 Raman spectra of α-Ge0.933Si0.067O2 flux-grown single crystal as a function of temperature. The normalization is based on the most intense intensity.

At ambient temperature, fifteen Raman lines are counted in the α-Ge0.933Si0.067O2 spectrum. Set apart the four additional lines at 380, 683, 911, and 1024.5 cm−1 discussed previously, the overall Raman spectrum recorded at ambient temperature is similar to those of compounds crystallized in the α-quartz-like structure (α-SiO2, α-GeO2).2,14,15

During the heat treatment of this α-Ge1−xSixO2 mixed single crystal, no new Raman line was observed characterizing a high thermal stability of the α-quartz-like structure of the flux-grown solid solution. On the contrary, hydrothermally-grown α-Ge1−xSixO2 solid solutions transform into the tetragonal phase around 200–300 °C depending on the Si-substitution rate.7,8

With increasing temperature, the intensity of the Raman lines was lowered in accordance with the weakening of the atomic resonators involved. The intensity of the low-frequency modes seems enhanced due to the normalization based on the most intense line close to 442 cm−1. Indeed, with temperature, the intensity of this latter decrease faster compared to the other lines, increasing their relative intensity. Thus, no soft mode was present in this substituted material, all the lines were conserved at high temperature.

We did not succeed to analyze the thermal evolution of the whole Raman lines due to their broadening upon increasing temperature. Only ten Raman lines out of fifteen were fitted up to 1100 °C. Fig. 6 shows that no strong softening with temperature is observed for the α-Ge0.933Si0.067O2 flux-grown single crystal. As observed in α-GeO2, the phonon modes are very stable over a large temperature range,2 Fig. 6. The slight thermal variations can be described by linear interpolations giving the frequency shift in temperature of α-Ge0.933Si0.067O2 (Table 2). The δνiT values of the substituted compound are close to those reported for pure α-GeO2, showing a similar weak anharmonicity.2 The linear frequency-shift coefficient values are quite low except for the frequency shift of the mode centered at 593 cm−1, Table 2. However, this different trend does not correspond to any physical behavior, but is due to the fitting software. Even a careful control of the fitting parameters does not prevent an excessive broadening and shifting by the fitting software to compensate the asymmetry of the most intense Raman line. The low anharmonicity exhibited by this α-GeO2-based material explains the good accordance between the calculated and the experimental Raman spectra despite a thermal difference of 300 °C, Fig. 2 and Table 1.


image file: c5ra08051g-f6.tif
Fig. 6 Thermal dependence of Raman shifts with their linear interpolation of α-Ge0.933Si0.067O2 single crystal. The error bars are smaller than the symbol size.
Table 2 Frequency shifts of α-Ge0.933Si0.067O2 Raman lines with temperature (from 28 °C to 1000 °C)
νi (cm−1), (T = 28 °C) x = 6.7% Symmetry, (for α-GeO2) νiT) (cm−1/°C), x = 0 from 28 to 1100 °C (ref. 2) νiT) (cm−1/°C), x = 0.067 from 28 to 1000 °C
121.8 E(TO1 + LO1) −0.011(1) −0.013(1)
173.4 A1(TO1) −0.009(1) −0.015(2)
216.6 E(TO2 + LO2) −0.010(1) −0.013(2)
257.6 E(TO3) −0.001(2) −0.005(8)
270.8 A1(TO2) −0.011(2) −0.003(2)
443.6 A1(TO3) −0.018(1) −0.018(1)
525.0
593.7 E(LO6) −0.017(3) −0.027(1)
672.8 −0.035(3)
860.1 E(TO7) −0.018(1)
957.6 E(LO7) −0.015(1) −0.011(4)
1025.3 −0.011(1)


Ranieri et al.15 have shown that, in addition to the libration mode dampening, the α- to β-quartz phase transition can be evidenced by the evolution of the most intense A1 line (which exhibits an opposite thermal evolution both in wavenumber and FWHM after the phase transition). The linear shift of the most intense A1 mode (≈444 cm−1) for our mixed composition studied, Fig. 6, excludes a α- to β-quartz phase transition with temperature. The absence of this phase transition was also supported by previous calculations on pure α-GeO2.2

Thus, the substituted compound analyzed presents an excellent thermal stability, in accordance with the absence of libration mode, as in the pure α-GeO2 end-member.2 The α-quartz-like structure is conserved up to very high-temperature, over 1000 °C. After heating, no macroscopic change (color modification or cracks) was observed in the mixed single crystal.

Conclusions

The Ge4+/Si4+ substitution effect on the Raman spectrum of α-GeO2 was analyzed with the combination of experimental and theoretical results. The formation of the α-Ge1−xSixO2 solid solution conducts to the linear frequency shift of the most intense A1 Raman line with x and to the apparition of four additional lines never reported. These additional Raman lines were related to the deformation of the α-GeO2 lattice network due to the modification of the surroundings of the GeO4 tetrahedra by the presence of Si atoms i.e. the presence of Ge–O–Si mixed vibrations.

The high-thermal stability of the α-quartz-like structure of Ge1−xSixO2 flux-grown phases was linked to the lack of a libration mode and to the absence of a softening mode with temperature. Such stability upon temperature reflects a very low level of defects in the flux-grown α-Ge1−xSixO2 single crystals making them promising materials for high-temperature piezoelectric devices. Nonetheless, further experiments as resonance methods must be performed to confirm this potential.

Author contributions

The manuscript was written through contributions of all authors. All authors have given approval to the final version of the manuscript.

Acknowledgements

We would like to thank Mr D. Maurin for the use of the Jobin-Yvon T64000 Raman spectrometer, Mr D. Bourgogne for his help with the variable-temperature Raman measurements and Dr J. Catafesta for her assistance during the polarized Raman experiments.

References

  1. A. Lignie, P. Armand and P. Papet, Inorg. Chem., 2011, 50, 9311–9317 CrossRef CAS PubMed.
  2. G. Fraysse, A. Lignie, P. Hermet, P. Armand, D. Bourgogne, J. Haines and P. Papet, Inorg. Chem., 2013, 52, 7271–7279 CrossRef CAS PubMed.
  3. A. Lignie, W. Zhou, P. Armand, B. Rufflé, R. Mayet, J. Debray, P. Hermet, B. Ménaert, P. Thomas and P. Papet, ChemPhysChem, 2014, 15, 118–125 CrossRef CAS PubMed.
  4. P. Armand, A. Lignie, M. Beaurain and P. Papet, Crystals, 2014, 4, 168–189 CrossRef PubMed.
  5. P. Armand, S. Clément, D. Balitsky, A. Lignie and P. Papet, J. Cryst. Growth, 2011, 316, 153–157 CrossRef CAS PubMed.
  6. A. Lignie, D. Granier, P. Armand, J. Haines and P. Papet, J. Appl. Crystallogr., 2012, 45, 272–278 CAS.
  7. D. V. Balitsky, V. S. Balitsky, Yu. V. Pisarevsky, E. Philippot, O. Yu. Silvestrova and D. Yu. Puscharovsky, Ann. Chim. Sci. Mat., 2001, 26, 183–192 CrossRef CAS.
  8. D. V. Balitsky, V. S. Balitsky, D. Y. Puscharovsky, G. V. Bondarenko and A. V. Kosenko, J. Cryst. Growth, 1997, 180, 212–219 CrossRef CAS.
  9. Systat, PeakFit, Version 4.11, Systat Software Inc., 1990-2002 Search PubMed.
  10. J. P. Perdew and Y. Wang, Phys. Rev. B: Condens. Matter Mater. Phys., 1992, 45, 13244 CrossRef.
  11. X. Gonze, B. Amadon, P. M. Anglade, J. M. Beuken, F. Bottin, P. Boulanger, F. Bruneval, D. Caliste, R. Caracas, M. Cote, T. Deutsch, L. Genose, P. Ghosez, M. Giantomassi, S. Goedecker, D. Hamann, P. Hermet, F. Jollet, G. Jomard, S. Leroux, M. Mancini, S. Mazevet, M. J. T. Oliveira, G. Onida, Y. Pouillon, T. Rangel, G.-M. Rignanese, D. Sangalli, R. Shaltaf, M. Verstraete, G. Zerah and J. W. Zwanziger, Comput. Phys. Commun., 2009, 180, 2582 CrossRef CAS PubMed.
  12. P. Hermet, M. Veithen and P. Ghosez, J. Phys.: Condens. Matter, 2007, 19, 456202 CrossRef.
  13. R. Kaindl, D. M. Többens, S. Penner, T. Bielz, S. Soisuwan and B. Klötzer, Phys. Chem. Miner., 2012, 39, 47–55 CrossRef CAS.
  14. O. Cambon, G. M. Bhalerao, D. Bourgogne, J. Haines, D. A. Keen and M. G. Tucker, J. Am. Chem. Soc., 2011, 133, 8048–8056 CrossRef CAS PubMed.
  15. V. Ranieri, D. Bourgogne, S. Darracq, M. Cambon, J. Haines, O. Cambon, R. Leparc, C. Levelut, A. Largeteau and G. Demazeau, Phys. Rev. B: Condens. Matter Mater. Phys., 2009, 79, 224304 CrossRef.

This journal is © The Royal Society of Chemistry 2015