Dual channel selective fluorescent detection of Al3+ and PPi in mixed aqueous media: DFT studies and cell imaging applications

Rabiul Alama, Tarun Mistria, Rahul Bhowmicka, Atul Katarkarb, Keya Chaudhurib and Mahammad Ali*a
aDepartment of Chemistry, Jadavpur University, 188 Raja S. C. Mallick Road, Kolkata 700 032, India. E-mail: m_ali2062@yahoo.com; Fax: +91-33-2414-6223
bMolecular & Human Genetics Division, CSIR-Indian Institute of Chemical Biology, 4 Raja S.C. Mallick Road, Kolkata-700032, India

Received 1st May 2015 , Accepted 11th June 2015

First published on 11th June 2015


Abstract

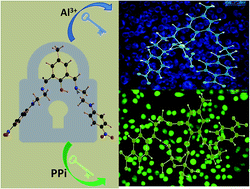
A new, easily synthesizable chemosensor, DFC-EN-p-Ph-NO2, derived by the Schiff base condensation between 2,6-diformyl-p-cresol and N-(4-nitrophenyl)ethylenediamine, with potential N4O donor atoms was found to act as a dual channel (colori- and fluorimetric) sensor towards Al3+ and PPi emitting at 486 nm (blue region) and 534 nm (green region), respectively in MeOH–H2O (8[thin space (1/6-em)]:[thin space (1/6-em)]2, v/v) at pH 7.2 (10 mM HEPES buffer), μ = 0.05 M (LiCl), temperature 25 °C. The binding stoichiometries and formation constants of the sensor towards both Al3+ and PPi were determined by the combined UV-Vis and fluorescence titrations and Job's method, and confirmed by MS (m/z) studies. The corresponding detection limits as calculated by the 3σ method are: 7.55 μM and 3.34 μM. The most interesting part of this study is that on addition of 230 μM PPi to an ensemble of DFC-EN-p-Ph-NO2−Al3+ (20 μM Ligand and 380 μM Al3+) the fluorescence is totally quenched but on further addition of PPi a new emission peak appears at 534 nm. All biologically relevant metal ions and toxic heavy metals did not interfere with the detection of Al3+ ion. Its bio-compatibility with respect to its good solubility in mixed organo-aqueous media (MeOH–H2O) and cell permeability with no or negligible cytotoxicity provide good opportunities towards in vitro cell imaging studies of these ions. In particular, the fluorescent detection of PPi was not interfered by the presence of 400 μM of ATP or Pi although most reported PPi sensors that work in aqueous solution displayed cross-sensitivities toward ATP or Pi. The obvious excellent sensing capability of DFC-EN-p-Ph-NO2 towards PPi and Al3+ was further scrutinized in HCT116 cell lines without much cytotoxicity. The modes of 1[thin space (1/6-em)]:[thin space (1/6-em)]1 binding of DFC-EN-p-Ph-NO2 towards Al3+ and PPi were delineated by DFT calculations.

Introduction

Pyrophosphate (P2O74−, PPi), a hydrolysis product of ATP and other nucleotide triphosphates, is involved in various anabolic and bioenergetic processes.1–3 Several cell signalling processes utilize adenylatecyclase (guanylatecyclase) that catalyze the conversion of ATP (GTP) to cAMP (cGMP) and PPi.4,5 PPi is also used as an additive in food (E450), toothpaste, baking powder, and detergents.6 Thus, the selective detection of PPi is important for monitoring the biological processes mediated by hydrolysis of nucleotide triphosphate to release PPi.

Since the first report on PPi fluorescent sensor by Czarnik7 this becomes an interesting field of research by chemists and biochemists.8–11 Most often, these sensors contain metal complexes as the recognition units of phosphates. Zn(II) complexes are frequently used in this context,12 but other metal ions such as Cu(II),13 Cd(II),14 Mn(II),15 Eu(III),16 and Tb(III)17 have been employed as well, however Al3+ bound PPi sensor is rare.18 Even though various types of chemosensors that recognize PPi in water have been reported,11,19–23 only a few of them had sufficient selectivity for PPi over ATP or Pi in aqueous solutions.

In Scheme 1 we describe a turn-on Al3+ sensor which can also function as PPi sensor both in presence and absence of Al3+. The most important aspects of this sensor are that it senses Al3+ selectively by fluorescence emission in blue region while PPi sensing occurs in the green region.


image file: c5ra08024j-s1.tif
Scheme 1

Materials and methods

The starting materials such as p-chloro nitrobenzene (Sigma Aldrich), ethylenediamine, diformyl-p-cresol (prepared in this laboratory) were used for the preparation of ligands. Al(NO3)3·9H2O was used to prepare Al3+-complex. Solvents like ethanol, diethyl ether and methanol (Merck, India) were of reagent grade and dried before use.

Physical measurements

Elemental analyses were carried out using a Perkin-Elmer 240 elemental analyzer. Infrared spectra (400–4000 cm−1) were recorded in liquid state on a Nickolet Magna IR 750 series-II FTIR spectrometer. 1H-NMR spectra were recorded in DMSO-d6 on a Bruker 300 MHz NMR spectrometer using tetramethylsilane (δ = 0) as an internal standard. ESI-MS+ (m/z) of the ligand and Al3+-complex were recorded on a Waters' HRMS spectrometer (Model: XEVO G2QTof). UV-Vis spectra were recorded on an Agilent diode-array spectrophotometer (Model, Agilent 8453). Steady-state fluorescence measurements were performed with a PTI QM-40 spectrofluorometer.

Solution preparation for UV-Vis absorption and fluorescence studies

For both UV-Vis and fluorescence titrations, stock solution of 1.0 × 10⁻³ M of the probe DFC-EN-p-Ph-NO2 was prepared in MeOH. Similarly, another 1.0 × 10⁻³ M stock solution of Al(NO3)3·9H2O and other metal ions were prepared in MeOH–H2O (8[thin space (1/6-em)]:[thin space (1/6-em)]2, v/v). A solution of MeOH–H2O (8[thin space (1/6-em)]:[thin space (1/6-em)]2, v/v) containing 10.0 mM HEPES buffer was prepared and pH was adjusted to 7.20 by using HCl and NaOH. Ionic strength was maintained at 20 mM (NaCl) throughout the measurements. 2.5 ml of this buffered solution was pipetted out into a cuvette to which was added 20 μM of the probe and metal ions were added incrementally starting from 0 to 380 μM in a regular interval of volume and UV-Vis and fluorescence spectra were recorded for each solution.

Preparation of N-(2-aminoethyl)-4-nitrobenzenamine (1)

N-(2-aminoethyl)-4-nitrobenzenamine has been prepared using literature procedure.24

Preparation of DFC-EN-p-Ph-NO2 (2)

2,6-Diformyl-p-cresol (DFC) was prepared by following a literature procedure.25 2,6-Diformyl-p-cresol (DFC) (1.64 g, 10 mmol) was dissolved in 25 ml EtOH under nitrogen atmosphere. To this solution, N-(2-aminoethyl)-4-nitrobenzenamine (1) (1.81 g, 10 mmol) was added and stirred at room temperature for 2 h, whereupon solid precipitate formed was filtered and washed with diethyl ether and air dried (Scheme 2). It was recrystallized from ethanol to get pure product. Yield, 80%.CHN Analysis for C25H26N6O5: calculated (%): C, 61.22; H, 5.34; N, 17.13. Found (%): C, 61.21; H, 5.33; N, 17.14. 1H-NMR (in DMSO-d6) (δ, ppm): 7.36 (s, 2H (NH), 14.04 (s, 1H), 2.23 (s, 3-H), 7.48 (s, 2-H), 8.57 (s, 2-H), 7.98 (d, J = 9.2, 4-H), 6.70 (d, J = 9.2, 4H), 3.78 (d, J = 5.0, 4H), 3.50 (d, J = 5.6, 4-H) (please see Fig. S1 for 1H-NMR). 13C-NMR: (300 MHz, DMSO-d6) δppm: 20.27, 43.59, 58.68, 111.42, 121.30, 126.64, 127.02, 132.87, 136.21, 155.01, 159.70, 162.48 (Fig. S2). ESI-MS+ (m/z): 491.20(DFC-EN-p-Ph-NO2 + H+) [Fig. S3]. IR spectrum (in MeOH): –OH (3499 cm−1), –C[double bond, length as m-dash]N (1639 cm−1), –NH (3177 C m−1). (Fig. S4).
image file: c5ra08024j-s2.tif
Scheme 2

Synthesis of [Al(DFC-EN-p-Ph-NO2)(H2O)(OH)(NO3)] complex (3)

Al(NO3)2·9H2O (0.375 g, 1 mmol) was dissolved in 10 ml methanol. To this solution, DFC-EN-p-Ph-NO2 (0.350 g, 1.0 mmol) in 3 ml MeOH was added. The colour of the solution changed to faint yellow. The resulting mixture was stirred for 3 h at room temperature. The volume of the solution was reduced to 5 ml under reduced pressure and diethyl ether (10 ml) was added and kept at 0 °C for 12 h to afford complex 3 as microcrystals. Yield: 0.356 g (∼52%). CHN analyses for [Al(DFC-EN-p-Ph-NO2)(H2O)(OH)](NO3)] C25H28N7O10Al (M.W.613.51), calcd (%): C, 48.94; H, 4.60; N, 15.98. Found (%): C, 48.90; H 4.66; N, 15.97. UV-Vis. (MeOH): λmax 370 nm (Fig. 1).
image file: c5ra08024j-f1.tif
Fig. 1 (a) Absorption titration of with Al3+ in MeOH–H2O (8[thin space (1/6-em)]:[thin space (1/6-em)]2, v/v) in HEPES buffer (10 mM) at pH 7.2; (b) non-linear curve fitting.

Cell culture

Human colon cancer (HCT116) cell line, were grown in DMEM supplemented with 10% FBS and antibiotics (penicillin-100 μg ml−1; streptomycin-50 μg ml−1). Cells were cultured at 37 °C in 95% air, 5% CO2 incubator.

Cell cytotoxicity assay

To determine % cell viability of DFC-EN-p-Ph-NO2, MTT assay was performed.26 HCT116 cells (1 × 10⁵ cells per well) were cultured in a 96-well plate at 37 °C, and exposed to varying concentrations of 1, 10, 20, 40, 60, 80 and 100 μM of DFC-EN-p-Ph-NO2 for 12 h. 20 μl of MTT solution [5 mg ml−1 1× phosphate-buffered saline (PBS)] was added to each well of a 96-well culture plate and again incubated continuously at 37 °C for a period of 4 h. All media were removed from wells and 150 μl of DMSO was added to each well and absorbance was measured at 550 nm (EMax Precision MicroPlate Reader, Molecular Devices, USA). All experiments were performed in triplicate and the relative cell viability (%) was expressed as a percentage relative to the untreated control cells.

Cell imaging study

HCT116 Cells were cultured and incubated in 35 × 10 mm culture dish over coverslip and allowed to incubate with 10 μm DFC-EN-p-Ph-NO2 prepared by dissolving in a mixed solvent (DMSO[thin space (1/6-em)]:[thin space (1/6-em)]water = 1[thin space (1/6-em)]:[thin space (1/6-em)]9 (v/v) in the culture medium) for 30 min at 37 °C. After incubation, cells were washed thrice with 1× PBS; cover slip containing HCT116 cells were allowed to treated with 0 μM, 4 μM, 6 μM, 8 μM and 10 μM of Al3+ (Experimental Set-I), 0 μM, 4 μM, 6 μM, 8 μM and 10 μM of PPi (Experimental Set-II) and 0 μM, 4 μM, 6 μM, 8 μM and 10 μM of Al3+ + PPi (Experimental Set-III), incubated for 30 min at 37 °C, washed twice with1X PBS and coverslip were mounted over the slide. Bright field and fluorescence images of HCT116 cells were taken by a fluorescence microscope (Leica DM3000, Germany) with an objective lens of 40× magnification. HCT116 cells showed excellent green fluorescence when DFC-EN-p-Ph-NO2 formed intracellular complex with PPi and blue fluorescence with Al3+.

Results and discussion

Synthesis and characterization of DFC-EN-p-Ph-NO2

DFC-EN-p-Ph-NO2 was prepared according to the synthetic routes shown in Scheme 2 in 80% yields.

To an ethanolic solution of 2,6-diformyl-p-cresol (DFC) under nitrogen atmosphere was added N-(2-aminoethyl)-4-nitrobenzenamine (1) and stirred at room temperature for 2 h, whereupon solid precipitate formed was filtered, recrystallized from ethanol to get the pure product. The probe was characterized by various spectroscopic (IR, 1H and 13C NMR) and HRMS analyses. It was further reacted with Al(NO3)2·9H2O to afford complex 3 as microcrystals in 52% yield and characterized analogously. Several attempts to get single crystals for X-ray diffraction studies were failed.

UV-Vis absorption studies

The electronic absorption properties of DFC-EN-p-Ph-NO2 (2) were investigated in MeOH[thin space (1/6-em)]:[thin space (1/6-em)]H2O (8[thin space (1/6-em)]:[thin space (1/6-em)]2, v/v) at pH 7.2 in 10 mM HEPES buffer at μ = 0.05 M (LiCl). The absorption spectrum of the free ligand consists of three absorption bands at 455, 388 and 276 nm which are assigned as π–π*, n–π* and σ–π* transitions, respectively.27 On gradual addition of Al3+ the absorbance of compound 3 at 448 and 270 nm gradually decrease, while, the band at 388 nm gradually shifted to 370 nm producing three well defined isosbestic points at 375, 300 and 250 nm which clearly indicate the transformation of free ligand to its metal-bound state.
 
y = (a + b × c × xn)/(1 + c × xn) (1)

When we plot absorbance as a function of [Al3+] a non-linear curve of decreasing slope was obtained which can be easily solved by using eqn (1),28 where a and b are the absorbances in the absence and presence of excess metal ions, respectively, c (= K) is the formation constant and n is the stoichiometry of the reactions. The non-linear least-squares curve-fit of the absorption titration data (Fig. 1(b)) as a function of [Al3+] gives: c = K = (2.26 ± 1.00) × 104 M−1, n = 0.93 ± 0.04. The 1[thin space (1/6-em)]:[thin space (1/6-em)]1 mole ratio for L–M binding was further determined by JOB's method (Fig. S5) and ESI-MS+ (m/z) (Fig. S3a) studies.

As the reaction between the probe and Al3+ was found to be slow we tried to evaluate the rate constants for this reaction under pseudo-first order conditions taking the probe as a minor component [DFC-EN-p-Ph-NO2] = 20 μM and [Al3+] in large excess (20–200 μM). In each concentration of Al3+ the pseudo-first-order rate constants were evaluated by fitting the kinetic traces to a first-order computer-fit program associated with the spectrophotometer. A plot of kobs vs. [Al3+] yields a non-linear curve of decreasing slope. Such dependence could be best described by the following reaction sequence (eqn (2)) (Fig. 2).

 
image file: c5ra08024j-t1.tif(2)


image file: c5ra08024j-f2.tif
Fig. 2 Non-linear curve-fitting of a plot of kobs vs. [Al3+] for the complexation of Al3+ with DFC-EN-p-Ph-NO2 in MeOH–H2O (8[thin space (1/6-em)]:[thin space (1/6-em)]2, v/v) at pH 7.2 (10 mM HEPES buffer), μ = 0.05 M (LiCl), temperature 25 °C.

The corresponding rate law could be derived as eqn (3).

 
image file: c5ra08024j-t2.tif(3)

Non-linear least-squares fitting of kobs as a function of [Al3+] gives k = (2.6 ± 0.30) × 10−3 M−1 s−1 and Q = (1.10 ± 0.23) × 104 M−1. Here Q signifies the initial inner-sphere association between the probe and the metal ion. Fig. 3 displays a time resolved spectra for the reaction between DFC-EN-p-Ph-NO2 and Al3+. Each spectrum was taken at an interval of 50 seconds for initial 10 spectra and then it was recorded at an interval of 100 seconds. As the reaction between probe and Al3+ is relatively slow each spectrum for absorption titration was recorded after 2 hour of mixing.


image file: c5ra08024j-f3.tif
Fig. 3 Time resolved spectra for the reaction between the probe DFC-EN-p-Ph-NO2 and Al3+ in MeOH–H2O (8[thin space (1/6-em)]:[thin space (1/6-em)]2, v/v) at pH 7.2 (10 mM HEPES buffer), μ = 0.05 M (LiCl), temperature 25 °C. First spectrum was taken immediately after mixing and subsequent spectra were taken at a time interval of 60 seconds.

Fluorescence studies

Due to excited state intramolecular proton transfer (ESIPT) from the phenolic –OH to azomethyn-N atom along with the C[double bond, length as m-dash]N isomerization, the free ligand shows very weak fluorescence behaviour at 520 nm. But on complexation with Al3+ both these processes are effectively blocked and the probe becomes highly fluorescencent through chelation enhanced fluorescence (CHEF) effect resulting a large enhancement in the fluorescence intensity at 486 nm accompanied with 34 nm blue shift (Fig. 4). The mechanism is shown in Scheme 1. A proton transfer and C[double bond, length as m-dash]N isomerization might also affect the “second” azomethin group in the molecule, even after chelation of one Al3+ ion.
image file: c5ra08024j-f4.tif
Fig. 4 (a) Fluorescence titration of 20 μM DFC-EN-p-Ph-NO2 in MeOH–H2O (8[thin space (1/6-em)]:[thin space (1/6-em)]2, v/v) in HEPES buffer at pH 7.2 by the gradual addition Al3+ with λex = 370 nm, λem = 486 nm inset (b) non-linear curve-fit of F.I vs. [Al3+].

The fluorescence titrations were carried out in three ways. (a) In the first step we kept ligand concentration fixed at 20 μM and [Al3+] was varied between 0 and 380 μM and fluorescence intensity (FI) at 486 nm were recorded (λex = 370 nm) at a fixed time interval of 30 min to allow the reaction to complete, as the reaction between the probe and Al3+ was found to be slower. When we plot FI as a function of [Al3+] we get a non-linear curve of decreasing slope which was solved by fitting the titration data to eqn (1) and the corresponding evaluated parameters are: Kf = (5.29 ± 1.11) × 104 M−1 and n = 1.30 ± 0.02 which clearly signifies a 1[thin space (1/6-em)]:[thin space (1/6-em)]1 complexation between DFC-EN-p-Ph-NO2 and Al3+.The detection limit as determined by 3σ method was found to be 7.55 μM (Fig. S6).

In a second attempt (b) we have treated 20 μM probe with 380 μM [Al3+] and then added PPi gradually upto 230 μM which showed a gradual decay of FI with added PPi. First spectrum was taken within 10 s of mixing and subsequently each spectrum was recorded at a time interval of 30 s. This decrease in FI may be attributed to the displacement of Al3+ from Al3+–PPi complex and this arises due to a stronger affinity of Al3+ towards PPi over the probe. On further addition of PPi to this mixture there was a gradual increase in FI at 534 nm which may be due to H-bonding interaction between the probe and PPi (Fig. S7) giving a rigid structure to the probe and blocking both the ESIPT and isomerization across the C[double bond, length as m-dash]N (azomethyne) bond. Finally, (c) to confirm the proposition in (b) we have carried out this titration in the absence of Al3+ and indeed there is a gradual increase in FI at 534 nm on increasing the concentration of PPi. A plot of FI vs. PPi gives non-linear curve and solved by fitting the titration data to eqn (1) and the evaluated parameters are: Kf = (1.34 ± 0.81) × 103 M−1 and n = 0.94 ± 0.07 (Fig. 5). In order to check the applicability of the probe at lower concentration we have carried out experiments keeping probe concentration at 2 μM and then treated with increasing concentration of Al3+ and PPi separately and we observed significant enhancement of FI at 484 and 534 nm respectively, suggesting its applicability at lower concentration (at least at 2 μM).


image file: c5ra08024j-f5.tif
Fig. 5 (a) Fluorescence titration of 20 μM DFC-EN-p-Ph-NO2 in MeOH–H2O (8[thin space (1/6-em)]:[thin space (1/6-em)]2, v/v) in HEPES buffer at pH 7.2 by the gradual addition PPi with λex = 370 nm, λem = 534 nm inset (b) non-linear curve-fit of F.I vs. [PPi] and the evaluated parameters are: Kf = (1.34 ± 0.81) × 103 M−1 and n = 0.94 ± 0.07.

The selective sensing of analyte is an important criterion of a successful sensor. In order to check the selectivity of DFC-EN-p-Ph-NO2 towards Al3+ we have carried out steady state fluorescence experiments with 20 μM DFC-EN-p-Ph-NO2 and 5 equivalents of different metal ions both in absence and presence of Al3+. It was interesting to note that the detection of Al3+ was not perturbed by biologically abundant metal ions like Na+, K+, Ca2+ etc. and transition metal ions, namely Cr3+, Mn2+, Fe2+, Fe3+, Co2+, Ni2+, Cu2+, as well as heavy metal ions like Cd2+, Pb2+, and Hg2+ (Fig. 6).


image file: c5ra08024j-f6.tif
Fig. 6 (a) Fluorescence response of different metal ions towards DFC-EN-p-Ph-NO2 (20 μM); (b) interference from other metal cations in a binary mixture: L(DFC-EN-p-Ph-NO2 (20 μM) + Al3+ (380 μM) + Mn+ (5 equivalent of Al3+), where Mn+ = Ni2+, Fe3+, Cd2+, Mg2+, Zn2+, Cr3+, Co2+, Na+, Cu2+, Mn2+, Hg2+, Pb2+ and Mn2+. Mix = (Ni2+, Fe3+, Cd2+, Mg2+, Zn2+, Cr3+, Co2+, Na+, Cu2+, Mn2+, Hg2+, Pb2+, Mn2+) were present together with L and Al3+ (in MeOH–H2O (8[thin space (1/6-em)]:[thin space (1/6-em)]2, v/v) in HEPES buffer at pH 7.2, λex = 370 nm, λem = 486 nm). Each spectrum was drawn after 15 min.

With the addition of PPi, there is an enhancement in fluorescence intensity (∼5 fold) at 534 nm which is red shifted from 520 nm on excitation at 370 nm. The detection limit is found to be 3.34 μM (Fig. S6a) indicating a high sensitivity of the ligand towards PPi. No significant changes were observed in the emission spectra by the addition of the other anions such as HPO42−, PO43−, ATP, AcO, Cl, Br, F, SO42−, SCN and N3, AsO4, S2O4, NO2 under similar experimental conditions. The selectivity for PPi with 20 μM of DFC-EN-p-Ph-NO2 was plotted as a bar diagram in Fig. 7. Interestingly, anions other than PPi that contain the phosphate moiety do not interfere in the sensing of PPi, except ATP where a slight FI enhancement was noted.


image file: c5ra08024j-f7.tif
Fig. 7 (a) Fluorescence response of different anions towards DFC-EN-p-Ph-NO2 (20 μM); (b) interference from other anions in a binary mixture: L(DFC-EN-p-Ph-NO2) (10 μM) + PPi (350 μM) + Xn (5 equivalent than PPi), where Xn = Br, F, Cl, SCN, N3, ATP, HPO42−, NO2, OAc, SO42−, S2O4, AsO4 and PPi. Mix = (Br, F, Cl, SCN, N3, ATP, HPO42−, NO2, OAc, SO42−, S2O4, AsO4) were present together with L and PPi (in MeOH–H2O (8[thin space (1/6-em)]:[thin space (1/6-em)]2, v/v) in HEPES buffer at pH 7.2, λex = 370 nm, λem = 534 nm).

The described sensor shows turn on fluorescent response to Al3+ and PPi so the two analytes may interfere with each other during the detection. To short out how to avoid the possible interference from each other we have carried out two experiments. In one case, to 20 μM probe, ∼17 equivalents of Al3+ was added and then PPi was added incrementally. The emission band at 486 nm is abruptly quenched on addition of ∼12 equivalents of PPi (Fig. S7) and a new peak at 534 nm is started to grow on further addition of PPi to the solution mixture and becomes constant at [PPi] = 700 μM (Fig. S7).

In another experiment, to a 20 μM probe, 700 μM (35 equivalents) PPi was added and then Al3+ was added incrementally. It was observed that emission peak at 534 for DFC-en-p-Ph-NO2−PPi complex starts to diminish with the increase in concentration of Al3+, becomes almost the same as that of in pure probe at 950 μM of Al3+ and then a peak at 484 nm for DFC-en-p-Ph-NO2−Al3+ complex stars to grow on further increasing the concentration of PPi and becomes constant at [Al3+] = 1225 μM. These two experiments clearly demonstrate the reversibility and selectivity of the probe towards Al3+ and PPi; one being higher in concentration over the other (Fig. S8). The quantum yield value for free DFC-EN-p-Ph-NO2 and DFC-EN-p-Ph-NO2−Al3+, DFC-EN-p-Ph-NO2−PPi ensembles are 0.002, 0.011, 0.003 respectively.

The strong solvatochromic behavior was observed for the free ligand (DFC-EN-p-Ph-NO2), as well as its complexes with Al3+ (DFC-EN-p-Ph-NO2−Al) and PPi (DFC-EN-p-Ph-NO2−PPi). In all cases there are red shifts of absorption maximum on increasing the solvent polarity which clearly indicates that there is charge separation in the excited state and interact strongly with more polar solvents (Fig. S9). In case of fluorescence emission spectra we observed solvent polarity dependent blue shift for DFC-EN-p-Ph-NO2 and red shift for DFC-EN-p-Ph-NO2−Al and DFC-EN-p-Ph-NO2−PPi. The blue shift in λem of the free probe may be rationalized by considering low charge separation in the excited state compared to the ground state, possibly due to attainment of planar structure in the excited state. In other cases normal behaviour (red shift) is apparent (Fig. 8 and Fig. S9). This is confirmed by a plot of Stoke shifts (Δ[small nu, Greek, macron]) vs. solvent polarity parameter ET(30) in different solvents (Fig. S15–S17).29


image file: c5ra08024j-f8.tif
Fig. 8 Polarity dependent blue shift of λem of the ligand (non-polar to polar) and red shift of λem of the Al-complex (non-polar to polar).

The coordination mode of DFC-EN-p-Ph-NO2 towards Al3+ was supported by 1H-NMR studies (Fig. 9) which clearly showed a down field shift of azomethine protons (c) in DFC-EN-p-Ph-NO2−Al3+ complex from 8.57 of the free ligand to 9.42, 10.17 in the complex [Fig. 9(a)]. The larger shift and splitting into two peaks are due to strong binding of one azomethine N to Al3+ while other decoupled from H-bonding with phenolic –OH proton (Table S1). In the free ligand there is intramolecular H-bonding between azomethyne-N and –OH proton (i) resulting a downfield shift of –OH proton signal to 14.04 ppm and appears as a broad signal, which vanishes completely on complexation with Al3+. The up-field shift of imine–NH proton (f) signal from 7.36 to 7.17 in complex [Fig. 9(a)] is due to electronic environment. In case of DFC-EN-p-Ph-NO2−PPi complex this OH proton signal is broadened and almost vanishes. The azomethine proton (c) remains almost unchanged (7.36 to 7.25) or slightly up-field shifted due to non-participation in H-bonding to PPi and shift of imine–NH proton (f) towards up-field occurs due to H-bonding [Fig. 9(b)].


image file: c5ra08024j-f9.tif
Fig. 9 (a) 1H-NMR shifts of free ligand and with addition of 1.5 equivalents of and Al3+ (b) PPi in DMSO-d6 recorded on a 300 MHz Bruker NMR spectrometer.

We have also carried out DFT calculations on DFC-EN-p-Ph-NO2, DFC-EN-p-Ph-NO2−Al3+ and DFC-EN-p-Ph-NO2−PPi to strengthen the coordination modes of the ligand towards Al3+ and PPi and their optimized geometries are shown in Fig. S10. The TDDFT calculations on free ligand and its Al3+ complex were used to generate their UV-Vis spectra which showed excellent match in λmax with experimental findings (Table S4). A blue shift in the absorption spectrum of DFC-EN-p-Ph-NO2−Al3+ complex compared to free ligand is also rationalized by comparing the HOMO–LUMO+1 gap for these species which is slightly higher for the former (ΔE = 3.46 eV, λtheo = 370) than the later (ΔE = 3.27 eV, λtheo = 388) (Fig. 10–12).


image file: c5ra08024j-f10.tif
Fig. 10 Comparable pictogram of blue shift transition in electronic spectra in form of energy difference.

image file: c5ra08024j-f11.tif
Fig. 11 Frontier molecular orbitals involved in the UV-Vis absorption of DFC-EN-p-Ph-NO2.

image file: c5ra08024j-f12.tif
Fig. 12 Frontier molecular orbitals involved in the UV-Vis absorption of DFC-EN-p-Ph-NO2+Al3+.

Cell imaging experiments

The obvious excellent sensing capability of DFC-EN-p-Ph-NO2 towards PPi and Al3+ were further scrutinized in HCT116 cell lines. The cytotoxic effect of DFC-EN-p-Ph-NO2 towards HCT116 cells was determined by MTT assay which showed no severe cytotoxicity till 60 μM (<30% cytotoxicity) of DFC-EN-p-Ph-NO2 and more than 89.11% cell viability was observed at 10 μM (Viability curve (Fig. S12)). Hence further experiments were carried out with safer 10 μM of DFC-EN-p-Ph-NO2. When DFC-EN-p-Ph-NO2 (10 μM) was treated with HCT116 cells for 30 min at 37 °C, it did not show intracellular fluorescence (Fig. 13). The gradual increase in the blue (for Al3+) and green (for PPi) fluorescence was observed with increase in concentration of Al3+ and PPi, respectively. When DFC-EN-p-Ph-NO2 (10 μM) form 1[thin space (1/6-em)]:[thin space (1/6-em)]1 intracellular complex with Al3+ (10 μM, 30 min at 37 °C) it gives intense blue fluorescence. However, when DFC-EN-p-Ph-NO2 (10 μM) was treated with PPi (10 μM, 30 min at 37 °C) green fluorescence was observed intracellularly, but no blue fluorescence suggesting that DFC-EN-p-Ph-NO2+PPi complex shifts emission wavelengths to green region (red shift). In another experiment DFC-EN-p-Ph-NO2−Al3+ ensemble (10 μM each) when treated with 10 μM PPi the blue fluorescence of DFC-EN-p-Ph-NO2−Al3+ complex is almost vanishes, but in presence of large excess of PPi green fluorescence corresponding to DFC-EN-p-Ph-NO2−PPi ensemble becomes visible. This suggests that DFC-EN-p-Ph-NO2 could form optimum stable fluorescence complex when incubated with either PPi or Al3+ ions separately. The fluorescence sensory behaviour of DFC-EN-p-Ph-NO2 towards Al3+ and PPi was dependent on the ion to which it binds thereby opening up its vast application towards biological sensing of these ions with good photo stability and very low cytotoxicity at low concentration region (10 μM). Thus DFC-EN-p-Ph-NO2 facilitates the selective sensing of either PPi or Al3+ and serves as the biomonitoring and cell imaging tool for PPi and Al3+.
image file: c5ra08024j-f13.tif
Fig. 13 The phase contrast and fluorescence images of HCT116 cells captured (40×) after cells were preincubated with DFC-EN-p-Ph-NO2 for 30 min at 37 °C in the incubator followed by washing with 1XPBS for 3 time and allowed to treated with 0 μM, 4 μM, 6 μM, 8 μM and 10 μM Al3+ (ES-I), PPi (ES-II) and Al3+ + PPi (ES-III) for 30 min at 37 °C. The image shows the strong blue flourescence when DFC-EN-p-Ph-NO2 complexes with Al3+ and green fluorescence with PPi in blue and green filter respectively. The gradual increase in the blue (for Al3+) and green (for PPi) fluorescence was observed with increase in concentration of Al3+ and PPi. ES; Experimental Set, PC; Phase Contrast, BF; blue filter, GF; green filter. Cell imaging studies were carried out three times.

Finally, to understand the selective interaction of DFC-EN-p-Ph-NO2 with PPi over ATP and Pi DFT calculations were performed to attain the optimized geometry of DFC-EN-p-Ph-NO2 and its complexes with PPi, ATP and Pi (2) (Fig. S11). From this study, it is clear that the energy gap between the highest occupied molecular orbital (HOMO) and the lowest unoccupied molecular orbital (LUMO) are 3.08, 3.48, 2.84 and 1.66 eV for free ligand and its complexes with Pi, ATP, and PPi, respectively. It is to be noted that DFC-EN-p-Ph-NO2−PPi has the lowest energy gap giving rise to a more stable species,30 while DFC-EN-p-Ph-NO2–ATP has next lower energy gap and this is reflected by substantial change in FI in case of former and very low FI change in case of later. In case of DFC-EN-p-Ph-NO2−Pi no observable change in FI was observed.

Conclusion

In summary, we have successfully developed a new dual channel chemical sensor for the detection of Al3+ and pyrophosphate ions (PPi) together or separately. The probe DFC-EN-p-Ph-NO2 or DFC-EN-p-Ph-NO2−Al3+ ensemble showed a highly sensitive and selective response to PPi in presence of other anions like HPO42−, PO43−, ATP, AcO, Cl, Br, F, SO42−, SCN and N3, AsO4, S2O4 and NO2 at pH 7.4 by fluorescent change in organo-aqueous solutions. In particular, the fluorescent detection of PPi was not interfered by the presence of 400 μM of ATP or Pi. Overall results indicate that the dual signal chemosensing of PPi by DFC-EN-p-Ph-NO2 or DFC-EN-p-Ph-NO2−Al3+ ensemble may contribute to the development of more efficient and useful methods for detecting PPi in biological systems. Its solubility in bio-compatible solvent (DMSO/H2O 1[thin space (1/6-em)]:[thin space (1/6-em)]99 v/v) and cell permeability with no or negligible cytotoxicity provide good opportunity towards in vitro/in vivo cell imaging studies of these ions. The obvious excellent sensing capability of DFC-EN-p-Ph-NO2 towards PPi and Al3+ were further scrutinized in HCT116 cell lines. The modes of binding between DFC-EN-p-Ph-NO2 with Al3+ and PPi were established by DFT calculations.

Acknowledgements

Financial supports from CSIR (Ref. 02(2490)/11/EMR-II) and DST (Ref. SR/S1/IC-20/2012) New Delhi are gratefully acknowledged.

References

  1. C. P. Mathews and K. E. van Hold, Biochemistry, The Benjamin/Cummings Publishing Co., Inc., Redwood City, CA, 1990 Search PubMed.
  2. M. Ronaghi, S. Karamohamed, B. Pettersson, M. Uhlen and P. Nyren, Anal. Biochem., 1996, 242, 84 CrossRef CAS PubMed.
  3. S. Xu, M. He, H. Yu, X. Cai, X. Tan, B. Lu and B. Shu, Anal. Biochem., 2001, 299, 188 CrossRef CAS PubMed.
  4. K. D. Lopacinska and J. B. Strosznajder, J. Physiol. Pharmacol., 2005, 56, 15 Search PubMed.
  5. M. Kamenetsky, S. Middelhaufe, E. M. Bank, L. R. Levin, J. Buck and C. Steegborn, J. Mol. Biol., 2006, 362, 623 CrossRef CAS PubMed.
  6. (a) M. T. Averbuch-Pouchot and A. Durif, Topics in Phosphate Chemistry, World Scientific Publishing Co. Ptv. Ltd., Singapore, 1996 Search PubMed; (b) R. A. Molins, Phosphates in Foods, CRC Press. Inc., Boca Raton, 1991 Search PubMed.
  7. D. H. Vance and A. W. Czarnik, J. Am. Chem. Soc., 1994, 116, 9397 CrossRef CAS.
  8. X. Zhao, Y. Liu and K. S. Schanze, Chem. Commun., 2007, 2914 RSC.
  9. D. Aldakov and P. Anzenbacher Jr, J. Am. Chem. Soc., 2004, 126, 4752 CrossRef CAS PubMed.
  10. S. K. Kim, D. H. Lee, J. I. Hong and J. Yoon, Acc. Chem. Res., 2009, 42, 23 CrossRef CAS PubMed.
  11. D. H. Lee, J. H. Im, S. U. Son, Y. K. Chung and J. I. Hong, J. Am. Chem. Soc., 2003, 125, 7752 CrossRef CAS PubMed.
  12. C. Park and J.-I. Hong, Tetrahedron Lett., 2010, 51, 1960 CrossRef CAS PubMed.
  13. S. Watchasit, A. Kaowliew, C. Suksai, T. Tuntulani, W. Ngeontae and C. Pakawatchai, Tetrahedron Lett., 2010, 51, 3398 CrossRef CAS PubMed.
  14. S. Mizukami, T. Nagano, Y. Urano, A. Odani and K. Kikuchi, J. Am. Chem. Soc., 2002, 124, 3920 CrossRef CAS PubMed.
  15. K. M. K. Swamy, S. K. Kwon, H. N. Lee, S. M. S. Kumar, J. S. Kim and J. Yoon, Tetrahedron Lett., 2007, 48, 8683 CrossRef CAS PubMed.
  16. N. Shao, J. Jin, G. Wang, Y. Zhang, R. Yang and J. Yuan, Chem. Commun., 2008, 1127 RSC.
  17. C. M. G. dos Santos and T. Gunnlaugsson, Dalton Trans., 2009, 4712 RSC.
  18. C. R. Loran, J.-M. Kim, S.-Y. Chung, J. Yoon and K.-H. Lee, Analyst, 2010, 135, 2079 RSC.
  19. S. K. Kim, D. H. Lee, J.-I. Hong and J. Yoon, Acc. Chem. Res., 2009, 42, 23 CrossRef CAS PubMed.
  20. S. Mizukami, T. Nagano, Y. Urano, A. Odani and K. Kikuchi, J. Am. Chem. Soc., 2002, 124, 3920 CrossRef CAS PubMed.
  21. H. N. Lee, K. M. K. Swamy, S. K. Kim, J. Y. Kwon, Y. Kim, S. J. Kim, Y. J. Yoon and J. Yoon, Org. Lett., 2007, 9, 243 CrossRef CAS PubMed.
  22. H. N. Lee, Z. Xu, S. K. Kim, K. M. K. Swamy, Y. Kim, S. J. Kim and J. Yoon, J. Am. Chem. Soc., 2007, 129, 3828 CrossRef CAS PubMed.
  23. H. K. Cho, D. H. Lee and J. I. Hong, Chem. Commun., 2005, 1690 RSC.
  24. J. Wang, Y. Xiao, Z. Zhang, X. Qian, Y. Yang and Q. Xu, J. Mater. Chem., 2005, 15, 2836 RSC.
  25. R. Alam, T. Mistri, A. Katarkar, K. Chaudhuri, S. K. Mandal, A. R. Khuda-Bukhsh, K. K. Das and M. Ali, Analyst, 2014, 139, 4022 RSC.
  26. J. Ratha, K. A. Majumdar, S. K. Mandal, R. Bera, C. Sarkar, B. Saha, C. Mandal, K. D. Saha and R. Bhadra, Mol. Cell. Biochem., 2006, 290, 113 CrossRef CAS PubMed.
  27. S. Chall, S. S. Mati, S. Konar, D. Singharoy and S. C. Bhattacharya, Org. Biomol. Chem., 2014, 12, 6447 CAS.
  28. R. Alam, T. Mistri, P. Mondal, D. Das, S. K. Mandal, A. R. Khuda-Bukhsh and M. Ali, Dalton Trans., 2014, 2566 RSC.
  29. S. S. Mati, S. Sarkar, S. Rakshit, A. Sarkar and S. C. Bhattacharya, RSC Adv., 2013, 3, 8071 RSC.
  30. S. Lohar, S. Pal, B. Sen, M. Mukherjee, S. Banerjee and P. Chattopadhyay, Anal. Chem., 2014, 86, 11357 CrossRef CAS PubMed.

Footnote

Electronic supplementary information (ESI) available: Experimental details regarding the synthesis and characterization of the ligand including spectroscopic details. See DOI: 10.1039/c5ra08024j

This journal is © The Royal Society of Chemistry 2015
Click here to see how this site uses Cookies. View our privacy policy here.