Lightweight and solution processible thin sheets of poly(o-toluidine)-carbon fiber-novolac composite for EMI shielding

Seema Joonabc, Rakesh Kumarac, Avanish Pratap Singha, Rajni Shuklab and S. K. Dhawan*a
aPolymeric & Soft Material Section, CSIR-National Physical Laboratory, New Delhi 110012, India. E-mail: skdhawan@mail.nplindia.ernet.in; Fax: +91-11-25726938; Tel: +91-11-45609401
bDepartment of Physics, DCRUST Murthal, Sonepat, Haryana 130001, India
cPDM College of Engineering, Bahadurgarh, Haryana 124507, India

Received 29th April 2015 , Accepted 4th June 2015

First published on 5th June 2015


Abstract

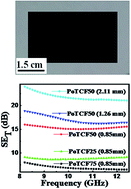
An attempt has been made to generate lightweight and processible thin sheets of poly (o-toluidine)-carbon fiber (PoTCF) composite for electromagnetic interference shielding. PoTCF composite synthesized by oxidative emulsion polymerization was physically blended with different weight ratios of novolac resin to prepare a new class of composite material, which was further processed to form thin sheets (thickness of ∼0.85 mm) by a compression moulding technique. In situ incorporation of carbon fiber into the polymer matrix leads to the formation of composites with improved mechanical, thermal, electrical and shielding properties, which were further optimized by varying the amount of novolac resin in the sheets. Structural and morphological studies were carried out by UV-vis, FTIR, XRD and SEM. PoTCF composite sheets with 50 wt% loading of novolac resin have flexural strength of 36.0 MPa and exhibit a shielding effectiveness of 24 dB in the X-band (8.2–12.4 GHz) at a critical thickness of ∼2.11 mm, which is more than the limit required for techno-commercial applications. Therefore, indigenously fabricated polymer-based sheets would be potentially useful for making durable enclosures for electronic equipment.


1. Introduction

In recent years, conducting polymers have occupied a major place and pivotal position in the field of material science.1,2 Intrinsically conducting polymers that represent an attractive class of materials for electromagnetic interference (EMI) shielding applications offer many advantages over other conventional materials. Although a number of conducting polymers and their composites are known, the search for new shielding materials continues to be the subject of continuing research. Among all conducting polymers, polyaniline (PANi) is perhaps the most promising polymer used for EMI shielding because of its desirable properties such as chemical stability, environmental stability and high conductivity at microwave frequencies.3,4 However, the limited solubility and processibility of PANi, due to the rigid and stiff backbone of its main chain, restricts its fabrication in pure form and puts a limit on large scale applications. To overcome this problem, various routes have been adopted. Two main routes that have been worked out are derivatization of the polymer backbone5,6 and incorporation of a specific dopant in the polymer network.7–9 The first route is a simple one and advantageous as the polymers of aniline derivatives exhibit greater solubility and hence good processibility. However, the lower conductivity of the PANi derivatives as compared to PANi6 does not allow their use for shielding application, but have been used for antistatic coatings,10 sensors,11 solar cells,12 and corrosion inhibitors.13 To take the advantage of their processibility and to exploit them for shielding applications their conductivity has to be improved. The conductivity of these polymers can be tailored either by doping with different protonic acids14,15 or by incorporation of conducting fillers to make composites. Use of conducting fillers to make electrically conductive polymer composites has attracted the attention of researchers for the development of new functional materials. These electrically conductive composites manifest the properties that cannot be achieved by the individual components. These materials have immense potential for use in EMI shielding applications. When the conducting polymers are taken in the form of composites with conductive fillers, their electrical, as well as their mechanical properties, are enhanced.16,17 A number of articles have reported the EMI shielding properties of conducting polymer composites.18,19 The conductivity of these heterogeneous systems depends on many factors such as the concentration of conducting fillers, their shape, size, orientation and interfacial interaction between fillers and the host matrix. Previous reports have already demonstrated that polymer/conducting polymer composites filled with conductive and magnetic fillers, such as carbon fiber, CNT, graphene, magnetic nanoparticles, and fly ash, have improved shielding characteristics and outperform conventional metal shielding due to their light weight, resistance to corrosion, flexibility and processing advantages.20–24 Among these, the composites based on low cost carbon fiber have demonstrated the formation of a novel composite with superior microstructure and improved mechanical as well as shielding properties.16,17,25,26 These composites are very promising for use as an effective and practical EMI shielding material owing to their light weight, low cost, and easy processiblity with good thermal, mechanical and shielding properties. Therefore, these lightweight shielding materials have gained considerable popularity and are preferred in most of the techno-commercial, aeronautical and military applications, where light weight is desirable for the material and for energy savings. These materials have been used in various forms, such as coatings, mesh wires, foils, conductive tapes, foams, films, and sheets, for the enclosures of electronic equipment to optimize EMI shielding. The aim of our work is to fabricate durable poly(o-toluidine)-carbon fiber (PoTCF) composite sheets using novolac resin as the binder and explore their use in EMI shielding applications. Among carbon materials as conductive fillers, carbon fiber is of great importance because of its proven use as shielding material.26,27 In the present work incorporation of carbon fiber into the polymer matrix fulfilled the desired value of conductivity for shielding. The mechanical and thermal stabilities of sheets are improved by both CF and novolac resin. To the best of our knowledge, the use of poly(o-toluidine) composites have not been thoroughly explored for EMI shielding applications to date.

2. Experimental

2.1 Materials

Ortho-toluidine (o-methyl aniline) (Merck, India), β-naphthalene-2-sulphonic acid (β-NSA, Himedia, India) and ammonium peroxydisulfate (APS, Merck, India) were used in the present study. Ortho-toluidine was freshly distilled before use; other chemicals were used as received. The novolac resin (Pheno-Organic, India) was used as a binder and PAN based carbon fiber (CF, Toray-T-300-Japan) was used as reinforcement material to improve mechanical strength. Aqueous solutions were prepared using double distilled water having specific resistivity of 106 Ω cm.

2.2 Synthesis of PoTCF composite & fabrication of thin sheets

PoTCF composite was prepared by chemical oxidative emulsion polymerization of o-toluidine in the presence of CF as filler and NSA as a surfactant as well as dopant. The detailed synthesis process is same as that of our previous report given for the synthesis of polyaniline-carbon fiber composites.17 In addition, poly(o-toluidine) (PoT) without CF was also synthesized by the same route for comparative study.

Furthermore, thin sheets of PoTCF were fabricated using a solution-based processing method. Novolac resin was used as a binder and the concentration of resin was varied (25, 50 and 75 wt% of PoTCF composite) to optimize the thermal, mechanical and electrical properties of the sheets. The fabrication procedure for PoTCF sheets is as follows: first, a measured amount of PoTCF was dispersed in ethanol by means of ultrasonication for two hours, and thereafter the required amount of novolac resin (25, 50 and 75 wt%) was added keeping the PoTCF plus phenolic resin wt% as 100. The solution was then sonicated for two hours, homogenized for 30 min and then poured into a specially designed vessel attached with vacuum filtration (see ESI, Fig. S1). The sheets obtained were then pressed in a compression mould at 100 °C with contact pressure. Furthermore, curing of sheets was carried out at 150 °C for 2 hours. The compression moulded sheets were ejected from the mould after cooling down to room temperature. PoTCF thin sheets with 25, 50 and 75 wt% loading of novolac resin thus prepared were abbreviated as PoTCF25, PoTCF50 and PoTCF75, respectively.

2.3 Characterization

SEM (Zeiss EVO MA-10) is used to study the morphology of PoTCF composites and sheets. Structural analysis was done by X-ray diffraction (XRD) studies carried out using a D8 advance X-ray diffractometer (Bruker) using Cu-Kα radiation (λ = 1.540598 Å) in scattering range (2θ) of 3°–60° with a scan rate of 0.02° sec−1 and slit width of 1 mm. Thermogravimetric analysis (TGA) of the samples was carried out using a Mettler Toledo TGA 851e. Fourier transform infrared (FTIR) analysis was carried out using Nicolet 5700 in the wavenumber range of 3500–500 cm−1. UV-vis absorption spectra were recorded using Shimadzu 1601 spectrophotometer in the wavelength range of 200–1100 nm (see ESI, Fig. S2). Flexural strength of PoTCF sheets was measured by three point bending test based with ASTM D790 (ref. 28) using an INSTRON Universal Testing Machine (model 4411) at a crosshead speed of 0.5 mm min−1. Room temperature conductivity was measured by the four-probe technique using a Keithley programmable current source (model 6221) and nanovoltmeter (model 2182 A). PoTCF sheets with dimension 13 × 7 mm were cut and four ohmic contacts were made on each end using silver paste. Shielding measurement was performed using an Agilent E8362B Vector network analyzer in the microwave range of 8.2–12.4 GHz (X-band). Measurements were carried out using a 15.8 × 7.9 × 6 mm3 copper sample holder connected between the waveguide flanges of a network analyzer.

3. Result and discussion

3.1 Scanning electron microscopy

Fig. 1a shows a SEM image of PoT, Fig. 1b displays the low resolution optical image of the PoTCF50 sheet and Fig. 1c shows the high resolution optical micrograph of the PoTCF50 sheet.
image file: c5ra07865b-f1.tif
Fig. 1 (a) SEM image of PoT, (b) low resolution optical image of PoTCF50 sheet and (c) high resolution optical micrograph of PoTCF50 sheet.

The SEM image of the NSA-doped PoT was found to have tubular morphology, which is similar to the previous reports.29 Morphology of the polymers is affected by the nature and concentration of dopant as well as the polymerization method. Wan et al. have shown that a lower concentration of NSA favoured the formation of complete tubules of PoT NSA, whereas a high concentration of NSA was required to form the complete PANi NSA tubules; moreover, the size of tubules could be controlled by changing the concentration of NSA.29 Fig. 1a displays the formation of the PoT tubes, which confirms that the tubes of PoT prepared in NSA medium are hollow and porous in nature. Fig. 1b and c show the low and high resolution optical micrographs of the PoTCF sheet. The PoTCF composite prepared by in situ polymerization leads to uniform coating of PoT particles on the surface of CF.17 The interaction between PoT particles and CF facilitates the charge transfer between the two components, thereby increasing the conductivity of PoTCF composite. The homogenous coating of PoT on CF does not cause any deformation in the longitudinal appearance of CF, as shown in Fig. 1c. Therefore, PoT is physically attached to CF surface thereby improving the mechanical strength of the polymer.

3.2 X-ray diffraction

Crystallinity and orientation of conducting polymers have been of considerable interest, because more highly ordered systems can display a metallic-like conductive state. The XRD patterns provide significant information in relation to the nature and structure of the sample. The X-ray diffraction patterns for PoT, PoTCF, PoTCF25, PoTCF50 and PoTCF75 are shown in Fig. 2a, which shows the semi-crystalline nature of PoT and PoTCF. In the XRD curve of PoT, a sharp peak at 2θ = 8.5° (d = 10.36 Å) was observed, which was assigned as the repeat unit of the polyemeraldine chain, indicating that the introduction of the –CH3 group does not change the repeating unit of the polymeric chain of PANi. Presence of methyl group in aniline ring brings about stearic hindrance in the polymer matrix. This is the reason of getting sharper peaks in the XRD diffractogram of POT in comparison to polyaniline. These sharp peaks at 2θ = 6.74°, 18.78° and 19.55° refer to periodicity parallel to the polymer chain while peak at 23.74° may be caused by periodicity perpendicular to the polymer chain.29 The XRD curve of PoTCF is similar to PoT, due to the coating of PoT molecules on CF, except for slight change in the peaks between 2θ = 24°–27°. All the main peaks of CF are suppressed in the PoTCF pattern, which confirms that CF has a uniform and thick polymer coating on its surface. In the XRD curves of PoTCF25, PoTCF50 and PoTCF75 sheets, the crystallinity decreases because of the presence of phenolic resin, which is amorphous in nature but the signatures of PoT peaks are visible in all curves. Moreover, with increase in the loading of phenolic resin some new peaks start to appear that may be because of the presence of resin in the composite.
image file: c5ra07865b-f2.tif
Fig. 2 (a) XRD spectra of PoT, PoTCF, PoTCF25, PoTCF50 and PoTCF75 sheets and (b) FTIR spectra of PoT, PoTCF and PoTCF25 composites.

3.3 FTIR spectra

Fig. 2b shows the FTIR spectra of PoT, PoTCF and PoTCF25 samples. The characteristic bands of PoT doped with NSA are similar to those observed previously.15 A characteristic band at 3220 cm−1 is due to N–H stretching of the amine group; the peak at ∼2963 cm−1 can be assigned to the stretching vibration of the methyl (–CH3) group. The two bands appearing at 1580–1590 cm−1 and ∼1508 cm−1 correspond to the stretching vibration of the quinoid and benzenoid rings, respectively. The characteristic peak at 1315 cm−1 is attributed to C–N stretching in the Q-B-Q sequence; the peaks at 948 and 813 cm−1 were attributed to in plane C–H vibrations and out of plane C–H vibrations of quinoid rings, whereas a strong band characteristically appears at 1168 cm−1, which has been explained as an electronic or vibrational band of nitrogen quinine, and indicates the degree of electron delocalization in conductive PoT responsible for electrical conductivity.30,31 The presence of the –SO3 group is confirmed by the presence of a band at 1022 cm−1 in all the spectra.32 On comparing spectra of PoT with PoTCF and PoTCF25 samples, it is observed that there is no appearance of new bands and only slight shifting of some bands occurs. This indicates that there is only some ionic interaction of novolac with PoT and CF and no net chemical reaction.

3.4 Thermogravimetry

The TGA curves of the synthesized PoT, PoTCF composite and PoTCF sheets are displayed in Fig. 3a. All the samples show similar thermal degradation and undergo a three stage weight loss pattern. The first stage weight loss up to 115 °C corresponds to the loss of water molecules present in the polymer matrix. The second stage loss from 285 to 440 °C is associated with the loss of dopant molecules from the polymer matrix. The weight loss after 440 °C is due to the complete degradation and decomposition of the polymer backbone.33 On comparing the thermograms of PoT with thermograms of PoTCF composite and PoTCF sheets (Fig. 3a), it is found that, in the case of PoTCF sheets, the loss of dopant continues after 440 °C. In addition, the third stage weight loss in the case of PoTCF and PoTCF sheets is less conspicuous as compared to the third stage weight loss in the case of PoT. The weight of residue left at 800 °C for PoT, PoTCF, PoTCF25, PoTCF50 and PoTCF75 is 40%, 45%, 49%, 51% and 54%, respectively. All these findings confirm that the thermal stability increases by the incorporation of CF into the polymer matrix and blending of PoTCF composite with novolac resin, which further increases with an increase in the wt% of novolac resin into the composite.
image file: c5ra07865b-f3.tif
Fig. 3 (a) TGA curves of PoT, PoTCF, PoTCF25, PoTCF50 and PoTCF75 sheets and (b) the variation of conductivity and flexural strength as a function of wt% of novolac resin in PoTCF sheets.

3.5 Conductivity & flexural strength

Table 1 shows the room temperature conductivities of PoTCF composite and sheet samples, which are measured by the four probe method. Generally, conducting PANi with substituents on its framework shows lower conductivity compared with that of the unsubstituted PANi. Leclerc et al. proposed that the presence of bulky substituents in the polymer chain can induce some nonplanar conformations that decrease the conjugation along the backbone.34 The methyl group on the phenyl ring in PoT can be expected to increase the torsional angle between adjacent rings to relieve steric strain and then lead to the lower conductivity of PoT as compared to unsubstituted PANi.35 The conductivity of blank PoT is of the order of 2.62 × 10⁻³ S cm−1, which is of the same order as in previous reports,15 while upon the addition of CF the conductivity increases to 5.4 × 10⁻¹ S cm−1 (see ESI, Table S1). When PoTCF composite powder was transformed into sheets by blending with novolac resin, the conductivity was found to decrease (Fig. 3b), but this decrease in conductivity is small up to low loading of the resin (25 wt%). It could be suggested that the thermal curing during the moulding of sheets affects the chain alignment of the polymer, which leads to the increase of conjugation length and that maintains moderate conductivity of the sheets in spite of the addition of insulating polymer into the PoTCF composite. The decrease in conductivity is noticeable, when the amount of resin is increased beyond 25 wt%. An expected high decrease in conductivity is found at 75 wt% loading of resin (4.68 × 10⁻⁴ S cm−1), because the higher amount of insulating resin hampers the free flow of electrons in the composite sheets. PoTCF50 also shows fair conductivity because, up to 50 wt% loading of resin, the formation of the conducting network is favoured. However, at 75 wt% loading of resin, the electrical conductivity and EMI shielding properties have been adversely affected due to the insulating nature of the resin so the study is restricted beyond this limit. The conductivity of PoTCF composite powder samples having different amount of novolac resin is less than their respective sheet samples (see ESI). This is due to the increase in connectivity after moulding of sheets and also that the excess of novolac resin squeezes out from the sheets during the thermal curing process.
Table 1 Flexural strength, electrical conductivity and shielding effectiveness of the PoTCF sheets
Sample Phenolic resin (wt%) CF (wt%) Flexural strength (MPa) Conductivity (S cm−1) Shielding effectiveness (dB) Thickness of sheet (mm)
a Samples having higher thickness.
PoTCF25 25 20 22.9 3.10 × 10⁻¹ 9.1 0.81
PoTCF50 50 20 36.0 9.80 × 10⁻² 16.0 0.85
PoTCF50a 50 20 18.8 1.26
PoTCF50a 50 20 23.9 2.11
PoTCF75 75 20 46.6 4.68 × 10⁻⁴ 8.1 0.90


Flexural strength of the composite sheets was measured by a three point bending test based on ASTM D790 (ref. 28) and is shown in Table 1. These values show that PoTCF composite sheets have sufficient strength to be used as external enclosures for electronic equipment for EMI shielding. It is observed that flexural strength increases with increase in the amount of novolac resin in the PoTCF composite (Fig. 3b). This improvement in the flexural strength of sheets is due to the strong binding nature of novolac resin. This, with CF used as a filler in composite sheets, is also responsible for the strength. It has been reported by some research groups that the incorporation of carbon fiber and CNT's in the conjugated polymer matrix improves the electrical and mechanical properties.36

3.6 EMI shielding

The EMI shielding effectiveness (SE) of a material is defined as the ratio of transmitted power to incident power and given by
SET (dB) = 10[thin space (1/6-em)]log (PT/PI) = 20[thin space (1/6-em)]log (ET/EI) = 20[thin space (1/6-em)]log (HT/HI)
where PI (EI or HI) and PT (ET or HT) are the power (electric or magnetic field) of incident and transmitted EM waves, respectively.

To investigate the microwave attenuation performance of the PoTCF composite sheets, the scattering parameters (S11 and S21) were measured by vector network analyzer to calculate the absorption coefficient (A), reflection coefficient (R), transmittance coefficient (T) and absorption efficiency of the sheets. The reflection and transmission coefficient were calculated using scattering parameters as, R = |ER/EI|2 = |S11|2 = |S22|2 and T = |ET/EI|2 = |S21|2 = |S12|2. The absorption coefficient and effective absorbance (Aeff) was calculated as A = (1 − RT) and Aeff = (1 − RT)/(1 − R), respectively.37 Fig. 4a and b show the calculated transmission coefficient and absorption efficiency values of the PoTCF sheets having thickness of ∼0.85 mm in the frequency range of 8.2–12.4 GHz. The transmission coefficient (T) is minimum (0.03) for PoTCF50 sheet. For all PoTCF sheets, the value of T is less than 0.22, as shown in Fig. 4a, which is because of the higher value of reflection and absorption coefficients. It is proposed that more wave energy is attenuated by the PoTCF sheets, leading to a decrease in the T value. Moreover, the absorption efficiency of the PoTCF50 sheets was 87 and it reaches up to 99.9 at a thickness of 2.11 mm. The total SET is the sum of SE due to reflection (SER) and SE due to absorption (SEA) and given by SET = SER + SEA, SER and SEA were calculated using equations21,23

SER = −10[thin space (1/6-em)]log (1 − R) and SEA = −10[thin space (1/6-em)]log (1 − Aeff) = −10[thin space (1/6-em)]log (T/1 − R).


image file: c5ra07865b-f4.tif
Fig. 4 (a) Transmission coefficient and (b) absorption efficiency of PoTCF sheets at a thickness of ∼0.85 mm.

Fig. 5a shows the variation of SER and SEA of PoTCF sheets with frequency in the range from 8.2 to 12.4 GHz. It can be observed from the figure that the total shielding effectiveness (SET) value is equally shared between SER and SEA. From the experimental measurements, the shielding effectiveness value due to absorption (SEA) is found to be 3.1, 8.7 & 3.3 dB for PoTCF25, PoTCF50 and PoTCF75, respectively, whereas the shielding effectiveness due to reflection (SER) is 6.0, 7.2 and 4.8 dB for PoTCF25, PoTCF50 and PoTCF75, respectively.


image file: c5ra07865b-f5.tif
Fig. 5 Variation of shielding effectiveness with frequency in the range of 8.2–12.4 GHz, showing effect of novolac concentration: (a) SEA and SER of different sheets and (b) SET of different sheets and SET of PoTCF50 sheets with different thickness.

Fig. 5b shows the total shielding effectiveness SET of PoTCF25, PoTCF50 and PoTCF75, which is found to be 9.1, 16.0, and 8.1 dB, respectively, at a matching thickness of ∼0.85 mm. It is clear from the graph that SET is found to be maximum for PoTCF50. At 50 wt% loading of novolac resin strong fiber–matrix interface interaction is created. The conductive PoTCF composite sheets have charge storage capacities capable of absorbing electromagnetic waves by electric polarization. Fig. 5b also shows the variation of SET with frequency for PoTCF50 sheets at varying thickness of 0.85 mm, 1.26 mm and 2.11 mm, which shows that by varying the thickness of the composite sheets the total shielding effectiveness SET increases from 16 to 24 dB. Thus, we can increase the value of total shielding effectiveness (SET) by increasing the thickness of sheets to bring it to a value sufficient for techno-commercial as well as military applications. Apart from the thickness of the sample, shielding effectiveness depends on many other factors such as the penetration depth (see ESI), polymer matrix type, concentration of conductive filler, fabrication method and processing conditions. Although the shielding performance of composite materials cannot be compared on the basis of literature data, because EMI shielding varies with many uncontrolled factors, this synthesized lightweight PoTCF composite having a satisfactory value of SE has been compared (Table 2) with some of the recently reported conducting polymer composites. On the basis of experimental measurements and comparison with literature data, it is now clear that poly(o-toluidine) with CF, which has not been previously explored for shielding applications, may have the potential to be used as a convenient material for EMI shielding.

Table 2 Electromagnetic shielding effectiveness of different conducting polymer-based composites
Polymer matrix Filler Filler wt% Frequency range (GHz) Total shielding effectiveness (dB) Reference
Polyaniline Carbon black 30 2–18 40 Wu et al.38
Polyaniline CF 20 8.2–12.4 35 Kumar et al.16
Polyaniline Graphene 33 2–18 34.2 Bingqing et al.22
Polyaniline SWCNT 25 2–18 31.5 Bingqing et al.22
Polyaniline Fe3O4 66 12.418 11.5 Singh et al.39
Polyaniline CF 20 8.2–12.4 31.9 Joon et al.17
Polyaniline Fly 75 12.4–18 32 Singh et al.40
Polypyrrole CF 25 12.4–18 23 Varshney et al.25
Poly-o-toluidine CF 20 8.2–12.4 24 Present study


4. Conclusion

PoTCF thin sheets were prepared by a low cost, facile method. By in situ incorporation of CF into a PoT matrix, the thermal, mechanical, electrical and shielding properties of these sheets were improved and further optimized using varying amounts of novolac resin as a binder. Optimizing the amount of novolac resin increases the thermal and mechanical properties of PoTCF sheets without affecting the shielding properties significantly. It is found that these sheets have improved thermal stability, and electrical conductivity was found to be between 3.1 × 10⁻¹ to 4.68 × 10⁻⁴ S cm−1. PoTCF50 sheet is found to have a maximum shielding effectiveness (24 dB at a thickness of 2.11 mm) with flexural strength of 36.0 MPa. From the data obtained it is concluded that PoTCF sheets, due to their light weight, good processibility and sufficient electromagnetic shielding effectiveness at thin matching thickness, can be added as an economical material into the list of electromagnetic wave absorbers for military as well as other techno-commercial applications.

Acknowledgements

The authors wish to thank Director CSIR-NPL and Chairperson, Department of Physics, DCRUST, for their keen interest in the work. The authors thank Dr R. B. Mathur for the measurement of mechanical properties and K. N. Sood for recording SEM micrograph.

References

  1. H. K. Song and G. T. R. Palmore, Adv. Mater., 2006, 18, 1764–1768 CrossRef CAS PubMed.
  2. G. B. Street and T. Skotheim, Handbook of Conducting Polymers, Marcel Dekker, New York, 1986, vol. 1, p. 265 Search PubMed.
  3. L. Shacklette, N. Colaneri, V. Kulkarni and B. Wessling, J. Vinyl Technol., 1992, 14, 118–122 CrossRef CAS PubMed.
  4. J. E. P. da Silva, S. I. C. de Torresi and R. M. Torresi, Prog. Org. Coat., 2007, 58, 33–39 CrossRef PubMed.
  5. L. Mattoso, S. Manohar, A. MacDiarmid and A. Epstein, J. Polym. Sci., Part A: Polym. Chem., 1995, 33, 1227–1234 CrossRef CAS PubMed.
  6. G. D. Storrier, S. B. Colbran and D. B. Hibbert, Synth. Met., 1994, 62, 179–186 CrossRef CAS.
  7. R. C. Patil, S. M. Ahmed and K. Ogura, Polym. J., 2000, 32, 466–470 CrossRef CAS.
  8. J. Joo, Y. C. Chung, H. G. Song, J. S. Baeck, W. P. Lee, A. J. Epstein, A. G. MacDiarmid, S. K. Jeong and E. J. Oh, Synth. Met., 1997, 84, 739–740 CrossRef CAS.
  9. S.-A. Chen and G.-W. Hwang, J. Am. Chem. Soc., 1995, 117, 10055–10062 CrossRef CAS.
  10. S. M. Ahmed and S. A. Ahmed, Sci. Res. Essays, 2008, 3, 299 Search PubMed.
  11. B. Adhikari and S. Majumdar, Prog. Polym. Sci., 2004, 29, 699–766 CrossRef CAS PubMed.
  12. K. Ziadan, H. Hussein and K. Ajeel, Energy Procedia, 2012, 18, 157–164 CrossRef CAS PubMed.
  13. M. Mobin and N. Tanveer, J. Coat. Technol. Res., 2012, 9, 27–38 CrossRef CAS.
  14. R. Diaz Calleja, E. S. Matveeva and V. P. Parkhutik, J. Non-Cryst. Solids, 1995, 180, 260–265 CrossRef CAS.
  15. T. Abdiryim, Z. Xiao-Gang and R. Jamal, J. Appl. Polym. Sci., 2005, 96, 1630–1634 CrossRef CAS PubMed.
  16. R. Kumar, S. Joon, A. P. Singh, B. Singh and S. Dhawan, Am. J. Polym. Sci., 2015, 5, 28–39 Search PubMed.
  17. S. Joon, R. Kumar, A. P. Singh, R. Shukla and S. Dhawan, Mater. Chem. Phys., 2015, 160, 87–95 CrossRef CAS PubMed.
  18. J.-M. Thomassin, C. Jérôme, T. Pardoen, C. Bailly, I. Huynen and C. Detrembleur, Mater. Sci. Eng., R, 2013, 74, 211–232 CrossRef PubMed.
  19. S. Geetha, K. K. Satheesh Kumar, C. R. K. Rao, M. Vijayan and D. C. Trivedi, J. Appl. Polym. Sci., 2009, 112, 2073–2086 CrossRef CAS PubMed.
  20. A. P. Singh, P. Garg, F. Alam, K. Singh, R. B. Mathur, R. P. Tandon, A. Chandra and S. K. Dhawan, Carbon, 2012, 50, 3865–3875 Search PubMed.
  21. B. Wen, X. X. Wang, W. Q. Cao, H. L. Shi, M. M. Lu, G. Wang, H. B. Jin, W. Z. Wang, J. Yuan and M. S. Cao, Nanoscale, 2014, 6, 5754–5761 RSC.
  22. B. Yuan, L. Yu, L. Sheng, K. An and X. Zhao, J. Phys. D: Appl. Phys., 2012, 45, 235108 CrossRef.
  23. P. Sambyal, A. P. Singh, M. Verma, M. Farukh, B. P. Singh and S. K. Dhawan, RSC Adv., 2014, 4, 12614–12624 RSC.
  24. T. K. Gupta, B. P. Singh, R. B. Mathur and S. R. Dhakate, Nanoscale, 2014, 6, 842–851 RSC.
  25. S. Varshney, A. Ohlan, K. Singh, V. K. Jain, V. P. Dutta and S. K. Dhawan, Sci. Adv. Mater., 2013, 5, 881–890 CrossRef CAS PubMed.
  26. D. D. L. Chung, Carbon, 2001, 39, 279–285 CrossRef CAS.
  27. Q. J. Krueger and J. A. King, Adv. Polym. Technol., 2003, 22, 96–111 CrossRef CAS PubMed.
  28. A. Standard, American Society for Testing and Materials.
  29. M. Wan and J. Li, Polym. Adv. Technol., 2003, 14, 320–325 CrossRef CAS PubMed.
  30. J. Lal and R. Green, J. Polym. Sci., 1955, 17, 403–409 CrossRef CAS PubMed.
  31. F. Cataldo and P. Maltese, Eur. Polym. J., 2002, 38, 1791–1803 CrossRef CAS.
  32. M. V. Kulkarni and A. K. Viswanath, Eur. Polym. J., 2004, 40, 379–384 CrossRef CAS PubMed.
  33. S. F. Patil, A. G. Bedekar and C. Agashe, Mater. Lett., 1992, 14, 307–312 CrossRef CAS.
  34. M. Leclerc, G. D'Aprano and G. Zotti, Synth. Met., 1993, 55, 1527–1532 CrossRef CAS.
  35. G. D'Aprano, M. Leclerc and G. Zotti, J. Electroanal. Chem., 1993, 351, 145–158 CrossRef.
  36. M. H. Al-Saleh, W. H. Saadeh and U. Sundararaj, Carbon, 2013, 60, 146–156 CrossRef CAS PubMed.
  37. M. Mishra, A. P. Singh, B. Singh, V. Singh and S. Dhawan, J. Mater. Chem. A, 2014, 2, 13159–13168 CAS.
  38. K. H. Wu, T. H. Ting, G. P. Wang, W. D. Ho and C. C. Shih, Polym. Degrad. Stab., 2008, 93, 483–488 CrossRef CAS PubMed.
  39. K. Singh, A. Ohlan, V. H. Pham, B. R, S. Varshney, J. Jang, S. H. Hur, W. M. Choi, M. Kumar, S. K. Dhawan, B.-S. Kong and J. S. Chung, Nanoscale, 2013, 5, 2411–2420 RSC.
  40. A. P. Singh, A. Kumar, A. Chandra and S. Dhawan, AIP Adv., 2011, 1, 022147 CrossRef PubMed.

Footnote

Electronic supplementary information (ESI) available. See DOI: 10.1039/c5ra07865b

This journal is © The Royal Society of Chemistry 2015
Click here to see how this site uses Cookies. View our privacy policy here.