Improved daylight-induced photocatalytic performance and suppressed photocorrosion of N-doped ZnO decorated with carbon quantum dots†
S. Muthulingama,
Kang Bin Baeb,
Rizwan Khanb,
In-Hwan Lee*b and
Periyayya Uthirakumar*ab
aNanoscience Center for Optoelectronic and Energy Devices [Nano-COED], Department of Chemistry, Sona College of Technology, Salem, Tamilnadu 636 005, India. E-mail: uthirakumar@gmail.com
bSchool of Advanced Materials Engineering and Research Center of Advanced Materials Development, Chonbuk National University, Jeonju 561-756, South Korea. E-mail: ihlee@jbnu.ac.kr; Tel: +82-63-270-2292
First published on 12th May 2015
Abstract
Composites of N-doped ZnO decorated with carbon quantum dots were prepared as a promising strategy to enhance their photocatalytic performance in the degradation of aqueous malachite green dye. The carbon quantum dots enhanced the efficiency of the absorption of visible light and effectively separated the photogenerated electron–hole pairs, in addition to suppressing the photocorrosion of the ZnO crystals.
The development of efficient photocatalysts is an important issue in environmental remediation after contamination with organic pollutants from the textile and food industries. Various inorganic semiconductors have been recommended for use as photocatalysts as a result of their efficiency and broad range of applications. Zinc oxide (ZnO) is widely used as a result of its high catalytic activity, low cost, wide band gap (3.37 eV) and environmentally friendly properties.1 However, the rapid recombination of the photogenerated electron–hole pairs and the narrow absorption band of ZnO photocatalysts affect their efficiency as photocatalysts. To overcome these issues, we need to develop new ZnO nanostructures via the incorporation of either a secondary semiconductor metal2 or carbon nanoparticles.3–9 Nitrogen doping can also be used to alter the band gap energy of ZnO and therefore improve the charge separation efficiency of the photocatalyst.10 For example, nitrogen anions, with their small ionic radii, can easily be incorporated into the ZnO lattice by either replacing the O atoms or by occupying the interstitial sites. This doping will extend the light harvesting of ZnO to higher wavelengths.10,11
Carbon quantum dots (CQDs) have recently received much attention because they are non-toxic, photostable, low cost, free of heavy metals and environmentally friendly compared with traditional quantum dots based on toxic heavy metals, which can cause serious health and environmental issues.11 Although there have been a number of reports on the use of C-60, graphene and carbon nanofibres as electron scavenging agents,3,6,7 photocatalysts have rarely been synthesized using CQDs.5 CQDs have photo-induced electron transfer properties7 and improved photoluminescence properties5 compared with other carbon-based structures. Thus the combination of N-doped ZnO and CQDs seems to be an ideal means of improving charge separation by hindering charge recombination and thus enhancing both the photocatalytic efficiency of ZnO and reducing photocorrosion. From an industrial perspective, it is expensive to provide a specific source of either UV or visible light to treat large amounts of industrial wastewater. Therefore, the use of naturally available daylight would be a better method of degrading dye molecules on a large scale.
We report here a simple method for the preparation of N-doped ZnO, CQDs and N-ZnO decorated with CQDs (CQD/N-ZnO) that show enhanced photocatalytic activity towards malachite green (MG) dye under various light sources. We evaluated the photocatalytic performance of the CQD/N-ZnO composite under irradiation with naturally available direct daylight.
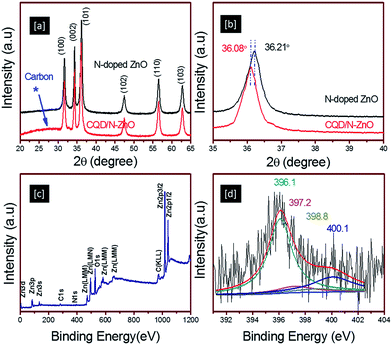
The detailed synthesis, characterization and photocatalytic investigations are given in the ESI.† The crystal structure and phase composition of the N-doped ZnO and CQD/N-ZnO composites were determined by X-ray diffraction (XRD). Fig. 1a and b show the XRD patterns of the N-doped ZnO and CQD/N-ZnO composites. The XRD spectra showed that the N-doped ZnO was well crystallized and the diffraction peaks could be perfectly indexed to the hexagonal phase of ZnO (JCPDS no. 79-0206). The primary diffraction peaks appeared at 2θ values of 31.7, 33.4 and 36.2°, representing the (100), (002) and (101) crystal planes of ZnO.12 For the CQD/N-ZnO composite, a broader diffraction peak appeared near 26°, attributed to the graphitic (002) peak, together with a slight shift (36.21 to 36.08°) in the (002) diffraction peak, as clearly seen in the enlarged XRD patterns between 35 and 40° (Fig. 1b). This indicated that the CQDs had been successfully coated onto the ZnO surface.4 However, no obvious deviation assigned to nitrogen doping was detected in the XRD patterns. X-ray photoelectron spectrometry (XPS) was therefore used to investigate the chemical state and surface composition of the powdered samples. Fig. 1c and d show the XPS survey scan and the high-resolution XPS core level N 1s scan of the CQD/N-ZnO composite. The full XPS survey scan of the CQD/N-ZnO composite shows peaks that can be assigned to Zn, O, C and N. The core level high-resolution N 1s spectrum (Fig. 1d) shows peaks at 396.1, 397.2, 398.8 and 400.1 eV, which indicated that N was incorporated into the ZnO crystals. The major peak at 396.1 eV was assigned to the –N–Zn–N– bonds and the peak at 397.2 eV was assigned to the –N–C– bond.13 The other two peaks at 398.8 and 400.1 eV were assigned to the –N–H– and –O–Zn–N– bonds, respectively.13,14 The detailed high-resolution XPS spectra of the Zn 2p, C 1s and O 1s core level scans are given in Fig. S1.† The existence of both the CQD and ZnO phases in the CQD/N-ZnO composite was further confirmed by nano-Raman, UV-visible and Fourier transform infrared (FTIR) spectrometry, energy-dispersive spectrometry (EDS) and high-resolution transmission electron microscopy (HRTEM).
 | ||
| Fig. 1 (a and b) XRD spectra of N-doped ZnO and the CQD/N-ZnO composites. (c) XPS survey scan and (d) high-resolution N 1s core spectrum of the CQD/N-ZnO composite. | ||
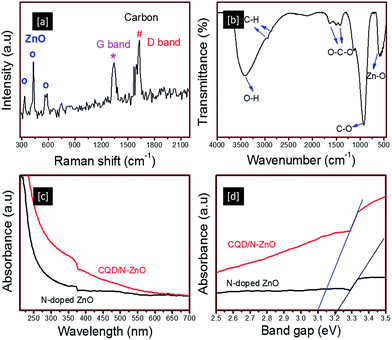
Nano-Raman spectrometry was used to confirm the occurrence of Raman-active modes in both phases of the CQDs and ZnO in the CQD/N-ZnO composite (Fig. 2a). The Raman-active modes of ZnO at 331, 434 and 580 cm−1 were related to the second-order scattering arising from the boundary zone phonons 2E2, E2 (high) and the polar symmetry modes A1 (LO),15 respectively. Similarly, the occurrence of carbon-related Raman-active modes of graphite (G) and defect (D) bands were observed at 1340 and 1600 cm−1, respectively, suggesting the presence of Raman-active modes related to the CQDs and ZnO in CQD/N-ZnO composite. The existence of both phases in the CQD/N-ZnO composite was confirmed by FTIR spectrometry (Fig. 2b). The broad absorption band of hydrogen-bonded O–H stretching vibrations appeared at about 3408 cm−1; the other two peaks at about 2929 and 2862 cm−1 were assigned to the C–H stretching vibration. The asymmetric and symmetric vibrations of the O–C–O bonds were seen at about 1619 and 1422 cm−1; the peaks at about 1129 and 902 cm−1 were related to the C–O bonds and epoxy groups; and the absorption bands at about 587 cm−1 were attributed to the stretching vibrations of Zn–O.4
 | ||
| Fig. 2 (a) Raman and (b) FTIR spectra of the CQD/N-ZnO composite. (c and d) UV-visible absorption spectra of N-doped ZnO and CQD/N-ZnO composites. | ||
The UV-visible absorption spectra of N-doped ZnO and CQD/N-ZnO composite were also measured (Fig. 2c and d). The representative absorption peak with a transition in the UV region was observed in both samples as a result of the bandgap transition of the ZnO semiconductor. However, the CQD/N-ZnO composite showed a continuous wide absorption band from the UV to the visible region (up to 600 nm), together with a slight shift in the bandgap energy to a lower region compared with N-doped ZnO (Fig. 2d). Thus the UV and FTIR results provided additional evidence that the CQDs were successfully decorated on the ZnO crystals, in agreement with the XRD and Raman results.
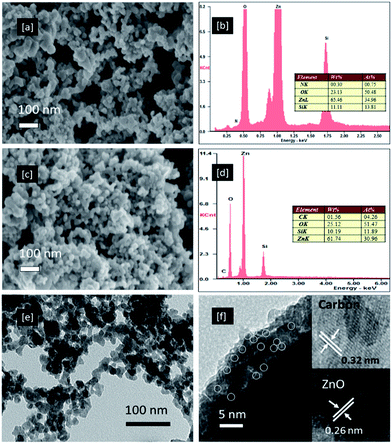
Fig. 3a–d show the highly magnified field emission scanning electron microscopy (FESEM) images and respective EDS spectra of the N-doped ZnO and CQD/N-ZnO composites. The N-doped ZnO nanoparticles appear to be spherical (about 25 nm) and dispersed throughout the sample (Fig. 3a). There was no obvious change in the particle size for the CQD/N-ZnO photocatalyst (Fig. 3c). However, the EDS spectra of the CQD/N-ZnO composite showed the existence of Zn, O, C and N, strongly confirming the presence of both phases of CQD and ZnO; this was further confirmed by the TEM and HRTEM images in Fig. 3e and f. The particle sizes of the N-doped ZnO crystal and pure CQDs (Fig. S2†) were about 25 and 2.5 nm, respectively. The insets in Fig. 3f show the HRTEM image of the CQD/N-ZnO composites; the lattice spacing was measured to be about 0.26 nm for ZnO and about 0.32 nm for carbon.4 Based on these results, it can be concluded that the CQD/N-ZnO composite was composed of both CQDs and ZnO phases.
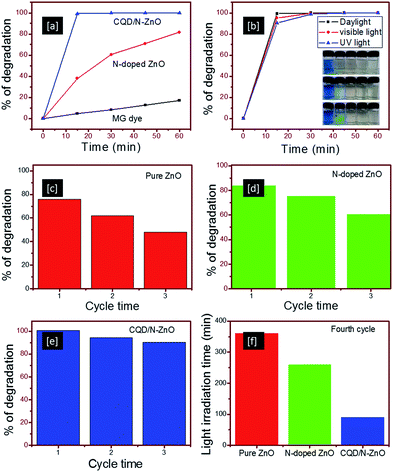
The photocatalytic activities of the N-doped ZnO and CQD/N-ZnO composites were evaluated in the photodegradation of MG dye under different light sources. In general, the absorption spectrum of the MG dye consisted of three peaks, a major peak at 612 nm and two minor peaks at 418 and 310 nm (Fig. S3†). To monitor the degradation characteristics of the MG dye, the absorption peak at 612 nm was considered rather than the minor peaks. Fig. 4a shows the degradation efficiency graph of pure MG dye, N-doped ZnO and CQD/N-ZnO composites under irradiation with naturally available daylight. Degradation efficiencies of 60 and 100% were measured after 30 min of irradiation with daylight for the N-doped ZnO and CQD/N-ZnO composites, respectively, whereas about 18% MG dye degradation was seen without a catalyst (Fig. S3†). This result showed that the CQD/N-ZnO composite had a dramatic photocatalytic performance under irradiation with daylight and that only 30 min were required to degrade all the MG dye molecules.
To validate the photocatalytic performance of the CQD/N-ZnO composites, the percentage photodegradation of the CQD/N-ZnO composite was compared with previously reported values for other metal oxide photocatalysts decorated with CQDs. For instance, a CQD/α-Fe2O3 photocatalyst was reported to destroy methylene blue (MB) dye in 90 min by the addition of H2O2 under visible light.16 A CQD/ZnO heterostructure was reported to degrade 80% of RhB dye after 2 h of irradiation with UV light.17 Similarly, a C/TiO2 photocatalyst needed at least 4 h of irradiation with visible light to decompose about 80% of methyl orange dye.18 A ZnO/graphene photocatalyst showed around 90% degradation of MB dye in 40 min under UV light.19 A photocatalyst of TiO2/C-dots needed at least 4 h to degrade MB dye under visible light13 and just 90% degradation of MB dye occurred in 4 h under near-IR light with CQDs/Cu2O.20 We therefore concluded that the superior photocatalytic performance of the CQD/N-ZnO composite primarily came from the combination effect of both the CQDs and the N-doping characteristics (Fig. S4†).
The photocatalytic performance may have been enhanced because: (1) both the N-doping and CQDs were acting as electron reservoirs, which efficiently separated the photogenerated electron–hole pairs and ultimately hindered charge recombination to generate photoreactive sites;14,19,21 (2) a stronger electronic coupling of the π electrons of carbon with the conduction band of ZnO occurred because the work function of the CQDs (−4.5 eV) was just below the conduction band energy of ZnO at −4.05 eV, leading to up-conversion (Fig. S5†)5 and to extension of the absorption capability into the longer wavelength region.18 Therefore, it is concluded that the increased ability of the ZnO crystal to absorb visible light is due to the N-doping11,21 and CQDs.5–7
The photocatalytic performance of the CQD/N-ZnO composites was further correlated with other common light sources of UV and visible light (Fig. 4b). Irrespective of the source of light, the CQD/N-ZnO composites degraded all the dye molecules within 30 min of illumination with light. However, as seen in Fig. 4b, a slight disparity in the percentage of degradation was noticed after 15 min of exposure to UV (90%), visible (95%) and daylight sources (99%). These results were consistent with the photographs (Fig. 4b, insets) of the respective dye solution collected after an interval of 15 min under irradiation with different light sources. A slight green shade was still visible in the samples irradiated with both UV and visible light (after 15 min), whereas no such noticeable shade was detected in the sample irradiated with daylight. At the same time, the N-doped ZnO photocatalyst required more than 60 min to degrade at least 80% of the MG dye with daylight irradiation, with a gradual decrease in the shade of green (Fig. S6†). Thus we concluded that the CQD/N-ZnO photocatalyst caused a rapid degradation of the MG dye solution regardless of the light source. This rapid photocatalytic performance of CQD/N-ZnO under irradiation with daylight encourages us to recommend this composite as a suitable candidate for the treatment of industrial wastewater; it is more cost-effective to use naturally available daylight than a specific light source to treat large volumes of industrial wastewater.
For an industrial perspective, resistance to photocorrosion is an important characteristic for catalysts in continuous use in dye degradation. Repeated experiments were conducted with pure ZnO, N-doped ZnO and CQD/N-ZnO composites and the results indicated that the CQD/N-ZnO composites were relatively stable photocatalysts that could be effectively reused. Fig. 4c–e show the experimental results for pure ZnO, N-doped ZnO and CQD/N-ZnO composites after three cycles of irradiation with daylight for 60 min. The photocatalytic efficiency of pure ZnO decreased dramatically from 75% (cycle 1) to 47% (cycle 3), while a relatively lower decreasing trend was observed in the N-doped ZnO (83 to 60%) and CQD/N-ZnO composites (100 to 91%). The reduction in the degradation efficiency of the CQD/N-ZnO composites was probably a result of the percentage mass lost from the photocatalyst during each cycle. After each cycle, the photocatalyst was recovered by centrifuging and washing and was then reused in the next cycle. However, the expected mass loss was <2–3% by weight per cycle. A fourth cycling experiment was carried out to investigate the total time required for the maximum degradation of the MG dye molecules (Fig. 4f). The CQD/N-ZnO composite required just 90 min to degrade the MG dye completely in the fourth cycle beyond the weight loss, whereas the N-doped ZnO required 4.2 h to degrade around 90% of the MG dye under irradiation with daylight. Pure ZnO required more than 6 h to degrade 80% of the dye molecules. This result strongly confirms the suppressed photocorrosion offered by the CQDs, which effectively inhibit photocorrosion. This was verified using the TEM images and XRD spectra of photocatalysts after four successive experiments. Based on the TEM images, it can be clearly seen that the size and shape remained unchanged in the case of the CQD/N-ZnO photocatalyst, whereas wire-like morphologies were observed for the N-doped ZnO (Fig. S7†). This observation was further confirmed by the XRD measurements; new XRD peaks appeared at 27.6, 32.7, 59.3 and 60.3°, representing the degradation of the ZnO crystals and the formation of a Zn5(OH)6(CO3)2 phase (Fig. S7†). These results indicate that coverage with the CQDs could act as a shield to preserve the ZnO crystals from photocorrosion.
Naturally available daylight was used to investigate the photocatalytic effect of N-doped ZnO decorated with CQDs on aqueous MG dye. The capability of the CQD/N-ZnO composite to be excited by a wide range of wavelengths facilitated a higher separation efficiency, increased the number of photoreactive sites and suppressed photocorrosion, leading us to suggest that this composite is a promising photocatalyst for the treatment of industrial wastewater.
Acknowledgements
This research was encouraged by the management of Sona College of Technology and supported by the National Research Foundation of Korea (NRF) funded by the Ministry of Science, ICT & Future Planning (2013R1A2A2A07067688, 2010-0019626).Notes and references
- S. Chakrabarti and B. K. Dutta, J. Hazard. Mater., 2004, 112, 69–78 CrossRef PubMed.
- M. K. Lee and H. F. Tu, J. Electrochem. Soc., 2008, 155, D758–D762 CrossRef CAS PubMed.
- J. B. Mu, C. L. Shao, Z. C. Guo, Z. Y. Zhang, M. Y. Zhang, P. Zhang, B. Chen and Y. C. Liu, ACS Appl. Mater. Interfaces, 2011, 3, 590–596 CAS.
- Y. Li, B. P. Zhang, J. X. Zhao, Z. H. Ge, X. K. Zhao and L. Zou, Appl. Surf. Sci., 2013, 279, 367–373 CrossRef CAS PubMed.
- H. Yu, H. C. Zhang, H. Huang, Y. Liu, H. T. Li, H. Ming and Z. H. Kang, New J. Chem., 2012, 36, 1031–1035 RSC.
- C. H. Kim, B. H. Kim and K. S. Yang, Carbon, 2012, 50, 2472–2481 CrossRef CAS PubMed.
- X. Wang, L. Cao, F. S. Lu, M. J. Meziani, H. T. Li, G. Qi, B. Zhou, B. A. Harruff, F. Kermarrec and Y. P. Sun, Chem. Commun., 2009, 25, 3774–3776 RSC.
- K. Dai, G. Dawson, S. Yang, Z. Chen and L. Lu, Chem. Eng. J., 2012, 191, 571–578 CrossRef CAS PubMed.
- P. Muthirulan, M. Meenakshisundararam and N. Kannan, J. Adv. Res., 2013, 4, 479–484 CrossRef CAS PubMed.
- S. S. Shinde, C. H. Bhosale and K. Y. Rajpure, J. Photochem. Photobiol., B, 2012, 113, 70–77 CrossRef CAS PubMed.
- H. T. Li, Z. H. Kang, Y. Liu and S. T. Lee, Mater. Chem., 2012, 22, 24230–24253 RSC.
- P. Uthirakumar, S. Muthulingam, B. D. Ryu, J. H. Kang, A. Periyasamy, M. Prabakaran and C. H. Hong, Curr. Nanosci., 2013, 9, 335–340 CrossRef CAS.
- P. B. Ashwini, D. S. Shivaram, P. W. Rupali, K. N. Latesh and B. K. Bharat, Green Chem., 2012, 14, 2790–2798 RSC.
- X. Zong, C. Sun, H. Yu, Z. G. Chen, Z. Xing and D. Ye, J. Phys. Chem. C, 2013, 117, 4937–4942 CAS.
- H. M. Cheng, K. F. Lin, H. C. Hsu, C. J. Lin, L. J. Lin and W. F. Hsieh, J. Phys. Chem. B, 2005, 109, 18385–18390 CrossRef CAS PubMed.
- B. Y. Yu and S. Y. Kwak, J. Mater. Chem., 2012, 22, 8345–8353 RSC.
- Y. Li, B. P. Zhang, J. X. Zhao, Z. H. Ge, X. K. Zhao and L. Zou, Appl. Surf. Sci., 2013, 279, 367–373 CrossRef CAS PubMed.
- L. Zhao, X. Chen, X. Wang, Y. Zhang, W. Wei, Y. Sun, M. Antonietti and M. M. Titirici, Adv. Mater., 2010, 22, 3317–3321 CrossRef CAS PubMed.
- T. Xu, L. Zhang, H. Cheng and Y. Zhu, Appl. Catal., B, 2011, 101, 382–387 CrossRef CAS PubMed.
- H. T. Li, R. H. Liu, Y. Liu, H. Huang, H. Yu, H. Ming, S. Y. Lian, S. T. Lee and Z. H. Kang, J. Mater. Chem., 2012, 22, 17470–17475 RSC.
- Y. Qiu, K. Yan, H. Deng and S. Yang, Nano Lett., 2012, 12, 407–413 CrossRef CAS PubMed.
Footnote |
| † Electronic supplementary information (ESI) available. See DOI: 10.1039/c5ra07811c |
| This journal is © The Royal Society of Chemistry 2015 |


