DOI:
10.1039/C5RA07804K
(Paper)
RSC Adv., 2015,
5, 54952-54962
Selective recognition of hydrogen sulfide using template and catalyst free grown ZnO nanorods†
Received
28th April 2015
, Accepted 16th June 2015
First published on 17th June 2015
Abstract
Hydrogen sulfide is an important endogenous signaling molecule which can play a key role in regulating blood pressure, cardiovascular and age-associated diseases. But it is extremely toxic if inhaled and can even cause death at higher concentrations. This work reports a systematic investigation of template and catalyst free grown ZnO nanorods through simple chemical spray pyrolysis technique and their room temperature hydrogen sulfide sensing characteristics such as sensitivity, selectivity, stability, response and recovery times. The structural, morphological, optical and electrical properties of ZnO nanostructures were investigated using X-ray diffractometer (XRD), field emission scanning electron microscope (FE-SEM), UV-Vis spectrophotometer and electrometer respectively. The role of density of nanorods formed on the glass substrates through spray cycle modulation has been used as an effective tool for achieving better sensing response. ZnO nanorods with the diameter ranging from 200–250 nm exhibited high selectivity towards hydrogen sulfide and the mechanism has been reported. The challenge of selectivity has also been solved efficiently through ZnO nanorods.
1. Introduction
Hydrogen sulfide is identified as an important signaling molecule synthesized enzymatically in humans and effectively involved in various physiological and pathophysiological processes such as learning, memory, regulation of blood pressure, inflammation, metabolic disorders like obesity and diabetes.1–4 But it is deadly poison if inhaled and results in various health effects depending on the concentration and duration of exposure. Exposure to lower concentrations can cause irritation to the eyes, throat, respiratory system, dizziness, headache, nausea, temporary loss of sense of smell, etc.5,6 Exposure to above the limit of 200–300 ppm can cause hemorrhagic pulmonary.7 Above 500 ppm concentration, it can cause death within few seconds or minutes.8,9 It is worth noting that the toxicity of hydrogen sulfide is even stronger than hydrogen cyanide in terms of half maximal inhibitory concentration (IC50).10 National Institute of Occupational Safety and Health (NIOSH) has recommended the permissible exposure limit (PEL) of hydrogen sulfide as 10 ppm for 10 min. Occupational Safety and Health Administration (OSHA) suggested that during 8 h week shift, the concentration must not exceed 20 ppm. Exposure to 100 ppm of hydrogen sulfide is considered as Immediately Dangerous to Life and Health (IDLH).9,11 Due to high toxicity of hydrogen sulfide, monitoring the concentration level is essential in manholes, sewage treatment plants, petrochemical plants, biogas fermentation, wastewater treatment plants, etc.9,12 Moreover, hydrogen sulfide is one of the biomarkers for the diagnosing diabetes, lung cancer, halitosis as well as for meat and fish freshness levels.13–16 Hence, a highly sensitive and selective hydrogen sulfide sensors capable of detecting wide range of concentration must be developed as a part of the safety system to protect human lives.
Electrochemical, semiconducting metal oxide, quartz crystal microbalance, optical, conducting polymer, surface acoustic wave type sensors are commonly employed for the detection of hydrogen sulfide.17 Among them, there is a strong interest in semiconducting metal oxide based chemiresistive sensors due to their chemical stability, cost effectiveness, feasible for electronic interface, easy tuning of its electrical properties by annealing and doping.18,19 In various metal oxide semiconductors such as ZnO, CuO, SnO2, In2O3, CdO, WO3, Cr2O3 have been used to detect hydrogen sulfide. However, these sensors are severely limited in practical applications due to higher operating temperature, low cross selectivity, limited range of detection, longer response and recovery times.20–24 These facts necessitate the development of highly sensitive and selective room temperature hydrogen sulfide sensor.
There has been a great deal of interest in ZnO based 1D nanostructures for sensing applications due to their high surface to volume ratio and single crystalline facets. Till now variety of techniques have been addressed for the growth of 1D ZnO nanostructures.25,26 Several researchers employed two step approach like growth of nanorods on the substrates with seed layers. In literature, various ZnO nanostructures such as nanorods with flower like morphology, nanowires, dendritic type structures prepared by vapour phase transport method were reported as hydrogen sulfide sensors.27–29 Also several catalysts such as Pd, Ag, Mg, Mo, NiO, CdO CuO, ZnS were used to enhance the sensitivity.30–33 Multistep preparation methods and surface functionalization are major obstacles in creating 1D nanostructures in a cost effective manner.
Already our group explored methods to grow various ZnO nanoarchitectures through spray pyrolysis technique without any template or catalyst. At low temperature spray deposition, self-standing randomly interconnected nanoplatelets were formed on glass substrates. Further, through annealing treatment various hierarchical nanostructures, namely tiny nanoplatelets, branched nanorods and thicker nanoplatelets were formed. But always there has been a great deal of interest in growing self-standing vertically aligned nanorods in a simple and cost effective way. Hence in this work, a single step spray pyrolysis technique without any template or catalyst was used to grow ZnO nanorods on glass substrates by controlling the by-product HCl concentration. The advantages of spray pyrolysis technique are large scale deposition using low cost raw materials, no need of vacuum for deposition and environmentally safe.34 Further, the density of nanorods were effectively controlled through number of spray cycles. The influence of density of nanorods on hydrogen sulfide sensing properties were also discussed. Moreover the growth mechanism of the ZnO nanorods has been analyzed.
2. Experimental
ZnO nanorods were successfully grown without any template or catalyst on glass substrates by simple chemical spray pyrolysis technique (HOLMARC, HO-TH-04, India). Firstly, glass substrates were washed with detergent, then ultrasonically cleaned with acetone, isopropanol and deionized water for 15 min each. The substrates were dried in vacuum oven for 30 min to avoid contaminants. The precursor solution was prepared by mixing 0.1 M concentration of anhydrous zinc chloride (ZnCl2, Merck, purity 99%) in 50 mL of deionized water (Millipore, USA) and the precursor solution was loaded into spray reservoir. While spraying the solution on glass substrates, pressurized air was used as a carrier gas. For uniform coating, spray nozzle was attached with X and Y axes stepper motor to move throughout the substrate area. The substrate to nozzle distance was kept at 15 cm. The substrate temperature, solution flow rate and spray area per min were fixed as 500 °C, 2 mL min−1 and 15 cm2 respectively. The substrates were kept at desired temperature using conventional hot plate and controlled using PID controller and K-type thermocouple. In order to control the density of growth of nanorods, the nucleation and growth cycles were optimized. The optimum spray timings were 60 s for spray time and 45 s for growth time. Four batches of samples were prepared by varying the number of spray cycles such as 5, 10, 15 and 20 and represented as NR 1, NR 2, NR 3 and NR 4 respectively.
The structural properties were investigated using X-ray Diffractometer (D8 Focus, Bruker, Germany) and X-ray Photoelectron Spectroscopy (XPS) (Thermo Fisher Scientific Inc., K Alpha, USA). Morphological properties were studied using Field Emission Scanning Electron Microscope (FE-SEM) (JEOL, 6701F, Japan) respectively. Elemental composition was analyzed using Energy Dispersive X-ray Spectroscopy (EDS) along with FE-SEM system. The optical properties of the thin films were studied using UV-Vis spectrophotometer (Perkin-Elmer, Lambda 25, USA) in the wavelength range of 200 to 800 nm with a scan rate of 50 nm min−1. Electrical and sensing properties were carried out using an electrometer (Keithley, 6517A, USA).
Sensing measurements were carried out using home built gas/vapour sensing system.35,36 The testing chamber consists of a glass chamber of 5 L capacity with septum provision to inject desired concentration of target vapours using micro syringe and an exhaust to evacuate target vapours after the sensing measurements. The sensing element was first stabilized in air and fixed the observed value as a baseline resistance. After attaining stable baseline resistance, the sensing element was exposed to various concentrations of target vapours. The process of achieving desired concentration37 of target vapour inside the testing chamber was attained using eqn (1),
| |
 | (1) |
where,
δ is the density of hydrogen sulfide (g cm
−3),
Vr is the volume of hydrogen sulfide injected (μL),
R is the universal gas constant (J mol
−1 K
−1),
T is the absolute temperature (K),
M is the molecular weight (g mol
−1),
Pb is the pressure inside the chamber (Pa) and
Vb is the volume of the chamber (L). The sensor response (
S) was calculated using the relation (
eqn (2)),
| |
 | (2) |
where,
Ra and
Rg are the resistance of the sensing element in air and target gas respectively. The test gases/chemicals used in this work are ammonia (Merck, 25%), acetone (Merck, 99.5%), ethanol (Jiangsu Huaxi International Trade Co. Ltd, 99.9%), hydrogen sulfide (Sigma-Aldrich), methanol (Fisher Scientific, 99.5%), toluene (Merck, 99%), acetaldehyde (acetaldehyde, 35%), dimethylsulfide (Sigma-Aldrich, 99%).
3. Results and discussion
3.1 Structural and optical studies
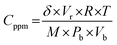
Fig. 1 shows the XRD patterns of ZnO nanorods deposited at different spray cycles. A weak intensity peak was observed at 35.18° which corresponds to (002) crystal plane for the samples deposited with 5 spray cycles. As spray cycles increased from 5 to 20, uniform growth of crystallites along (002) plane was observed, which indicated the growth of nanorods perpendicular to the substrate. The observed peak positions are in good agreement with the JCPDS card no. 36-1451. Chemical states of the ZnO nanorods (NR 4) were investigated using XPS. XPS survey spectra are shown in Fig. 2a and it confirmed the presence of Zn and O elements. The weak C peak around 286 eV is due to the exposure of thin film to ambient prior to measurement. Peaks at 10.7, 89.8, 139.8 and 1196.4 eV attributed to 3d, 3p, 3s and 2s core levels of Zn respectively. Narrow scan spectrum of Zn and oxygen is shown in Fig. 2b and c. In ZnO, peaks located at 1021.48 and 1044.58 eV can be assigned to Zn 2p3/2 and Zn 2p1/2 respectively. The difference between the two peaks is 23.1 eV, which supported the binding energy of Zn2+ bound with O in ZnO. The sharp peak at 1021.48 eV confirmed that Zn species present in the film are completely in oxidized state.34,38,39 O 1s core level peak was fitted (Fig. 2c) with two sub peaks such as 530.07 and 531.48 eV. These two peaks corresponds to O2− in the ZnO wurtzite crystal structure and adsorbed species of C–O bond respectively.38 The strong peak located at 531.18 eV ascribed to Zn–OH bonding in ZnO.40 The effect of spray cycle on the optical properties was also investigated and the absorbance spectra is shown in Fig. 3. The absorbance spectra indicated the increase in absorbance with an increase in number of spray cycles and a maximum absorption was observed for NR 4 sample. It may be due to the high volume filling factor of nanorods which might have enhanced the multiple internal reflection in-turn lead to increased absorption.37,41 Band gap of the ZnO nanorods estimated using Tauc's plot was decreased from 3.23, 3.20, 3.17 and 3.10 eV for 5, 10, 15 and 20 spray cycles respectively. The decrease in band gap may be due to the increased donor carrier concentration at the bottom of the conduction band42 as a result of the formation of dense/thick film as spray cycles increased from 5 to 20. The increase in conductivity of the films with spray cycles has confirmed the increase in carrier concentration.
 |
| | Fig. 1 XRD patterns of ZnO nanorods deposited at different spray cycles. | |
 |
| | Fig. 2 (a) XPS survey spectra, (b) narrow scan spectra of ZnO and (c) narrow scan spectra of O of NR 3 sample. | |
 |
| | Fig. 3 Optical absorbance spectra of ZnO nanorods. | |
3.2 Morphological studies
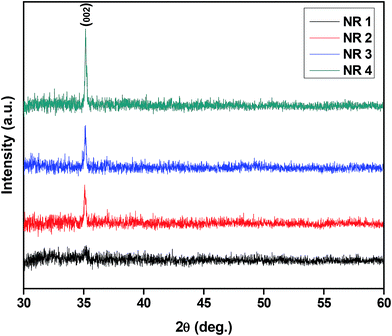
Fig. 4a–h shows the low and high magnification scanning electron micrographs of ZnO nanorods deposited at different spray cycles. At the initial stage of deposition (NR 1), large number of ZnO nuclei with the size ranging from 50–100 nm was formed on the glass substrates (Fig. 4a and e). Subsequently, these tiny ZnO crystallites begun to grow through coalescence process. This layer acted as an initial sites for the growth of nanorods. At the second stage (NR 2), shorter nanorods (Fig. 4b and f) were appeared in addition to nanograins. When the spray cycles increased further ((Fig. 4c and g) & (d and h)), many nanorods were simultaneously grown and resulted in the formation of large number of nanorods with the diameter ranging from 200–250 nm. During 15 spray cycle deposition, nanorods were grown with lots of free space between them due to limited availability of nutrients for the growth (lower density nanorods). Compared with the nanorods grown at 15 spray cycles, a major change in the surface distribution of nanorods was observed for 20 spray cycles. Higher spray cycles increased the surface distribution density of nanorods in-turn caused closely packed nanorods (higher density nanorods).
 |
| | Fig. 4 Low magnification FE-SEM images of ZnO nanorods (a) NR 1, (b) NR 2, (c) NR 3 and (d) NR 4. High magnification FE-SEM images of ZnO nanorods (e) NR 1, (f) NR 2, (g) NR 3 and (h) NR 4. | |
3.3 Proposed growth mechanism
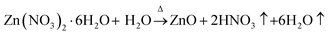
Formation of ZnO thin film from anhydrous zinc chloride (ZnCl2) is quite different from zinc acetate dihydrate (Zn(CH3COO)2·2H2O) and zinc nitrate hexahydrate (Zn(NO3)2·6H2O) precursors. In order to explore the uniqueness of ZnCl2 precursor, ZnO thin films were deposited with a set of optimized deposition parameters using zinc acetate dihydrate, zinc nitrate hexahydrate and anhydrous zinc chloride precursor salts. The FE-SEM images of the 15 spray cycles deposited films are shown in Fig. 5a–c. It is clear that films prepared using zinc acetate and nitrate precursor possessed spherical shaped morphology with slight change in size and shape. At the same time, film prepared using zinc chloride depicts nanorod morphology with hexagonal facets. The possible growth mechanism of ZnO from zinc acetate, nitrate and chloride is as follows,| |
 | (3) |
| |
 | (4) |
| |
 | (5) |
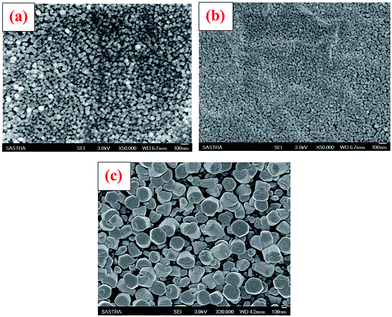 |
| | Fig. 5 Thin films deposited using (a) zinc acetate, (b) zinc nitrate and zinc chloride as a precursor salts. | |
Further, ZnO formation from zinc chloride precursor required high deposition temperature than zinc acetate and nitrate precursors. It may be due to the bond length between two OH groups which require high amount of thermal energy to approach one another to form a compound.
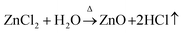
Based on the discussion from structural, morphological and optical properties, the plausible growth process of vertically aligned ZnO nanorods has been proposed and is illustrated in Fig. 6. It is well known fact that ZnCl2 is highly soluble in water. When ZnCl2 is dissolved in water at room temperature, it exists in the form of Zn(H2O)6(solution)++ and ZnCl4(H2O)2(solution)− instead of Zn2+ and Cl− in aqueous solution which was confirmed by Irish et al. through Raman investigations.43 Therefore the formation of ZnO through direct decomposition of ZnCl2 is very unlikely. Initially spray droplets containing Zn(H2O)6(solution)++ and ZnCl4(H2O)2(solution)− strike the heated substrate, consequently the hydrated ZnCl2(H2O)4 was formed on the substrate. At about 400 °C, complete hydrolysis occurred and gaseous by-product namely HCl was released due to more number of Cl2 ions than Zn in the hydrated ZnCl2.44 Further, the negative charged Cl ions are positioned on each top corner of the positively charged Zn(II) tetrahedron and promoted the formation of nanorods perpendicular to substrate surface.45–47 From these observations, one can confirm that the dehydrochlorination effect could be the main reason for the formation of hexagonal nanorods.
 |
| | Fig. 6 Synthesis scheme for depositing ZnO nanorods of different densities. | |
3.4 Sensing performances
In order to conduct the sensing studies, the baseline resistance of each sensing element was set at ambient atmosphere. The measured baseline resistance values of nanorods prepared at various spray cycles is presented in Fig. 7. At the initial state of deposition, due to the formation of discontinuous islands, poor current flow was observed in-turn showed high resistance. Conductivity greatly increased with the spray cycles due to the formation of uniformly distributed nanorods throughout the surface. The uniform distribution of nanorods might have enhanced the electron transport.
 |
| | Fig. 7 Resistance values with respect to spray cycles. | |
3.4.1. Selectivity. Since selectivity plays a vital role in determining the overall performance of the gas sensor, the same has been determined for the fabricated ZnO nanorod sensor. Towards this study, the sensing performance was observed in the presence of various gases/vapours in multicomponent environment. Fig. 8 shows the sensing responses of the nanorods towards 100 ppm of eight different gases at room temperature. The maximum response was observed for hydrogen sulfide than that of ammonia, acetone, ethanol, methanol, toluene, acetaldehyde and dimethylsulfide. Apparently all the nanorod samples showed similar trend in resistance change when exposed to hydrogen sulfide. Compared with NR 2 and NR 4 samples the response of the NR 3 sample was maximum of 111 towards 100 ppm of hydrogen sulfide. NR 2 and NR 4 samples showed the sensing response of 25 and 90 respectively for the same concentration. Moreover, change in resistance towards other interfering gases was less than 1 order of magnitude. Most importantly the sensing response of lower density nanorods (NR 3) was almost 4 times more than that of NR 2. It confirmed that density of nanorods plays a key role in sensing performance.
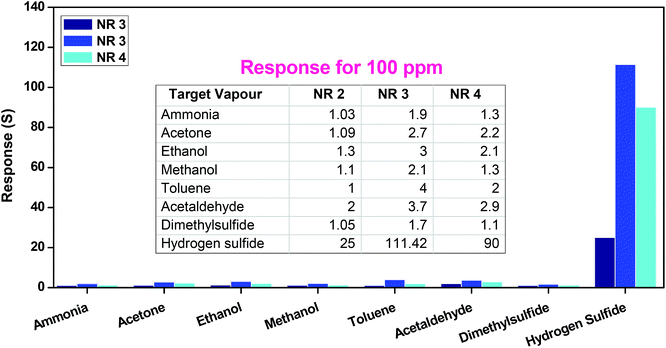 |
| | Fig. 8 Selectivity of the sensing elements toward 8 different vapours. | |
3.4.2. Transient response and recovery studies. The response vs. hydrogen sulfide concentration (5–500 ppm) for all the three structures (initial layer, lower and higher density nanorods) are depicted in Fig. 9a. Fig. S1† enlarged view of sensing response for lower concentrations. Among them, lower density nanorods (NR 3) showed maximum response of 600 for 500 ppm of hydrogen sulfide. Fig. 9b shows the transient resistance response characteristics of the lower density nanorods (NR 3). A sharp fall in the resistance was observed when hydrogen sulfide was injected into the chamber. This indicated the n-type behaviour of the sensing element. Once the film reaches the steady state resistance, the chamber was flushed with fresh air, as a consequence the sensing element recovered to its baseline resistance, which confirmed the good reversible nature of the sensing element. But above 250 ppm, sensing element did not showed complete recovery characteristics. The sensing responses of lower density nanorods were 3.9, 7.8, 10, 14, 17, 111.42, 195 and 600 for 5, 10, 25, 50, 75, 100, 250 and 500 ppm respectively. At the same time the sensing responses of the higher density nanorods were 2.4, 6, 7, 10, 13, 90, 160 and 516 for 5, 10, 25, 50, 75, 100, 250 and 500 ppm respectively. It clearly indicated the dominance of sensing response by NR 3 over NR 4. Fig. 9c shows the linearity fit of sensor response with experimental data. Moreover lower density nanorods (NR 3) showed high degree of linearity with the correlation coefficient (R2) of 0.9708 than NR 2 (0.9541) and NR 4 (0.9583).
 |
| | Fig. 9 (a) Response towards various concentrations of hydrogen sulfide, (b) transient resistance response of NR 3 nanorods and (c) linear fit of sensor response with the experimental data. | |
3.4.3. Effect of humidity. Humidity is one of the major influencing factors on the performance of room temperature gas sensors. Usually metal oxide based gas sensors should be operated at elevated operating temperatures to prevent drift due to humidity interference.48,49 Until now, very few sensors has shown negligible humidity effect at room temperature. In this work, the influence of humidity on the response of ZnO nanorods was investigated towards 100 ppm of hydrogen sulfide and the observed results are depicted in Fig. 10a. Constant humidity environment was created inside the testing chamber using saturated aqueous solutions and the percentage of humidity was confirmed through hygrometer (HTC Instruments, HD306, India).35,36 The baseline resistance values were measured in various humid conditions and the values were found to be decreased with increasing humidity levels. This can be attributed to the replacement of adsorbed oxygen ions by hydroxyl ions over the film surface, thereby donating electrons to the conduction band of ZnO.35,50 For the case of lower density nanorods (NR 3) the observed response towards 100 ppm of hydrogen sulfide was 124, 117, 111.7 and 105 for 11, 32, 55 and 76% of relative humidity. The sensing response was decreased with increasing humidity levels, due to reduced number of active sites for interaction. The film stability was found to be good even at higher humidity levels.
 |
| | Fig. 10 (a) Response towards 100 ppm of hydrogen sulfide at various humidity levels and (b) single transient response recovery time characteristics of NR 3 sample towards 5 ppm of hydrogen sulfide. | |
3.4.4. Response and recovery times. By considering the toxicity level of hydrogen sulfide, the available solid state electrolyte, optical, infrared sensors are not fast enough in their response. In this scenario, a rapid detection system with faster response and recovery characteristics is need of the hour. As an effective and efficient solution, chemiresistive based hydrogen sulfide sensor has been developed using ZnO nanorods through spray pyrolysis technique without any template or catalyst. The response and recovery times of the sensor are defined as, the time taken to reach 90% of its steady state value while interacting with specific concentration of target gas and to reach 10% value of its baseline resistance while exhausting the target gas from the chamber.51 The response and recovery time characteristics of lower density nanorods (NR 3) which showed better sensing response are in ESI Fig. S2a and b.† ESI Fig. S2a and b† shows the decreased response and increased recovery times with an increase in the concentration. The observed response times for 5, 10, 25, 50, 75, 100, 250 and 500 ppm concentrations are 50, 44, 38, 30, 27, 23, 20 and 18 s respectively. The observed recovery times for the same concentrations are 20, 26, 30, 47, 53, 64, 75 and 81 s respectively. Fig. 10b shows the single transient resistance response curve towards 5 ppm of hydrogen sulfide. From the observed response and recovery characteristics, one can confirm the influence of concentration level of hydrogen sulfide in the response and recovery times. From these observations, it is clear that at lower concentration levels (up to 25 ppm) the response time is very high than recovery time. At higher concentration levels (above 25 ppm) the response time is very low than recovery time. This trend can be ascribed as, at lower concentration levels due to less number of target molecules the interactions between the target molecules and film surface might have been poor in-turn resulted in longer response time. At the same time, parallel reduction in target molecules due to redox reaction might have lead to faster recovery time.
3.4.5. Sensing mechanism. When metal oxides exposed to ambient atmosphere, the atmospheric oxygen molecules adsorbed onto the surface by trapping conduction band electrons in-turn increase the width of the space charge region and hence the surface resistance.52 The nature of adsorbed oxygen ions on metal oxide surface is temperature dependent process. They present as molecular oxygen ions below 100 °C and atomic oxygen ions between 100 °C to 300 °C.50,53 For room temperature, oxygen adsorption can be expressed as follows (eqn (6)):| | |
O2(atmosphere) + e(ZnO surface)− → O2(ZnO surface)−
| (6) |
Hence, oxygen–ZnO surface interaction set the baseline resistance. When the sensing element exposed to reducing gases such as hydrogen sulfide, it may undergo the following reaction (eqn (7)),| | |
2H2S + 3O2− → ↑2H2O + 2SO2↑ + 3e−
| (7) |
The interaction between target gas and ionosorbed oxygen on ZnO surface releases free electrons which lead to decrease in resistance with reference to baseline. Once the steady state is reached, the sensing element is again exposed to air atmosphere resulted in desorption process. During the desorption process, the probable dissociative species released were H2O and SO2. The observed selectivity of the sensing element towards hydrogen sulfide may be due to the smaller bond energy of S–SH in H2S and it can be easily broken to participate in the reaction. ZnO is being a desulfurization agent, it is used to remove hydrogen sulfide from fuel and gas streamlines. This process provides the unique identification for ZnO as a hydrogen sulfide sensor. The high selectivity towards hydrogen sulfide could also be ascribed due to the exothermic reaction between ZnO and H2S which has been substantiated by the negative reaction enthalpy. Due to the exothermic energy, the spontaneous reaction might have occurred in-turn lead to higher sensitivity towards hydrogen sulfide.11,54
The sensing mechanism has been schematically demonstrated by considering three different nanostructures (Fig. 11). This schematic clearly demonstrates the enhanced response of lower density nanorods due to the availability of more number of active sites than that of other nanostructures. On the other hand, closely packed nanorods in higher density case limits the oxygen adsorption and hence active sites in-turn resulted in the reduced response. At the same time, lowest detection limit was found to be 5 ppm for all the three nanostructures (NR 2, NR 3 & NR 4). This might be emphasized due to the percolation threshold. The percolation threshold follows the on/off switching pattern based on the presence and absence of interaction gases. The same trend has been reflected in observing the sensor response at lower and higher concentration of target gases. In specific, below 75 ppm the absence of complete percolation path resulted in the gradual increase in sensing response, but rapid response was observed above 75 ppm due to established percolation path.55,56
 |
| | Fig. 11 Schematic illustration of three different nanostructures. | |
Furthermore when the sensing element was exposed to higher concentration levels (above 250 ppm), baseline drift was observed during the desorption process. This drift was probably due to the surface reaction of hydrogen sulfide with ZnO to form ZnS. To confirm this, EDS spectra was taken before and after exposure to 500 ppm of hydrogen sulfide. It confirmed the presence of S element in the 500 ppm hydrogen sulfide exposed film (Fig. 12). At higher concentration levels, the possible reaction between ZnO and hydrogen sulfide as follows (eqn (8)):
| | |
ZnO + H2S → ZnS + H2O
| (8) |
 |
| | Fig. 12 EDS spectra of NR 3 sample before and after exposure. | |
Comparison of observed sensing response of lower density nanorods (NR 3) with the literature is given ESI Table S1.† This table highlights the superior hydrogen sulfide sensing properties of ZnO nanorods in terms of lower operating temperature, lowest detection limit, significant selectivity and higher sensitivity.
3.4.6. Stability. Stability is a key parameter and it must be taken into account while designing solid state gas sensors. Hence, stability of the dominant sensing element among all the nanostructures was investigated and its response towards 50 ppm of hydrogen sulfide is shown in Fig. 13. The results indicated the absence of drift at the operating conditions over a period of 30 days. The same test was conducted for six months. And the results confirmed the stability of NR 3 structure. Also the reproducible nature of the sensing element was confirmed with the optimized deposition parameters.
 |
| | Fig. 13 Long term stability over a period of 30 days for NR 3 sample. | |
4. Conclusion
A facile approach was developed to grow ZnO nanorods on glass substrates with various densities using spray pyrolysis technique. Unlike other traditional deposition methods, no template or catalyst was used to grow ZnO nanorods. The density of nanorods was modulated through number of spray cycle was found to be a novel solution to obtain desired response towards the target gas. The lower density nanorods showed improved sensing response towards hydrogen sulfide possibly due to more number of active sites for gas–solid interaction. Compared with other hydrogen sulfide sensors reported so far, the highest sensitivity with faster and response recovery times was achieved. This work would attract theoreticians to explore the possibility of a novel grain density and boundary mechanism for gas–solid interaction.
Acknowledgements
The authors wish to express their sincere thanks to the Department of Science & Technology, New Delhi, India for the financial support (Project ID: INT/SWD/VINN/P-04/2011 & SR/FST/ETI- 284/2011(C)). They also wish to acknowledge SASTRA University, Thanjavur for extending infrastructure support to carry out this work.
References
- M. Whiteman, S. L. E. Trionnaire, M. Chopra, B. Fox and J. Whatmore, Clin. Sci., 2011, 121, 459–488 CrossRef CAS PubMed.
- M. Bhatia, IUBMB Life, 2005, 57, 603–606 CrossRef CAS PubMed.
- C. A. Wagner, J. Nephrol., 2009, 22, 173–176 CAS.
- W. Guo, Z.-Y. Cheng and Y.-Z. Zhu, Acta Pharmacol. Sin., 2013, 34, 1284–1291 CrossRef CAS PubMed.
- H.-S. Woo, C.-H. Kwak, I.-D. Kim and J.-H. Lee, J. Mater. Chem. A, 2014, 2, 6412–6418 CAS.
- A. Vosoughi, F. Yazdian, G. Amoabediny and M. Hakim, Biosens. Bioelectron., 2015, 70, 106–114 CrossRef CAS PubMed.
- F. H. Green, S. Schurch, G. T. De Sanctis, J. A. Wallace, S. Cheng and M. Prior, J. Appl. Physiol., 1991, 70, 1943–1949 CAS.
- A. H. Reshak and S. Auluck, J. Appl. Phys., 2014, 116, 103702 CrossRef PubMed.
- J.-W. Yoon, Y. J. Hong, Y. Chan Kang and J.-H. Lee, RSC Adv., 2014, 4, 16067–16074 RSC.
- C. Hwang, G. Ruan, L. Wang, H. Zheng, E. L. G. Samuel, C. Xiang, W. Lu, W. Kasper, K. Huang, Z. Peng, Z. Schaefer, A. T. Kan, A. A. Mart, M. S. Wong, M. B. Tomson and J. M. Tour, ACS Appl. Mater. Interfaces, 2014, 6, 7652–7658 CAS.
- G. Qi, L. Zhang and Z. Yuan, Phys. Chem. Chem. Phys., 2014, 16, 13434–13439 RSC.
- S. Vallejos, T. Stoycheva, F. E. Annanouch, E. Llobet, P. Umek, E. Figueras, C. Canè, I. Gràcia and C. Blackman, RSC Adv., 2014, 4, 1489–1495 RSC.
- S.-J. Choi, M. P. Kim, S.-J. Lee, B. J. Kim and I.-D. Kim, Nanoscale, 2014, 6, 11898–11903 RSC.
- X. Liu, C. Gong and X. Jiang, J. Appl. Microbiol., 2011, 111, 83–92 CrossRef CAS PubMed.
- D. J. Nicol, M. K. Shaw and D. A. Ledward, Appl. Microbiol., 1970, 19, 937–939 CAS.
- E. Westenbrink, R. P. Arasaradnam, N. O'Connell, C. Bailey, C. Nwokolo, K. D. Bardhan and J. A. Covington, Biosens. Bioelectron., 2015, 67, 733–738 CrossRef CAS PubMed.
- S. K. Pandey, K. H. Kim and K. T. Tang, TrAC, Trends Anal. Chem., 2012, 32, 87–99 CrossRef CAS PubMed.
- P. Shankar and J. B. B. Rayappan, ScienceJet, 2015, 4, 126 Search PubMed.
- E. Comini, C. Baratto, I. Concina, G. Faglia, M. Falasconi, M. Ferroni, V. Galstyan, E. Gobbi, A. Ponzoni, A. Vomiero, D. Zappa, V. Sberveglieri and G. Sberveglieri, Sens. Actuators, B, 2013, 179, 3–20 CrossRef CAS PubMed.
- J. Xu, X. Wang and J. Shen, Sens. Actuators, B, 2006, 115, 642–646 CrossRef CAS PubMed.
- W. Yuanda, T. Maosong, H. Xiuli, Z. Yushu and D. Guorui, Sens. Actuators, 2001, 79, 187–191 CrossRef CAS.
- V. Balouria, A. Kumar, A. Singh, S. Samanta, A. K. Debnath, A. Mahajan, R. K. Bedi, D. K. Aswal, S. K. Gupta and J. V. Yakhmi, Sens. Actuators, B, 2011, 157, 466–472 CrossRef CAS PubMed.
- a. B. Bodade, A. M. Bende and G. N. Chaudhari, Vacuum, 2008, 82, 588–593 CrossRef CAS PubMed.
- N. Datta, N. Ramgir, M. Kaur, M. Roy, R. Bhatt, S. Kailasaganapathi, A. K. Debnath, D. K. Aswal and S. K. Gupta, Mater. Chem. Phys., 2012, 134, 851–857 CrossRef CAS PubMed.
- E. Comini, C. Baratto, G. Faglia, M. Ferroni, a. Vomiero and G. Sberveglieri, Prog. Mater. Sci., 2009, 54, 1–67 CrossRef CAS PubMed.
- J. Huang and Q. Wan, Sensors, 2009, 9, 9903–9924 CrossRef PubMed.
- N. Zhang, K. Yu, Q. Li, Z. Q. Zhu and Q. Wan, J. Appl. Phys., 2008, 103, 104305 CrossRef PubMed.
- L. Liao, H. B. Lu, J. C. Li, C. Liu, D. J. Fu and Y. L. Liu, Appl. Phys. Lett., 2007, 91, 14–17 Search PubMed.
- Z. S. Hosseini, A. I. Zad and A. Mortezaali, Sens. Actuators, B, 2015, 207, 865–871 CrossRef CAS PubMed.
- J. Kim, W. Kim and K. Yong, J. Phys. Chem. C, 2012, 116, 15682–15691 CAS.
- L. Xu, R. Zheng, S. Liu, J. Song, J. Chen, B. Dong and H. Song, Inorg. Chem., 2012, 51, 7733–7740 CrossRef CAS PubMed.
- H. Ren, Y. Ding, Y. Jiang, F. Xu, Z. Long and P. Zhang, J. Sol-Gel Sci. Technol., 2009, 52, 287–290 CrossRef CAS PubMed.
- N. S. Ramgir, P. K. Sharma, N. Datta, M. Kaur, A. K. Debnath, D. K. Aswal and S. K. Gupta, Sens. Actuators, B, 2013, 186, 718–726 CrossRef CAS PubMed.
- G. K. Mani and J. B. B. Rayappan, Mater. Sci. Eng., B, 2015, 191, 41–50 CrossRef CAS PubMed.
- G. K. Mani and J. B. B. Rayappan, Sens. Actuators, B, 2014, 198, 125–133 CrossRef CAS PubMed.
- G. K. Mani and J. B. B. Rayappan, Sens. Actuators, B, 2013, 183, 459–466 CrossRef CAS PubMed.
- G. K. Mani and J. B. B. Rayappan, RSC Adv., 2014, 4, 64075–64084 RSC.
- Y. Lv, L. Yu, H. Huang, Y. Feng, D. Chen and X. Xie, Nanotechnology, 2012, 23, 065402 CrossRef PubMed.
- V. Gandhi, R. Ganesan, H. Hameed, A. Syedahamed and M. Thaiyan, J. Phys. Chem. C, 2014, 118, 9715–9725 CAS.
- R. Al-Gaashani, S. Radiman, A. R. Daud, N. Tabet and Y. Al-Douri, Ceram. Int., 2013, 39, 2283–2292 CrossRef CAS PubMed.
- X. Sun, Q. Li, J. Jiang and Y. Mao, Nanoscale, 2014, 6, 8769–8780 RSC.
- K. Sivalingam, P. Shankar, G. K. Mani and J. B. B. Rayappan, Mater. Lett., 2014, 134, 47–50 CrossRef CAS PubMed.
- D. E. Irish, B. McCarroll and T. F. Young, J. Chem. Phys., 1963, 39, 3436–3644 CrossRef CAS PubMed.
- R. R. Thankalekshmi and A. C. Rastogi, J. Appl. Phys., 2012, 112, 063708 CrossRef PubMed.
- Á. Smith and R. Rodriguez-clemente, Thin Solid Films, 1999, 345, 192–196 CrossRef.
- E. Dien, J. M. Laurent and A. Smith, J. Eur. Ceram. Soc., 1999, 19, 787–789 CrossRef CAS.
- A. Smith, J. Laurent, D. S. Smith, J. Bonnet and R. Rodriguez, Thin Solid Films, 1995, 266, 20–30 CrossRef CAS.
- C. Wang, L. Yin, L. Zhang, D. Xiang and R. Gao, Sensors, 2010, 10, 2088–2106 CrossRef CAS PubMed.
- R. Pandeeswari and B. G. Jeyaprakash, Sens. Actuators, B, 2014, 195, 206–214 CrossRef CAS PubMed.
- N. Barsan and U. Weimar, J. Electroceram., 2001, 7, 143–167 CrossRef CAS.
- P. Dhivya, A. K. Prasad and M. Sridharan, J. Solid State Chem., 2014, 214, 24–29 CrossRef CAS PubMed.
- Y.-F. Sun, S.-B. Liu, F.-L. Meng, J.-Y. Liu, Z. Jin, L.-T. Kong and J.-H. Liu, Sensors, 2012, 12, 2610–2631 CrossRef CAS PubMed.
- R. Pandeeswari and B. G. Jeyaprakash, Biosens. Bioelectron., 2014, 53, 182–186 CrossRef CAS PubMed.
- Z. Liu, T. Fan, D. Zhang, X. Gong and J. Xu, Sens. Actuators, B, 2009, 136, 499–509 CrossRef CAS PubMed.
- M. Ulrich, A. Bunde and C. D. Kohl, Appl. Phys. Lett., 2004, 85, 242–244 CrossRef CAS PubMed.
- M. Ulrich, C. D. Kohl and A. Bunde, Thin Solid Films, 2001, 391, 299–302 CrossRef CAS.
Footnote |
| † Electronic supplementary information (ESI) available. See DOI: 10.1039/c5ra07804k |
|
| This journal is © The Royal Society of Chemistry 2015 |
Click here to see how this site uses Cookies. View our privacy policy here. 
 and
John Bosco Balaguru Rayappan*
and
John Bosco Balaguru Rayappan*


