Growth of nano Ag@AgCl on (111) facets of Cu2O microcrystals with an enhanced photocatalytic activity
Li Liu,
Shuanglong Lin,
Jinshan Hu,
Yinghua Liang* and
Wenquan Cui*
College of Chemical Engineering, North China University of Science and Technology, Tangshan, 063009, P. R. China. E-mail: liangyh@heuu.edu.cn; wkcui@163.com; Tel: +86 315 2592014 Tel: +86 315 2592169
First published on 8th July 2015
Abstract
Single crystalline Cu2O nanoparticles were synthesized under mild conditions. A Ag@AgCl/Cu2O photocatalyst was prepared by directly growing Ag@AgCl nanoparticles (NPs) on (111) facets of octahedral Cu2O via a facile precipitation in situ photoreduction method. The results indicate that Ag@AgCl nanoparticles have a narrow size distribution ranging from 10 to 50 nm and are uniformly distributed on the surface of Cu2O nanoparticles. The surface area of the composite reached up to 19.736 m2 g−1. The photocatalytic performance of the Ag@AgCl/Cu2O composite for the degradation of methylene blue (MB) was evaluated under visible light irradiation. The Ag@AgCl/Cu2O composite with 30 wt% Ag@AgCl showed the highest photocatalytic activity, degrading 93.61% MB after 2 h irradiation. The high photocatalytic activity of the Ag@AgCl/Cu2O composite can be attributed to its high surface area, the crystal effect of Cu2O and the surface plasmon resonance of the Ag NPs. In addition, the Ag@AgCl/Cu2O composite can be used as a photocatalyst for the degradation of phenol. Based on these experimental results, a photocatalytic mechanism for the degradation of hazardous chemical effluents over Ag@AgCl/Cu2O photocatalysts was proposed. The free radicals and holes act as the main reactive species during the degradation.
1. Introduction
The need for the degradation of organic pollutants is continuously growing, especially for wastewater containing phenol and organic dyes which are the most hazardous to human health.1 Semiconductor–metal composite photocatalysts have been considered to be a potentially promising approach to accelerate effluent treatment due to their surface plasmon resonance.2–4 A plasmonic photocatalyst usually contains a metal oxide semiconductor and a plasmonic metal nanostructure that is used as a sensitizer.5–13 Metal nanoparticles (NPs) deposited on semiconductor nanocrystals can promote interfacial charge-transfer via the trapping of photoinduced charge carriers and enhance light absorption in semiconductor ingredients,14–16 which subsequently improves the photocatalytic activity and light-harvesting efficiency of semiconductors.17,18 A recent report19 has shown that a plasmonic sensitizer can harvest and transfer solar energy to the semiconductor at the energies above and below the band edge through resonant energy transfer, which induces charge separation and leads to enhanced photocatalytic activity in a broad wavelength range. The performance of a semiconductor–metal composite material is significantly affected by the interaction between the semiconductor and the metal, which is determined by their interfacial structures. Therefore, understanding and manipulating semiconductor/metal interfacial structures are critical for accessing the desired properties of composite materials.Cuprous oxide (Cu2O) is a typical p-type direct band gap semiconductor oxide with a Eg of 2.0–2.4 eV, depending on the nanoparticle size.20,21 It can be potentially applied in solar energy conversion,22 electrode materials,23 sensors,24 and catalysis.25,26 The high intensity photoexcitation can improve the coherent propagation of Cu2O excitons through the Cu2O solid owing to a high exciton binding energy of 150 meV.27 Therefore, it can be anticipated that single Cu2O nanocrystals have spatially confined excitons and high photocatalytic activity. In the present work, Ag@AgCl was directly grown on the (111) facets of single crystalline octahedral Cu2O microcrystals at room temperature. The coverage of Ag@AgCl NPs on the (111) facets and other surfaces of Cu2O microcrystals can be conveniently controlled by tuning the concentration of the silver precursor. The Ag@AgCl/Cu2O composite was characterized using X-ray diffraction (XRD), scanning electron microscopy (SEM), transmission electron microscopy (TEM), energy dispersive X-ray spectroscopy (EDX), ultraviolet-visible diffuse reflectance spectroscopy (UV-Vis), nitrogen sorption and photoelectrochemical measurement. The results indicate that Ag@AgCl nanoparticles deposited on the (111) planes of octahedral Cu2O microcrystals can improve the electron-transfer process between the electrode surface and Cu2O crystals. Its high photocatalytic activities for the degradation of organic dye and phenol pollutants were demonstrated. The degradation mechanism of the Ag@AgCl/Cu2O photocatalyst for the organic pollutants was explored.
2. Experimental
2.1. Synthesis of photocatalysts
2.2. Characterization of the photocatalysts
The crystal structures and phases of the prepared samples were determined using X-ray diffraction (XRD) using a Rigaku D/MAX2500 PC diffractometer with Cu Kα radiation, with an operating voltage of 40 kV and an operating current of 100 mA. The morphologies of the samples were imaged using scanning electron microscopy (SEM) (s-4800, Hitachi), energy dispersive X-ray spectroscopy (EDX) and transmission electron microscopy (TEM) (JEM-2010, JEOL Ltd.). UV-visible light (UV-Vis) diffuse reflectance spectra were recorded on a UV-Vis spectrometer (UV1901, Puxi). A Quantachrome Nova 4200e automatic analyzer (Vendor, USA) was used to determine the surface area of the photocatalyst using N2 adsorption/desorption isotherms based on the Brunauer–Emmett–Teller (BET) method. The photoluminescence of the powdered sample was measured on a spectrofluorometer (f7000, Hitachi). Electrochemical and photoelectrochemical analyses were performed in a constructed three-electrode quartz cell system. A Pt sheet was used as the counter electrode and a Hg/Hg2Cl2/sat. KCl electrode was used as the reference electrode. A thin Ag@AgCl/Cu2O film on indium–tin oxide (ITO) was used as the working electrode. The photoelectrochemical signals were recorded with a CHI 660B electrochemical system.2.3. Photocatalytic activity
The photocatalytic activity of the Ag@AgCl/Cu2O composites for the degradation of MB was evaluated under the irradiation of visible light. An unsealed glass beaker with a 250 W 420 nm cutoff halide lamp (Philips) located 10 cm away was used for the first test group. A glass reactor with 25 ± 2 °C circulating water was employed for the second test group. For each test, 0.1 g of Ag@AgCl/Cu2O powder was added into a 100 mL MB solution (10 mg L−1) and stirred for 30 min. A 3 mL reaction suspension sample was taken every 15 minutes during the irradiation, centrifuged at 10![[thin space (1/6-em)]](https://www.rsc.org/images/entities/char_2009.gif) 000 rpm for 6 min. The supernatant was collected and analyzed with a UV-Vis spectrophotometer. The degradation efficiency (%) was calculated as follows:
000 rpm for 6 min. The supernatant was collected and analyzed with a UV-Vis spectrophotometer. The degradation efficiency (%) was calculated as follows:where C0 is the initial concentration of MB and C is the MB concentration at time t. The photocatalytic degradation of MB in the presence of the photocatalyst in the dark and the degradation in the absence of the photocatalyst under visible-light irradiation were also evaluated as controls. The same degradation experiments were also conducted for phenol.
3. Results and discussion
3.1. Characterization of catalysts
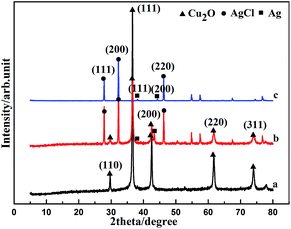
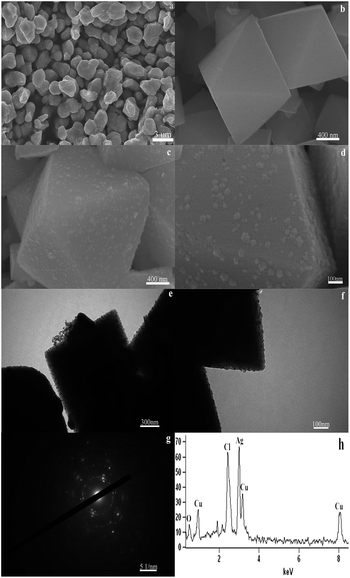
Fig. 1 shows the XRD patterns of Cu2O, Ag@AgCl/Cu2O and Ag@AgCl. It can be seen that the Ag@AgCl/Cu2O composite exhibited the diffraction peaks of Cu2O, Ag and AgCl, indicating the formation of Ag@AgCl NPs.28 The diffraction peaks of Ag@AgCl/Cu2O at 29.63°, 36.50°, 42.40°, 61.52° and 73.70° can be assigned to the (110), (111), (200), (220) and (311) crystal planes of the pure cubic Cu2O (JCPDS card# 65-3288), respectively. The diffraction peaks at 27.83°, 32.24° and 46.23° are ascribed to the (111), (200) and (220) crystal planes of the cubic phase AgCl(JCPDS card# 31-1238), respectively. The (111) and (200) planes of metallic Ag were observed at 38.12°and 44.28° (JCPDS file: 04-0738).29 These results suggest that the Ag@AgCl is successfully grown on the surface of Cu2O. In addition, the (111) diffraction peak of the Cu2O crystal is much stronger than the other diffraction peaks, indicating that the (111) plane of the cubic Cu2O crystal is exclusively exposed.30 However, the (111) diffraction peak intensity of Cu2O is significantly lower than that of Ag@AgCl/Cu2O, further suggesting that the Ag@AgCl is successfully deposited on the surface of Cu2O.The morphology, crystal form and composition of the products were determined using SEM, TEM, SAED and EDX, respectively. Ag@AgCl is composed of irregular 0.5–2 μm spherical particles (Fig. 2a). Cu2O exhibits a uniform octahedral microstructure with a smooth surface and an edge length of 0.8–1.2 μm (Fig. 2b). Fig. 2c and d show the Ag@AgCl particles grown on the Cu2O microcrystals. It is clear that the octahedron crystal is enclosed completely by (111) planes and small particles (10–50 nm) are deposited on the (111) surfaces. The TEM analysis further confirmed the 5–20 nm nanoparticles on the (111) surfaces (Fig. 2e and f). Polycrystalline diffraction rings were observed in the SAED image of Ag@AgCl/Cu2O (Fig. 2g). The brightest central spot in the SAED image was blocked to get a better contrast. The EDX analysis indicates that the particles on the Cu2O surface are AgCl and Ag metal (Fig. 2h).
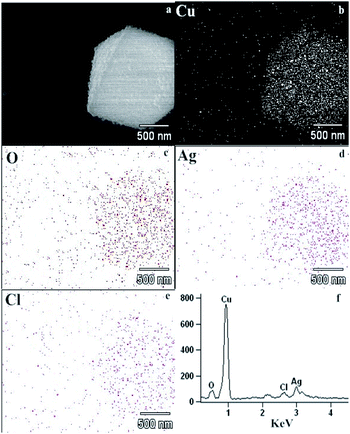
To further identify the presence of Ag@AgCl on the surface of the octahedral Cu2O microcrystals, the elemental distribution of the Ag@AgCl/Cu2O composite was examined using energy dispersive X-ray (EDX). The EDX elemental mapping images of a single octahedral composite demonstrate the uniform distribution of Ag and AgCl particles on the single Ag@AgCl/Cu2O crystal (Fig. 3a–f). The EDX spectrum of the Ag@AgCl/Cu2O composite shows that the composite includes only 4 elements, i.e. Cu, Cl, Ag and O (Fig. 3f). In all, the Ag@AgCl nanocrystals were successfully grown on the surfaces of Cu2O, which formed a unique hierarchical nanostructure and resulted in a high surface area and a large number of interfaces between the Ag@AgCl and Cu2O species. The high surface area and the large number of interfaces accessible to the outer environment provide more photocatalytic active sites for the degradation of organic dyes.
The UV-Vis diffuse reflectance spectra (DRS) of Cu2O, Ag@AgCl and Ag@AgCl/Cu2O with different Ag@AgCl content are shown in Fig. 4. Pure Cu2O has an absorption onset at ∼650 nm, which corresponds to a bandgap of 1.9 eV (ref. 31) (Fig. 4b). It has been reported that the bandgap of Cu2O NPs can be increased to 2.40 eV with smaller size, due to the quantum size effect.32,33 Due to the existence of plasmon resonance of Ag NPs, the Ag@AgCl composite exhibits a broad absorption range from 450 nm to 700 nm. The absorption peaks were also observed in the spectra of the Ag@AgCl/Cu2O composites, which are the typical absorption peaks of surface plasmon resonance. The absorption edge of Ag@AgCl(30 wt%)/Cu2O red-shifted to 700 nm. This suggested that the Ag@AgCl/Cu2O composite could absorb light over a quite broad spectral range in the visible region, which is a prerequisite for the utilization of visible light for photocatalysis. Therefore, good photochemical and photocatalytic activities of Ag@AgCl/Cu2O under visible light irradiation are expected. Ag@AgCl/Cu2O can be used as a photocatalyst under visible light irradiation.34
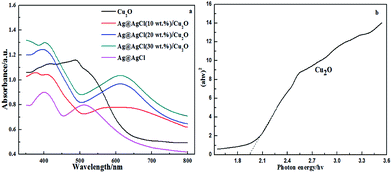 | ||
| Fig. 4 UV-Vis diffuse reflectance spectra of Cu2O, Ag@AgCl and Ag@AgCl/Cu2O composites with various Ag@AgCl content. | ||
3.2. Photocatalytic activity
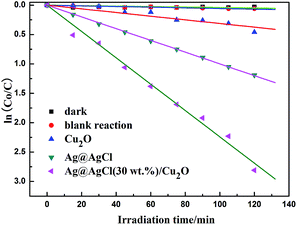
The photocatalytic performances of Cu2O, Ag@AgCl and Ag@AgCl(30 wt%)/Cu2O composite for the degradation of MB aqueous solution were comparatively evaluated under visible light irradiation. The photocatalytic degradation kinetics curve was fitted with the Langmuir–Hinshelwood (L–H) model, which is a well established model for photocatalysis at low dye concentration.35 The equation is shown as follows:where C0/C is the ratio of the dye concentration at adsorption–desorption equilibrium to the dye concentration at an irradiation time of t, and k is the apparent first-order rate constant (min−1). The first-order linear relationships for the catalysts is revealed by the plots of ln(C0/C) vs. irradiation time (Fig. 5). The reaction in the absence of catalyst and the reactions in the dark with various catalysts cannot cause any significant degradation of MB. Meanwhile, 93.61% of MB was degraded in the presence of Ag@AgCl(30 wt%)/Cu2O under the irradiation of visible light for 2 h, which is over 1.3 and 2.6 times that caused by pure Ag@AgCl and pure Cu2O, respectively, under the same conditions. In summary, the plasmon resonance of Ag NPs, the crystal effect of Cu2O and the charge transfer between Ag@AgCl and Cu2O lead to the high photocatalytic activity of Ag@AgCl/Cu2O.
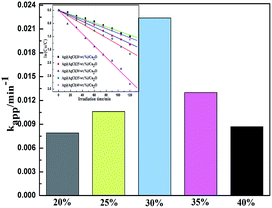
The degradation of MB in the presence of the Ag@AgCl/Cu2O composites with various Ag@AgCl content was also investigated. Their reaction rate constants were obtained by fitting the degradation kinetics curve with the Langmuir–Hinshelwood (L–H) model (Fig. 6). The reaction rate constants of the Ag@AgCl/Cu2O composites with 20 wt%, 25 wt%, 30 wt%, 35 wt% and 40 wt% Ag@AgCl are 0.0079, 0.0106, 0.0224, 0.0130 and 0.0087 min−1, respectively. It is clear that k increases significantly with increasing Ag@AgCl content to 30 wt%. Further increasing the Ag@AgCl content resulted in a decline of the degradation rate. Therefore, the optimum Ag@AgCl content in the Ag@AgCl/Cu2O composite for the highest photocatalytic activity is 30 wt%, indicating that there is a higher transfer of photogenerated charges in the Ag@AgCl(30 wt%)/Cu2O composites. In other words, the deposition of suitable Ag@AgCl nanoparticles on Cu2O may lead to an effective photogenerated charge separation, thereby promoting photocatalytic activity, together with enhanced photochemical activity.
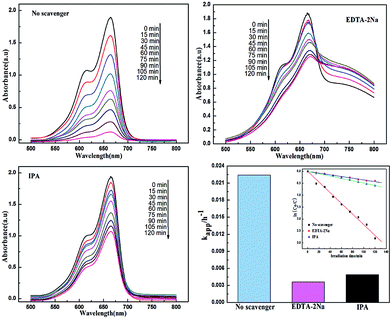
It has been reported that the active species in photocatalytic degradation processes vary with the catalysts used.36 Tert-butyl alcohol (TBA) or isopropyl alcohol (IPA) can be used as a hydroxyl radical (˙OH) scavenger in the photocatalytic process of Ag@AgCl/Cu2O composites37,38 while triethanolamine (TEOA) or ethylenediamine tetraacetic acid disodium (EDTA-2Na) can be used as a hole scavenger.36 In the present work, EDTA-2Na and IPA were used as hole and ˙OH scavengers, respectively. The scavenger (10 mmol L−1) was added to the MB solutions together with the catalyst before the irradiation. As depicted in Fig. 7, the degradation efficiency of MB decreases from 93.61% to 30.59% and 44.96% with the addition of EDTA-2Na and IPA, respectively. Meanwhile, the apparent reaction rate kapp is decreased significantly from 0.0224 min−1 to 0.0036 min−1 and 0.0049 min−1, respectively. These results indicate that a direct hole and radical oxidation reaction dominates the photocatalytic process.
The stability and lifetime of the Ag@AgCl/Cu2O photocatalyst were also tested with Ag@AgCl(30 wt%)/Cu2O as an example (Fig. 8). Its photocatalytic activity only decreased from 94% to 89% after five irradiation cycles. The slight activity decline could be attributed to either washout loss of some catalyst during the recovery steps or to the deposition of reaction products on the catalyst surface.39 Another possible reason is the restoring of the initial disparity of the catalyst particles upon repeated use.40 These results indicate that Ag@AgCl/Cu2O is stable and can be reused. The incorporation of Ag@AgCl on the surface of Cu2O can improve the visible light photocatalytic performance of Cu2O and inhibit the photocorrosion, resulting in a long stable durability of photocatalytic activity.41 In addition, according to Huang et al.,42 during the photocatalytic process, the absorption of visible light by the Ag@AgCl catalyst takes place at the silver NPs, and an absorbed photon would be efficiently separated into an electron and a hole such that the electron is transferred to the surface of the NP farthest away from the Ag/AgCl interface, and the hole to the surface of the AgCl particle bearing the NP. Hole transfer to the AgCl surface corresponds to the oxidation of Cl− ions to Cl0 atoms. As chlorine atoms are reactive radical species, they should be able to oxidize MB dye and hence be reduced to chloride ions again. The stability of the Ag@AgCl photocatalyst under light irradiation arises most likely from the fact that a photon is absorbed by the silver NPs, and an electron separated from an absorbed photon remains in the NPs rather than being transferred to the Ag+ ions of the AgCl lattice. In summary, the plasmonic photocatalyst Ag@AgCl described herein is efficient and stable under visible light.
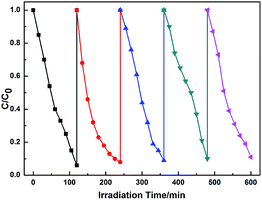 | ||
| Fig. 8 Cycling experiment of the photocatalytic degradation of 10 mg L−1, 100 mL of MB in the presence of 1 g L−1 Ag@AgCl(30 wt%)/Cu2O composite under visible-light irradiation. | ||
The separation efficiency of electrons and holes plays a vital role in the photocatalytic reaction. The electronic interaction between Cu2O and Ag@AgCl was investigated using a photoelectrochemical test in the present work. Fig. 9 is the photocurrent transient responses of the Cu2O and Ag@AgCl/Cu2O electrodes. Both electrodes showed a fast and uniform photocurrent response to each switch-on and switch-off event and their photocurrent transient shapes were similar. The photocurrent decreased back to almost zero when the illumination was terminated. A photocurrent spike was observed when the light was switched on, which could be caused by the recombination of the holes accumulated on the surface and electrons from the Cu2O conduction band.43,44 The photocurrent density on the Cu2O electrodes is 0.10 mA cm−2. Similarly, as the loading of Ag@AgCl nanoparticles increased, the photocurrent density of the Ag@AgCl/Cu2O photoelectrodes increased first and then decreased, which was in good agreement with the results obtained under visible light irradiation. Likewise, the Ag@AgCl(30 wt%)/Cu2O sample possessed the best photoelectrochemical activity (0.18 mA cm−2). The high photocurrent density of Ag@AgCl/Cu2O indicates a high separation efficiency of photo-induced electrons and holes, which contributes to the high photocatalytic activity of the Ag@AgCl/Cu2O composite.
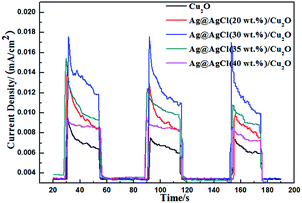 | ||
| Fig. 9 Transient photocurrent responses of Cu2O, Ag@AgCl(20 wt%)/Cu2O, Ag@AgCl(30 wt%)/Cu2O, Ag@AgCl(35 wt%)/Cu2O and Ag@AgCl(40 wt%)/Cu2O composite. | ||
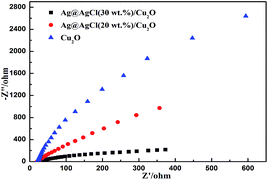
The photogenerated charge separation process on the as-prepared samples was characterized with electrochemical impedance spectroscopy (EIS) measurements.45 The radius of the arc on the EIS Nyquist plot can be used to determine the reaction rate occurring on the electrode. It is clear that the arc radius on the EIS Nyquist plot of Cu2O is the biggest and is decreased with the Ag@AgCl deposited on its surface (Fig. 10), indicating an effective separation of photogenerated electron–hole pairs and a fast interfacial charge transfer between the electron donor and electron acceptor.46
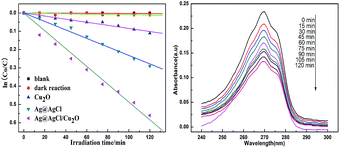
The photocatalytic activity of Ag@AgCl/Cu2O for the degradation of phenol was also investigated under visible light irradiation. A phenol solution (150 mL, 15 mg L−1) was exposed to visible light for 2 h and its UV absorption spectrum was recorded every 15 min (Fig. 11). An absorption peak was observed at 270 nm and its intensity decreased with the increasing of irradiation time. In addition, the absorption of phenol in the visible light region significantly decreases with the increase of irradiation time and nearly disappeared in 2 h. The characteristic absorption peak at 270 nm was employed to determine the concentration of phenol and ln(C0/C) vs. irradiation time was plotted (Fig. 11a). It can be seen that the concentration of phenol in the control kept in the dark remained unchanged for 2 h and phenol molecules exhibited no obvious decomposition in the absence of catalyst, which excludes the possibility of auto-photolysis in the system. Only 10.21% and 24.58% of phenol is decomposed in the presence of Cu2O and Ag@AgCl after irradiation for 120 min. The degradation ratio of phenol was significantly increased to 43.16% in the presence of the Ag@AgCl/Cu2O photocatalyst under visible light irradiation for 120 min. These results indicate that Ag@AgCl/Cu2O photocatalyst can be used for the degradation of phenol pollutant, and the degradation of phenol molecules is attributed to the photocatalytic degradation instead of adsorption.
Based on these findings, a degradation mechanism for MB is proposed, as shown in Fig. 12. The generation and separation of the photoinduced electron–hole pairs are the key factors that influence a semiconductor photocatalytic reaction. The Ag@AgCl on the surface of the Cu2O nanocrystals forms a unique hierarchical nanostructure. The high surface area of the nanostructure and large number of interfaces accessible to its environment result in more active sites for the photocatalytic degradation of organic dyes. The metallic Ag clusters formed in situ on the AgCl semiconductor can enhance its absorption in the visible light region due to the surface plasmon resonance effect. During the initial stage, the MB molecules adsorb onto the surface of Ag@AgCl/Cu2O. Under visible-light irradiation, Cu2O and Ag are excited to produce photogenerated electrons and holes. The CB of Cu2O (−1.4 eV) lies above that of AgCl(−1.15 eV) and Ag. The photogenerated electrons on the CB of Cu2O move to the CB of Ag and then are transferred to AgCl. Meanwhile, the electrons also react with dissolved oxygen molecules and produce ˙O2− to decompose the organic pollutant. The holes of Cu2O react with some OH− or H2O to form hydroxyl radicals (˙OH), which can oxidize organic pollutant molecules. In summary, the coupling of Ag@AgCl and Cu2O extends the absorption range into the visible light region and promotes electron–hole pair separation, leading to a higher photocatalytic activity.
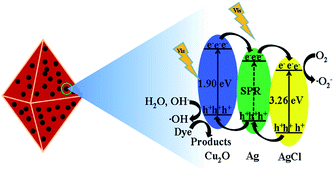 | ||
| Fig. 12 Schematic diagram of the separation and transfer of photogenerated charges in the Ag@AgCl/Cu2O composite under visible light irradiation. | ||
4. Conclusions
Ag@AgCl NP modified Cu2O photocatalysts with varied Ag@AgCl content were successfully prepared and characterized with various analytical techniques. It was used for the first time as a photocatalyst for the rapid degradation of MB and phenol in neutral media under visible light irradiation. As a result, the photocatalytic degradation activity under visible light was greatly improved by Ag@AgCl NP modification. The photocatalytic degradation reaction rate constant was improved from 0.0031 min−1 (pure Cu2O) to 0.0224 min−1 (Ag@AgCl(30 wt%)/Cu2O) with a photoactivity enhancement of up to ∼93.61%. A synergistic photoreduction–oxidation mechanism is proposed for the degradation of organic dye pollutants. The introduction of Ag@AgCl effectively inhibits the recombination of photogenerated electrons and holes, leading to enhanced photocatalytic activity. The Ag@AgCl/Cu2O photocatalyst is a potential catalyst candidate for the treatment of organic wastewater.Acknowledgements
This work was supported by the National Natural Science Foundation of China (grant no. 51202056, 51372068, 21476161), Hebei Provincial Foundation for International cooperation (grant no. 15391403D), Hebei Natural Science Funds for Distinguished Young Scholar (grant no. B2014209304), Hebei Natural Science Funds for the Joint Research of Iron and Steel (grant no. B2014209314), and Hebei Provincial Foundation for Returned Scholars (grant no. D2013005005). Li Liu and Shuanglong Lin both contributed equally to this work.Notes and references
- T. T. Li, Y. M. He and H. J. Lin, et al., Appl. Catal., B, 2013, 138–139, 95–103 CrossRef CAS PubMed.
- X. Li, L. Wang and X. Lu, J. Hazard. Mater., 2010, 177, 639–647 CrossRef CAS PubMed.
- Y. Li and Y. Ding, J. Phys. Chem., 2010, 114, 3175–3179 CAS.
- X. M. Zhou, G. Liu and J. G. Yu, J. Mater. Chem., 2012, 22, 21337–21354 RSC.
- Y. Ide, M. Matsuoka and M. Ogawa, J. Am. Chem. Soc., 2010, 132, 16762–16764 CrossRef CAS PubMed.
- S. Naya, K. Kimura and H. Tada, ACS Catal., 2013, 3, 10–13 CrossRef CAS.
- K. Awazu, M. Fujimaki and C. Rockstuhl, et al., J. Am. Chem. Soc., 2008, 130, 1676–1680 CrossRef CAS PubMed.
- X. X. Hu, C. Hu and T. W. Peng, et al., Environ. Sci. Technol., 2010, 44, 7058–7062 CrossRef CAS PubMed.
- P. Christopher, D. B. Ingram and S. Linic, J. Phys. Chem. C, 2010, 114, 9173–9177 CAS.
- D. B. Ingram and S. Linic, J. Am. Chem. Soc., 2011, 133, 5202–5205 CrossRef CAS PubMed.
- I. Thomann, B. A. Pinaud and Z. B. Chen, et al., Nano Lett., 2011, 11, 3440–3446 CrossRef CAS PubMed.
- Z. W. Liu, W. B. Hou and P. Pavaskar, et al., Nano Lett., 2011, 11, 1111–1116 CrossRef CAS PubMed.
- E. Thimsen, F. L. Formal and M. Grätzel, et al., Nano Lett., 2011, 11, 35–43 CrossRef CAS PubMed.
- V. Subramanian, E. E. Wolf and P. V. Kamat, J. Am. Chem. Soc., 2004, 126, 4943–4950 CrossRef CAS PubMed.
- K. Awazu, M. Fujimaki and C. Rockstuhl, et al., J. Am. Chem. Soc., 2008, 130, 1676–1680 CrossRef CAS PubMed.
- J. S. Lee, E. V. Shevchenko and D. V. Talapin, J. Am. Chem. Soc., 2008, 130, 9673–9675 CrossRef CAS PubMed.
- C. Pacholski, A. K. D. Ing and H. Weller, Angew. Chem., Int. Ed., 2004, 116, 4878–4881 CrossRef PubMed.
- T. Hirakawa and P. V. Kamat, J. Am. Chem. Soc., 2005, 127, 3928–3934 CrossRef CAS PubMed.
- S. K. Cushing, J. T. Li and F. Meng, et al., J. Am. Chem. Soc., 2012, 134, 15033–15041 CrossRef CAS PubMed.
- L. Armelao, D. Barreca and M. Bertapelle, et al., Thin Solid Films, 2003, 442, 48–52 CrossRef CAS.
- K. Borgohain, N. Murase and S. Mahamuni, J. Appl. Phys., 2002, 92, 1292–1297 CrossRef CAS PubMed.
- Y. W. Tan, X. Y. Xue and Q. Peng, et al., Nano Lett., 2007, 7, 3723–3728 CrossRef CAS.
- P. Poizot, S. Laruelle and S. Grugeon, et al., Nature, 2000, 407, 496–499 CrossRef CAS PubMed.
- J. T. Zhang, J. F. Liu and Q. Peng, et al., Chem. Mater., 2006, 18, 867–871 CrossRef CAS.
- P. E. Jongh, D. Vanmaekelbergh and J. J. Kelly, Chem. Mater., 1999, 1069–1070 Search PubMed.
- B. White, M. Yin and A. Hall, et al., Nano Lett., 2006, 6, 2095–2098 CrossRef CAS PubMed.
- C. Lu, L. Qi and J. Yang, et al., Adv. Mater., 2005, 17, 2562–2567 CrossRef CAS PubMed.
- Y. B. Wang, Y. N. Zhang and G. H. Zhao, et al., ACS Appl. Mater. Interfaces, 2012, 4, 3965–3972 CAS.
- M. S. Zhu, P. L. Chen and M. H. Liu, Langmuir, 2013, 29, 9259–9268 CrossRef CAS PubMed.
- Q. Hua, D. L. Shang and W. H. Zhang, et al., Langmuir, 2011, 27, 665–671 CrossRef CAS PubMed.
- J. Chen, S. H. Shen and P. H. Guo, et al., Appl. Catal., B, 2014, 152–153, 335–341 CrossRef CAS PubMed.
- L. Armelao, D. Barreca and M. Bertapelle, et al., Thin Solid Films, 2003, 442, 48–52 CrossRef CAS.
- K. Borgohain, N. Murase and S. Mahamuni, J. Appl. Phys., 2002, 92, 1292–1297 CrossRef CAS PubMed.
- M. Y. Wang, L. Sun and Z. Q. Lin, et al., Energy Environ. Sci., 2013, 6, 1211–1220 CAS.
- D. Sarkar, U. N. Maiti and C. K. Ghosh, et al., Adv. Sci. Lett., 2012, 6, 127–133 CrossRef CAS PubMed.
- L. Chen, R. Huang and S. F. Yin, et al., Chem. Eng. J., 2012, 193–194, 123–130 CrossRef CAS PubMed.
- J. X. Shu, Z. H. Wang and G. Q. Xia, et al., Chem. Eng. J., 2014, 252, 374–381 CrossRef CAS PubMed.
- Y. Li, J. Wang and H. Yao, et al., J. Mol. Catal. A: Chem., 2011, 334, 116–122 CrossRef CAS PubMed.
- C. McManamon, J. D. Holmes and M. A. Morris, J. Hazard. Mater., 2011, 193, 120–127 CrossRef CAS PubMed.
- A. G. Zhigotskii, E. F. Rynda and N. A. Mishchuk, et al., Russ. J. Appl. Chem., 2008, 81, 2056–2061 CrossRef CAS.
- N. Zhang, S. Q. Liu and X. Z. Fu, et al., J. Phys. Chem. C, 2011, 115, 9136–9145 CAS.
- P. Wang, B. B. Huang and X. Y. Qin, et al., Angew. Chem., 2008, 120, 8049–8051 CrossRef PubMed.
- J. G. Yu and B. Wang, Appl. Catal., B, 2010, 94, 295–302 CrossRef CAS PubMed.
- J. G. Yu, G. P. Dai and B. B. Huang, J. Phys. Chem. C, 2009, 113, 16394–16401 CAS.
- J. H. Xu, W. Z. Wang and S. M. Sun, et al., Appl. Catal., B, 2012, 111–112, 126–132 CrossRef CAS PubMed.
- W. H. Leng, Z. Zhang and J. Q. Zhang, et al., J. Phys. Chem. B, 2005, 109, 15008–15023 CrossRef CAS PubMed.
| This journal is © The Royal Society of Chemistry 2015 |


