Beneficiary effect of nanosizing ferric pyrophosphate as food fortificant in iron deficiency anemia: evaluation of bioavailability, toxicity and plasma biomarker

Bindu Y. Srinivasu a, Gopa Mitraa, Monita Muralidharana, Deepsikha Srivastavaa, Jennifer Pintoa, Prashanth Thankachanb, Sudha Sureshc, Arun Shetd, Suguna Raoe, Gayatri Ravikumarf, Tinku S. Thomasg, Anura V. Kurpadb and Amit K. Mandal*a
aDivision of Molecular Medicine, Clinical Proteomics Unit, St. John’s Research Institute, St. John’s National Academy of Health Sciences, 100 Feet Road, Koramangala, Bangalore-560034, India. E-mail: amit@sjri.res.in; Fax: +91-80-25501088; Tel: +91-80-49467107
bDepartment of Physiology, St. John’s Medical College, Division of Nutrition, St. John’s Research Institute, Bangalore, India
cDepartment of Pharmacology, St. John’s Medical College, Bangalore, India
dDepartment of Medical Oncology, St. John’s Medical College Hospital, Bangalore, India
eDepartment of Veterinary Pathology, Veterinary College, Bangalore, India
fDepartment of Pathology, St. John’s Medical College Hospital, Bangalore, India
gDivision of Epidemiology and Biostatistics, St. John’s Research Institute, St. John’s National Academy of Health Sciences, Bangalore, India

Received 28th April 2015 , Accepted 1st July 2015

First published on 1st July 2015


Abstract

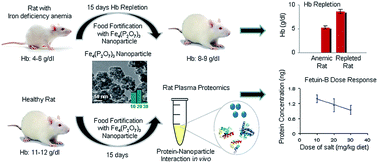
Iron deficiency anemia is a global health issue affecting a significant population worldwide. Fortification of food with iron compounds is a widely used strategy to prevent iron deficiency anemia. To overcome sensory effects, water insoluble and white colored compounds, like ferric pyrophosphate, are used to fortify infant cereals. Ferric pyrophosphate is poorly bioavailable due to its low solubility even in an acid medium. Nanosized iron salts find potential applications in food fortification, since solubility increases with decrease in the particle size. However, limited knowledge exists about the effect of nanoparticles in a biological system. The present study addresses the efficacy of synthesized ferric pyrophosphate in its nano form (10–30 nm) as a potential food fortificant in iron deficiency anemia and measures its toxicity in a rat model. Additionally, the effect of the nanoparticle in vivo has been explored using a mass-spectrometry-based plasma proteomics approach. The relative bioavailability of ferric pyrophosphate nanoparticle, calculated using hemoglobin regeneration efficiency was found to be 103.02% with respect to the reference salt, ferrous sulphate. Histopathological examinations of different organs did not show any significant toxicity attributable to nanoparticle ferric pyrophosphate. However, plasma proteomics analysis showed a decreasing trend in Fetuin-B concentration with increasing dose levels of nanoparticle ferric pyrophosphate. In conclusion, the nanoparticle ferric pyrophosphate could be a promising food fortificant in combating iron deficiency anemia, while Fetuin-B, a negative acute phase protein, might be a potential candidate for detecting biological responses to the nanoparticle exposure in vivo.

1. Introduction

Iron deficiency is considered to be the most common nutritional disorder affecting children and women significantly in both industrialized and non-industrialized nations. Severe form of iron deficiency leads to anemia. Iron deficiency anemia (IDA) is a major global health problem affecting an estimated 1 billion people worldwide.1 Reduced dietary iron intake, infection through intestinal parasites and blood loss during menstruation are among several reasons for iron deficiency.2 One of the effective strategies to prevent IDA is food fortification with iron compounds. However, food fortification with iron is a major challenge as most iron salts are colored and only water-soluble iron salts are highly bioavailable, which impart an unacceptable taste and color-related changes to the food vehicle. Ferric pyrophosphate [Fe4(P2O7)3] is a creamish white water-insoluble iron salt which does not impart sensory changes to the food matrix and is used to fortify infant cereals and chocolate drink powders for better iron absorption.3 Although the poor solubility of the salt in dilute acids leads to lower bioavailability and thereby reduces its nutritional value.4 The particle size of iron salts has been reported to play an important role in the absorption of iron.5,6 Reduction in the particle size of iron compounds increases its surface area which in turn improves its solubility in gastric juice, leading to higher absorption.2 For example, nanosizing ferric phosphate showed a significant increase in bioavailability of iron in a rat model.5 However, due to their small size, nanoparticles can cross physiological barriers, and exposure to nanoparticles might lead to health hazards.7–9 Therefore it is important to investigate the in vivo effect of nanoparticles when used as a food fortificant.

In the present study we have evaluated the efficacy of synthesized nanoparticle ferric pyrophosphate [NP-Fe4(P2O7)3] as a food fortificant in IDA using a rat model. Subsequently we have tested the acute and repeated dose toxicological effects of NP-Fe4(P2O7)3 to assess its safety. The in vivo effect of the nanoparticle at the plasma proteome level was explored by a mass spectrometry-based proteomics approach.

2. Results

Iron-deficiency anemia poses a considerable health risk to a substantial population globally, especially to women and children. Due to the limitation of food fortification strategies with colored and water-soluble iron salts, the search for colorless, water insoluble and acid soluble iron salts with high bioavailability is a growing need. Although nanosizing the salts increases their solubility, it also enables them to penetrate the physiological barriers. We synthesized NP-Fe4(P2O7)3, characterized it by various techniques and evaluated its bioavailability and oral toxicity through the Hemoglobin Regeneration Efficiency (HRE) method and toxicity studies, respectively. The biological responses on exposure to nanoparticles were assessed through plasma proteomics in a rat model.

2.1 Particle characterization

The EDAX spectrum of the synthesized salt indicated the presence of Fe, P and O in the atomic ratio of 1[thin space (1/6-em)]:[thin space (1/6-em)]1.719[thin space (1/6-em)]:[thin space (1/6-em)]5.05, as depicted in Fig. 1A, which is close to the theoretical value of 1[thin space (1/6-em)]:[thin space (1/6-em)]1.5[thin space (1/6-em)]:[thin space (1/6-em)]5.25 in Fe4(P2O7)3. The different IR bands observed in the region 900–714 cm−1, 1250–998 cm−1 and 630–495 cm−1 were assigned to P–O–P stretching, P–O vibration and deformation respectively, of ferric pyrophosphate (Fig. 1B). The analysis of TEM image indicated the particle size distribution to be within 10–30 nm (Fig. 1C). DLS measurement of NP-Fe4(P2O7)3 in aqueous environment showed an average hydrodynamic radius of 111.95 nm (Fig. 1D). The zeta potential of the nanoparticle in aqueous medium was found to be −31 mV, which ensures the stability of the particle in its nano form.10 Nanosizing the ferric pyrophosphate salt showed increased solubility by 3.5 fold, with respect to its micro form in 0.1 N HCl through AAS measurement.
image file: c5ra07724a-f1.tif
Fig. 1 Characterization of synthesized NP-Fe4(P2O7)3: (A) EDAX spectrum of the particle; (B) representative IR spectrum of NP-Fe4(P2O7)3; (C) TEM profile of synthesized Fe4(P2O7)3, the inset shows the particle size distribution within 10–30 nm; (D) hydrodynamic radius of the particle in water determined by DLS.

2.2 Relative bioavailability (RBV)

The bioavailability of the particle was estimated with respect to the reference salt, ferrous sulphate using the HRE method11 (ESI, Tables S1–S4). Anemic rats showed a significant increase in their hemoglobin level after they were fed with NP-Fe4(P2O7)3 fortified food at varying dose levels during the repletion period. The Fe intake, gain in body weight and hemoglobin change in rats during the repletion period across varying dose levels for both the salts are provided in Table 1. The RBV of NP-Fe4(P2O7)3 was found to be 103.02% with respect to ferrous sulphate, and it showed no significant difference from the reference salt (p = 0.098).
Table 1 Iron fortification level, fortified iron intake, body weight gain, and change in hemoglobin level in anemic rats during repletion period
Fe salt n (no of rats) Fortification level (mg per kg diet) Fe intake (mg per day) Body weight gain (g/15 days) Hb change (g dl−1 in 15 days)
NP-Fe4(P2O7)3 8 10 0.10 ± 0.02 26 ± 13.63 3.92 ± 1.36
8 20 0.22 ± 0.03 33.38 ± 17 3.41 ± 1.57
8 30 0.32 ± 0.06 37.25 ± 8.97 3.31 ± 0.75
FeSO4 8 10 0.11 ± 0.02 30.13 ± 14.93 3.21 ± 2.04
8 20 0.21 ± 0.04 27.63 ± 18.10 3.72 ± 1.40
8 30 0.33 ± 0.03 31.25 ± 7.57 5.04 ± 0.80


At the end of the feeding period, biochemical, hematological parameters and the concentration of reduced glutathione in erythrocytes did not show any statistically significant change between the two salt groups. Histopathological examinations of various organs using the hematoxylin–eosin and Prussian blue stain showed no evident signs of toxicity (ESI, Tables S5–S9).

2.3 Oral toxicity studies

In the acute oral toxicity study, no abnormal clinical signs and/or mortality were observed, and all rats gained weight over the 14 days following oral administration of the salt. No significant differences in the body weight or food consumption were observed in the experimental and the control group of rats (ESI, Table S10). Neither the biochemical and hematological parameters nor the reduced glutathione level in erythrocytes showed any statistically significant differences with respect to the control group (ESI, Tables S11–S13). Also histopathological findings did not show any evident toxicity. Thus, the lethal dose at 50% mortality (LD50) for NP-Fe4(P2O7)3 salt was found to be more than 2000 mg per kg body weight for both male and female rats.

In the repeated oral toxicity study, no abnormal clinical signs and no significant differences in the body weight or food consumption were observed in the experimental and the control group of rats (ESI, Table S14). After the dosing period, we did not find any toxicologically significant changes in biochemistry, hematology or reduced glutathione level in erythrocytes and histopathological parameters attributable to NP-Fe4(P2O7)3 (ESI, Tables S15–S18). As a result of these observations, we determined the no-observed-adverse-effect-level (NOAEL) of NP-Fe4(P2O7)3 to be 1000 mg per kg body weight for male and female rats. However, in a few rats we observed bloated stomach, enlarged and spotted lungs and dark pigmentation on the nails, which were considered to be a secondary response due to their biological makeup.

2.4 Proteomics

Nanoparticles, being small in size, can potentially penetrate physiological barriers, entering various parts of the body and might even cross subcellular compartments.12 Nanoparticles less than 30 nm are able to cross the blood brain barrier.13 Therefore, this raises a concern about probable nanoparticle–protein interaction once they enter the biological system. In the present study, a mass spectrometry based proteomics strategy was used to evaluate the effect of NP-Fe4(P2O7)3 through the quantification of plasma proteins. The quantified proteomics data obtained from NP-Fe4(P2O7)3 treated (10, 20, 30 mg per kg diet) rat plasma were compared with those of the FeSO4 group. Table 2 shows the quantified values of different plasma proteins and their respective statistical significance observed in proteomics analysis. Among the 16 common proteins evaluated with both iron salts exposure, a statistically significant difference was observed in the expression levels of proteins Fetuin-B and murinoglobin-1 at varying doses of NP-Fe4(P2O7)3 compared to FeSO4 (p = 0.039, 0.024 respectively). The concentration of the protein Fetuin-B decreased gradually along the increasing dose levels of NP-Fe4(P2O7)3 (Fig. 2A), while it remained nearly unchanged in FeSO4 treated group. However, no trend could be observed for murinoglobin-1.
Table 2 Concentration of proteins in respective salt groups across dose levelsa
Salts NP-Fe4(P2O7)3 Ferrous sulphate p-Value
Doses (mg per kg diet) 10 20 30 10 20 30
Protein name Mean of protein in ng ± S.D. Mean of protein in ng ± S.D. B/w salts B/w doses Salt vs. dose
a Values are mean ± SD; p-values are from ANOVA; # p-values are from simple linear regression; the proteins in bold face showed a trend in dose response to NP-Fe4(P2O7)3.
Complement C3 8.87 ± 1.28 9.53 ± 0.09 9.50 ± 1.15 9.16 ± 1.31 8.87 ± 1.67 9.33 ± 2.21 0.775 0.870 0.828
Complement C4 1.17 ± 0.20 1.16 ± 0.20 1.25 ± 0.37 0.77 ± 0.09 1.21 ± 0.33 1.15 ± 0.25 0.217 0.251 0.362
Serine protease inhibitor A3n 0.64 ± 0.07 0.64 ± 0.18 0.64 ± 0.14 0.51 ± 0.13 0.45 ± 0.09 0.76 ± 0.21 0.354 0.130 0.175
Carboxylesterase 1.20 ± 0.29 1.07 ± 0.10 0.99 ± 0.25 2.01 ± 0.36 1.20 ± 0.27 1.33 ± 0.38 0.005 0.016 0.208
Serotransferrin 7.37 ± 1.20 6.62 ± 0.92 6.73 ± 0.94 7.39 ± 1.25 6.61 ± 1.10 7.31 ± 2.09 0.721 0.544 0.898
Alpha 1 inhibitor 3 7.55 ± 1.55 11.69 ± 1.24 10.40 ± 2.58 12.73 ± 1.94 11.86 ± 2.37 10.04 ± 3.01 0.063 0.619 0.107
Hemopexin 4.22 ± 0.82 3.85 ± 0.71 4.22 ± 0.84 4.14 ± 0.85 3.58 ± 1.06 2.91 ± 0.60 0.376 0.206 0.563
Glutathione peroxidase 0.27 ± 0.06 0.26 ± 0.05 0.22 ± 0.01 0.23 ± 0.07 0.23 ± 0.034 0.23 ± 0.004 0.388 0.547 0.667
Alpha 2 HS glycoprotein 3.25 ± 0.54 3.15 ± 0.63 2.63 ± 0.57 3.08 ± 0.64 2.86 ± 0.32 2.87 ± 0.49 0.546 0.267 0.414
Beta 2 glycoprotein 0.36 ± 0.01 0.44 ± 0.10 0.35 ± 0.07 0.27 ± 0.06 0.31 ± 0.05 0.28 ± 0.07 0.014 0.460 0.931
Murinoglobin-1 5.36 ± 0.34 9.02 ± 1.92 7.17 ± 0.85 9.18 ± 0.67 8.31 ± 1.56 8.32 ± 1.17 0.036 0.156 0.024
Alpha 1 macroglobin 13.83 ± 0.81 12.43 ± 2.46 11.01 ± 0.27 14.29 ± 2.57 11.50 ± 2.84 13.55 ± 2.71 0.327 0.107 0.452
Inter alpha-trypsin inhibitor heavy chain H3 1.72 ± 0.38 1.40 ± 0.46 1.46 ± 0.29 1.76 ± 0.50 1.47 ± 0.33 1.74 ± 0.31 0.417 0.324 0.791
Protein AMBP 0.31 ± 0.08 0.64 ± 0.16 0.53 ± 0.14 0.66 ± 0.15 0.59 ± 0.17 0.65 ± 0.16 0.033 0.348 0.114
Fetuin-B 1.39 ± 0.16 1.12 ± 0.25 0.94 ± 0.18 1.09 ± 0.15 1.07 ± 0.20 1.19 ± 0.21 0.441 0.267 0.039
Apolipoprotein A IV 0.37 ± 0.09 0.44 ± 0.07 0.28 ± 0.03 0.802#
Vitamin D binding protein 1.33 ± 0.19 1.16 ± 0.18 3.62 ± 5.36 0.129#
Haptoglobin 0.16 ± 0.04 0.21 ± 0.03 0.35 ± 0.12 0.005#
Kininogen-1 0.41 ± 0.08 0.31 ± 0.09 0.31 ± 0.06 0.001#
Afamin 0.82 ± 0.12 1.11 ± 0.31 0.82 ± 0.19 0.777#
Plasminogen 0.82 ± 0.11 0.76 ± 0.23 0.86 ± 0.18 0.570#
Gelsolin 0.46 ± 0.06 0.38 ± 0.09 0.37 ± 0.08 0.100#
Complement component C9 0.26 ± 0.06 0.21 ± 0.04 0.31 ± 0.06 0.750#


image file: c5ra07724a-f2.tif
Fig. 2 (A) Dose–response curve for the quantified Fetuin-B in the NP-Fe4(P2O7)3 treated group; (B) dose–response curve for the quantified haptoglobin in the NP-Fe4(P2O7)3 treated group.

Within the exclusive category of eight proteins observed in the NP-Fe4(P2O7)3 treated group, haptoglobin showed a statistically significant increase in its concentration (p = 0.005) across the increasing doses of the salt (Fig. 2B) while kininogen-1, though statistically significant (p = 0.001), did not show any trend across the doses.

The biochemical, hematological and reduced glutathione level in erythrocytes of NP-Fe4(P2O7)3 treated group did not show any evident sign of toxicity, compared to the FeSO4 treated group (ESI, Tables S19–S22). Fig. 3 shows representative photomicrographs of the H & E staining pattern of liver, spleen and bone marrow for respective groups – Panel A, C, E for NP-Fe4(P2O7)3 treated rats and Panel B, D, F for FeSO4 treated rats. The inset of each panel depicts the Prussian blue staining for respective organs. No significant difference was observed in histopathological examinations of organs between the two salt groups (ESI, Table S23).


image file: c5ra07724a-f3.tif
Fig. 3 Photomicrographs showing sections from rats in the NP-Fe4(P2O7)3 treated group (Panel A, C, E) and the FeSO4 treated group (Panel B, D, F). Each photomicrograph shows the following: liver (A and B – H & E stain; original magnification 4×), spleen (C and D – H & E stain; original magnification 4×) and bone marrow (E and F– H & E stain; original magnification 20×). The insets show Prussian Blue stain at magnifications 10× (A–D) and at 20× (E and F).

3. Discussion

Food fortification is generally considered the most sustainable and cost-effective approach in the short term, to overcome iron deficiency in the population. The NP-Fe4(P2O7)3, which showed a very good bioavailability (103.02%), holds promise as a food fortificant. High bioavailability coupled with an inert nature, makes this salt an ideal candidate to overcome the conventional challenges of altered sensory character and poor bioavailability that affect food fortification. Reducing the particle size of a salt is an effective way to increase solubility and thereby its bioavailability. Previous study reported that the bioavailability of micronised Fe4(P2O7)3 was only 59% in a rat model.14 The further reduction in particle size to a nano level showed markedly improved bioavailability of Fe4(P2O7)3 in the current study. A few other iron salts such as ferric phosphate, iron and zinc containing compounds were also reported to have increased bioavailability in rats with decreased particle size.5,6 On the other hand, the small size of the nanoparticles might allow them to encounter various cells in the body, and also to cross membrane barriers within a biological system. On contact with biological fluids, protein molecules could be adsorbed on the surface of the nanoparticles, and then determine the fate of the nanoparticles. However, despite a significant number of nanoparticles being used in rat studies for food fortification, comparatively little is known about the effect of these particles in biological systems. Thus it becomes necessary to evaluate such risks associated with bioapplication of the nanoparticles.

The oral toxicity data reflected that NP-Fe4(P2O7)3 did not impart measurable histological or biochemical adverse effects in the rats, which enhances the prospects of the particle as a food fortificant. Previous study had shown no toxic effect with NP-Fe in acute oral toxicity using iron deficient anemic rats.15 However, another study by Kumari et al. reported that NP-Fe2O3 (30 nm) had no mortality at the dose of 2000 mg per kg body weight, but showed neurological and physiological disturbances, along with liver and kidney necrosis in rats.16 Nanosizing elemental copper and zinc have also resulted in toxic effects in rats.17,18 Although in the present study, NP-Fe4(P2O7)3 did not show any measurable toxicity by histopathological examinations, further evaluation was still required, since nanoparticles might enter into the circulation via a paracellular pathway.19 It is known that the nanoparticles can be absorbed through the Peyer’s patches of the small intestine, and might pass through mesenteric lymphatics to reach the liver and spleen.20 For example, on exposure to copper sulphide and gold nanoparticles, liver tissues showed an altered proteome profile through imaging mass spectrometry.21

Nanoparticles, due to their unique properties, have found wide applications in biomedicine, technology, consumer products etc.22,23 Upon exposure to a biological system, the surface of the nanoparticle is adsorbed with proteins and lipids leading to the formation of nano–bio-interfaces.24 In view of this, and the possibilities above, we investigated the in vivo biological responses of plasma proteins at three different doses of NP-Fe4(P2O7)3 and compared them with the FeSO4 as control group. Gao et al. had shown that administration of TiO2 nanoparticles in rats led to significant changes in the expression level of a few proteins in the lymph node.25 In the present study, we observed that the expression of the protein Fetuin-B showed a decreasing trend along the increasing dose levels of NP-Fe4(P2O7)3 whereas it remained almost unchanged in the FeSO4 treated group. Fetuin-B is an acidic glycoprotein belonging to the Fetuin family and is a well-known negative acute phase protein. Based on the observed dose response of Fetuin-B to the NP-Fe4(P2O7)3, we propose two mechanistic pathways which might result in decreasing its concentration with increase in the dose of NP-Fe4(P2O7)3, as depicted in Fig. 4. Fe4(P2O7)3 in its nano form might enter the systemic circulation and be adsorbed by a few plasma proteins acting as opsonins; for example, immunoglobulins, C-reactive protein, fibronectin etc. Opsonization of NP-Fe4(P2O7)3 facilitates its phagocytosis through macrophages. Subsequently the activated macrophages secrete signaling molecules such as cytokines, triggering an acute phase response. To regulate macrophage cytokine responses, acute phase proteins participate with either an increase or decrease in their concentrations.26–28 Fetuin-B, being a negative acute phase protein, takes part in the process of deactivating the macrophages to restrain the innate immune response. Therefore, in the present study, the observed decrease in concentration of Fetuin-B might have been due to the increased acute phase response induced by the increased dose level of NP-Fe4(P2O7)3 (Pathway 1, Fig. 4). This has been shown in other studies, where the Fetuin-B m-RNA level was downregulated in rats during an acute phase response.29 Equally, Fetuin is one of the proteins that adsorbs onto the surface of the nanoparticles, where it enhances phagocytosis through scavenger receptors.30,31 Although the detailed mechanism of Fetuin being recognized by phagocytes is not well understood, it is possible that Fetuin-B might be acting as an opsonin to NP-Fe4(P2O7)3 and that the opsonized nanoparticles are eventually recognized by macrophages for phagocytosis (Pathway 2, Fig. 4). With an increase in NP-Fe4(P2O7)3 concentration, more adsorption could occur, resulting in decreased concentration of Fetuin-B in the plasma.


image file: c5ra07724a-f4.tif
Fig. 4 Schematic representation of probable pathways of Fetuin-B interaction: Pathway 1-uptake of NP-Fe4(P2O7)3 and its opsonization by plasma proteins stimulating phagocytosis through macrophages. Subsequent steps include release of proinflammatory signals leading to a negative acute phase response by Fetuin-B. Pathway 2 – Fetuin-B adsorption on to the surface of the NP-Fe4(P2O7)3 as an opsonin to elicit the phagocytosis by macrophages.

On the other hand, positive acute phase proteins increase in concentration during an acute phase response. Higashisaka et al. reported that haptoglobin concentration was elevated on exposure to silica nanoparticles.32 Thus, the observed trend of increasing haptoglobin concentration across varying doses of NP-Fe4(P2O7)3 might also indicate an acute phase response on exposure to nanoparticles. However, the response of haptoglobin in the FeSO4 group needs to be explored.

As large number of nanoparticles are being implemented in consumer products, medicine and technology, characterization of their in vivo biological effect is a growing need.33 Monitoring the expression levels of proteins in the proteome could be a unique tool for this purpose. Specifically, for food fortification strategies to combat iron deficiency anemia, understanding the effect of NP-Fe4(P2O7)3 in vivo is critical, as the intended preventive strategy should do no harm. In this study, we have identified Fetuin-B, one of the acute phase proteins, which might bear the signature of an in vivo response to increasing exposure to NP-Fe4(P2O7)3.

4. Experimental

4.1 Materials

Iron deficient rodent diet was purchased from the National Institute of Nutrition (Hyderabad, India). All necessary chemicals, Seppro IgY R7 spin column for depletion of abundant plasma proteins and a commercial kit for hemoglobin estimation were procured from Sigma Aldrich (St. Louis, MO, USA). Columns for 2D nanoLC and rapigest were purchased from Waters (Milford, MA, USA). Biochemical assay kits were from Span Diagnostics (Surat, Gujrat, India). All other reagents used were of analytical grade.

4.2 Synthesis and characterization of ferric pyrophosphate nanoparticle

Standardization of ferric pyrophosphate nanoparticle synthesis and its characterization was done at the International Centre for Material Science, JNCASR, Bangalore. Subsequently the synthesis protocol was replicated in our laboratory and the size of the nanoparticles was verified using TEM. Ferric pyrophosphate nanoparticles were synthesized by titrating sodium pyrophosphate against ferric chloride solution. 100 ml of 0.2265 (M) ferric chloride (aq.) was added to 110 ml of 0.17 (M) sodium pyrophosphate (aq.) in the presence of 15% ethylene glycol at 65 °C over six days with continuous stirring to avoid particle agglomeration. The reaction mixture was kept under stirring conditions for 3 h at the end of the titration. The obtained creamish white precipitate was washed four times with water followed by centrifugation at 3500 rpm for 30 min. The synthesized material was filtered and vacuum dried.

The synthesized salt was found to be amorphous, as was evident from the PXRD pattern. The chemical composition, the signature P–O–P bond stretching and the particle size distribution of the salt were estimated using Energy Dispersive X-ray analysis (EDAX), Infrared spectroscopy (IR) and Transmission Electron Microscopy (TEM), respectively. EDAX spectra were recorded with a Leica S-440I microscope fitted with an EDAX spectrometer. IR spectra were recorded using a Bruker IFS 66v/S spectrometer. TEM images were obtained with a JEOL JEM 3010, operating with an accelerating voltage of 300 kV. The synthesized salt was crystallized by heating it to 800 °C for 3 h following the rate of 2 °C rise per min. The annealed product was found to be crystalline and the Powder X-Ray Diffraction (PXRD) pattern was in agreement with that of the reported patterns of Fe4(P2O7)3. The annealing process was carried out in an argon atmosphere. X-Ray diffraction patterns were recorded using Cu Kα radiation on a Rich-Siefert XRD-3000 TT diffractometer. Ferric pyrophosphate nanoparticles were dispersed in Milli-Q water and the hydrodynamic radii of the particles were analyzed by Dynamic Light Scattering (DLS) using a Zetasizer Nano Zs (Malvern Instruments, Malvern, UK). The zeta potential of the nanoparticles in water was measured using a Zetasizer Nanoseries-ZEN 3690 (Malvern Instruments). The in vitro solubility of nano and micro Fe4(P2O7)3 particles were measured as follows: 10 mg of each sample was added into 125 ml of 0.1 N HCl (pH = 1) in two different conical flasks. The samples were mixed in an orbital shaker at 150 rpm at 37 °C. After 1 h, 1.5 ml aliquots were taken from each flask separately and centrifuged at 13[thin space (1/6-em)]000 rpm for 4 min at 25 °C. The supernatant was taken and the soluble iron content of each sample was measured by Atomic Absorption Spectrometer (AAS) using an iCE 3500 (Thermo Scientific, USA).

The experimental protocol for rat study was approved by Institutional Animal Ethical Committee. Sprague Dawley rats were housed in polypropylene cages with grated stainless steel lids at room temperature with a 12 h light/dark cycle. After acclimatization for a week they were assigned to respective studies. Blood samples were collected by retro-orbital puncture to measure hematological & biochemical parameters and to assess oxidative stress. For hematology, we measured the erythrocyte count (RBC), hematocrit value (Ht), mean corpuscular volume (MCV), mean corpuscular hemoglobin concentration (MCHC), reticulocyte count (RDW), platelet count (PLT), mean platelet volume (PCT), and leukocyte count (WBC) in an automated analyzer using whole blood. For biochemical parameters, we used plasma samples to measure aspartate transaminase (AST), alkaline phosphatase (ALP), alanine transaminase (ALT), total bilirubin, creatinine, glucose and total protein. Oxidative stress in whole blood was assessed by measuring reduced glutathione, an abundant antioxidant in erythrocytes, according to the standard method.34 At the end of all the respective studies the rats were sacrificed by etherization and subjected to necropsy. The following excised organs were weighed prior to fixation: brain, heart, lungs, liver, kidney, stomach, pancreas, spleen, intestine and a smear of aspirated bone marrow from the femur was prepared. Routine hematoxylin and eosin (H & E) staining was conducted for the samples obtained from a representative sample of each organ to observe the histopathological changes. Prussian blue (PB) staining was performed to estimate the iron deposits. A semi-quantitative scoring method was followed to assess the iron deposition; when iron deposits were not observed under an oil immersion (magnification 100×), it was graded 0 and when iron granules were observed even under scanner magnification (4×), it was graded 6.

4.3 Bioavailability study

21 days old male rats (n = 48) were made anemic by feeding them with an iron deficient diet along with phlebotomy for 1 month. The iron content of the iron deficient food was 2–3 ppm, as measured using atomic absorption spectroscopy. After this depletion period, rats were weighed and blood was collected by retro-orbital puncture for hemoglobin estimation. Rats with Hb levels of 4–6 gm dl−1 were randomly assigned to 6 groups of 8 rats each. The 3 groups were fed with iron deficient food fortified with different dose levels of NP-Fe4(P2O7)3 (10, 20 and 30 mg Fe per kg diet) and the other 3 group were fed with iron deficient food fortified with same dose levels of FeSO4 salt for 15 days. Food, water consumption and change in body weight were recorded throughout the repletion period. At the end of the study, blood was collected for Hb estimation and the rats were sacrificed. Hemoglobin was measured in triplicate using the cyanmethemoglobin method.

The relative bioavailability of NP-Fe4(P2O7)3 salt was calculated using the hemoglobin regeneration efficiency (HRE) method.11 The iron content (Fe) of hemoglobin (Hb) in mg was determined by considering a total blood volume of 6.7% of the rat body weight and an average iron content of 3.35 mg per Hb (g).

The efficiency of the NP-Fe4(P2O7)3 in regenerating the hemoglobin level in anemic rats was calculated using the hemoglobin regeneration efficiency method (HRE). In this method, the ratio of the iron incorporated into hemoglobin (Hb) to the iron intake during the feeding period was calculated and the relative bioavailability of NP-Fe4(P2O7)3 was obtained from the HRE ratios of the NP-Fe4(P2O7)3 to the reference salt. Subsequently, a paired t test was performed between the two salts to find out any significant differences in the bioavailability.

image file: c5ra07724a-t1.tif

HRE values were then calculated for each rat as follows:

image file: c5ra07724a-t2.tif

image file: c5ra07724a-t3.tif

image file: c5ra07724a-t4.tif

4.4 Oral toxicity studies

Acute oral toxicity was performed according to OECD guidelines for testing of chemicals (OECD no. 420, fixed dose procedure). An equal number (n = 20) of healthy adult male and female rats were randomly assigned to the experimental group and respective control group. The experimental group was fed with NP-Fe4(P2O7)3 suspended in water which was administered in a single dose of 2000 mg per kg body weight through oral cannula and observed for 14 days. The control group received only vehicle (water). During the experimental period, all the rats were observed daily for general appearance and mortality. Food, water consumption and body weight were recorded every day.

Repeated Oral Toxicity was also performed according to the OECD guideline for testing of chemicals (OECD no. 407, Repeated Dose 28 Day Oral Toxicity Study in Rodents). An equal number (n = 30) of healthy adult male and female rats were randomly assigned to 3 groups. Two groups of rats were fed with aqueous suspension of NP-Fe4(P2O7)3 and micronized Fe4(P2O7)3, respectively, at a dose of 1000 mg per kg body weight and another group was fed with only vehicle (water) through oral cannula once daily for 28 days. During experimental period, all the rats were observed for general appearance and mortality once a day. Food, water consumption and body weight were recorded on alternate days.

4.5 Proteomics study

21 days old male rats (n = 24) were fed with regular rat diet for one month and the rats were randomly assigned to 6 groups of 4 rats each. Subsequently the rats of all the 6 groups were fed with the same fortified diet as mentioned in the bioavailability study. After 15 days of the experimental study period, blood was withdrawn and the rats were sacrificed. Plasma was separated immediately from the blood samples and stored at −80 °C until further analysis.
4.5.1 Sample preparation. Plasma samples were depleted of 7 major abundant proteins using Seppro IgY R7 spin column. After depletion, the sample was lyophilized and dialyzed against 50 mM ammonium bicarbonate buffer (pH = 7.8). The concentration of the the protein was determined by Bradford assay using BSA as a standard. To 100 μg of protein, 10 μl of 0.2% Rapigest solution was added and heated at 80 °C for 15 min to denature the plasma proteins. To cleave the disulphide linkages in proteins, the sample was reduced using 5 mM DTT at 60 °C for 30 min, followed by alkylation using 10 mM IAM at room temperature for 30 min in the dark. The linearized proteins were then digested with trypsin (enzyme: substrate at 1[thin space (1/6-em)]:[thin space (1/6-em)]10, w/w) at 37 °C overnight. 60 μl of the digested plasma proteins was acidified by adding 1 μl of formic acid and the reaction mixture was incubated at 37 °C for 90 min to breakdown the rapigest. After centrifugation at 6000 rpm for 20 min, the clear supernatant was taken to LC/MS analysis.
4.5.2 Fractionation. The tryptic peptides obtained from the in-solution digestion were fractionated in an automated two-dimensional nano acquity system (Waters, Milford, MA, USA), coupled to a mass spectrometer. The first dimension of chromatography consisted of a Reverse Phase (RP) X-Bridge column (BEH, 300 μm × 50 mm, 5 μm) at alkaline pH (pH = 8.5) with solvent A (20 mM ammonium formate in water) and solvent B (100% acetonitrile). A total of 3 μg of digested protein was loaded onto the column. The elution of the peptides was achieved with a flow rate of 2 μl min−1 using six step gradients comprising of the following percentages of ACN: 10.8, 14.0, 16.7, 20.4, 50.0 and 85.0. After automated dilution and acidification, the eluted peptides were subjected to a second dimensional fractionation at pH = 2.5, using RP column (BEH, 75 μm × 250 mm, 1.7 μm). The solvent system consisted of solvent A (0.1% formic acid in water) and solvent B (0.1% formic acid in acetonitrile). Fractionation was achieved by using a linear gradient of 3–40% of solvent B in 60 min. All samples were run in triplicate. The proteins were quantified with a label free technique. 100 fmol of enolase digest (yeast) was spiked in each digested sample as an internal standard, before loading onto the first dimensional nanoLC column.
4.5.3 Mass spectral data acquisition and quantification. Fractionation of peptides in the two-dimensional nanoLC was recorded in a Synapt HDMS (WATERS) using the MSE mode of acquisition. Data were acquired within the mass range of 50–1900 m/z, with an intermittent acquisition of Glufibrino peptide B as a lock mass at every 45 s. For protein quantification, the Hi3 method was used, where a universal response factor was calculated from yeast enolase (the averaged intensity of the three most intense peptides) and compared to the intensity of the peptides of interest.35 During data processing, carbamidomethylation of cysteine was kept as a fixed modification, while oxidation of methionine was kept as a variable modification.
4.5.4 Statistical analysis. Data analysis was performed using SPSS for Windows (version 11.5.1). All the tests were performed assuming bilateral hypothesis and a 5% significance level. Data are presented as the mean and standard deviation (SD). Within groups, comparisons between the baseline and endline data were performed by the paired t-test while between-groups, comparisons were performed using an independent sample t-test. The data were compared between doses using analysis of variance (ANOVA). Post hoc comparisons were performed using Tukey’s test. The assumption of normal distribution of all continuous data was examined using the Shapiro Wilk W-test. When not normally distributed, data were compared by non parametric Wilcoxon, Mann–Whitney U and Kruskal–Wallis tests, respectively.

The quantified proteomics data were normalized and evaluated by selecting the proteins that appeared in at least 2 out of 3 technical replicates for each sample. Then, the data was defined with the degree of technical variation with ≤15% of the coefficient of variation. In addition, the proteins that appeared in at least 3 out of 4 biological replicates were selected and biological variation was considered with a broader degree of ≤30% of coefficient of variation. After a robust validation of the data on the basis of replicate analysis, those proteins that were common among both the salts were considered for two-factor analysis. A significant interaction indicated the difference in the expression levels of a protein across varying doses of the two salts. Furthermore, the technical and biological variation cutoff criteria were met by a few proteins for NP-Fe4(P2O7)3 alone and not for FeSO4. The response-to-dose in this salt was examined using the linear regression model of quantified values of protein. The list was further narrowed down to those with a monotonic trend in the expression level across varying doses.

5. Conclusion

In this study we showed that decreasing the particle size of ferric pyrophosphate to nanoscale improved iron absorption leading to high bioavailability in iron-deficient rats. Furthermore, the oral toxicity studies showed that no evident toxicity was attributable to nanoparticular ferric pyrophosphate, which improves the viability of the particle as a potential food fortificant in combating iron-deficiency anemia in the future. However, in a group of healthy rats, the exposure of the same nanoparticle showed a decreasing concentration of Fetuin-B, a negative acute-phase protein, with increasing doses of ferric pyrophosphate nanoparticle. Whether the response of Fetuin-B is a general biological phenomenon of nanoparticle exposure in vivo, needs to be explored further. More in-depth knowledge is required in this domain to understand nano–bio interaction in vivo to minimize probable health hazards. The present study showed that exploring the plasma proteome of nano-exposed rats could be a promising tool for the same.

Author contribution

B. Y. S. and G. M. performed the experiments, analyzed the data and wrote the paper; M. M., D. S. and J. P. performed the experiments; P. T. and S. S. helped in designing rat experiments; A. S. helped in project writing; S. R. helped in executing rat experiments; G. R. performed the histopathological examination of slides; T. S. T. performed statistical analyses; A. V. K. helped in writing the project and various other aspects of the study; A. K. M. wrote the project, analyzed the data and wrote the manuscript.

Acknowledgements

We acknowledge Nano Mission, Department of Science and Technology for funding the project. We acknowledge Prof. C. N. R. Rao, ICMS, JNCASR, Bangalore for helping us in the synthesis and characterization of ferric pyrophosphate nanoparticles. We acknowledge Dr Balaram Sahoo, IISc, Bangalore, India for measuring the zeta potential and Dr Rituparna Sinha Roy, IISER, Kolkata, India for measuring the hydrodynamic radii of nanoparticles. We acknowledge Santhosh Kumar A. and Nimai Mandal for technical assistance.

References

  1. WHO, UNICEF and UNU, Iron Deficiency Anemia: Assessment, Prevention, and Control, WHO/NHD/01.3, Geneva, Switzerland, World Health Organization, 2001 Search PubMed.
  2. D. D. Miller, Nat. Nanotechnol., 2010, 5, 318 CrossRef CAS PubMed.
  3. M. C. Fidler, T. Walczyk, L. Davidsson, C. Zeder, N. Sakaguchi, L. R. Juneja and R. F. Hurrell, Br. J. Nutr., 2004, 91, 107 CrossRef CAS PubMed.
  4. R. F. Hurrell, J. Nutr., 2002, 132, 806 Search PubMed.
  5. F. Rohner, F. O. Ernst, M. Arnold, M. Hilbe, R. Biebinger, F. Ehrensperger, S. E. Pratsinis, W. Langhans, R. F. Hurrell and M. B. Zimmermann, J. Nutr., 2007, 137, 614 CAS.
  6. F. M. Hilty, M. Arnold, M. Hilbe, A. Teleki, J. T. Knijnenburg, F. Ehrensperger, R. F. Hurrell, S. E. Pratsinis, W. Langhans and M. B. Zimmermann, Nat. Nanotechnol., 2010, 5, 374 CrossRef CAS PubMed.
  7. K. S. Hougaard, P. Jackson, K. A. Jensen, J. J. Sloth, K. Löschner, E. H. Larsen, R. K. Birkedal, A. Vibenholt, A. M. Boisen, H. Wallin and U. Vogel, Part. Fibre Toxicol., 2010, 7, 16 CrossRef PubMed.
  8. J. A. Bourdon, A. T. Saber, N. R. Jacobsen, K. A. Jensen, A. M. Madsen, J. S. Lamson, H. Wallin, P. Møller, S. Loft, C. L. Yauk and U. B. Vogel, Part. Fibre Toxicol., 2012, 9, 5 CrossRef CAS PubMed.
  9. T. Morishige, Y. Yoshioka, A. Tanabe, X. Yao, S. Tsunoda, Y. Tsutsumi, Y. Mukai, N. Okada and S. Nakagawa, Biochem. Biophys. Res. Commun., 2010, 392, 160 CrossRef CAS PubMed.
  10. P. Bihari, M. Vippola, S. Schultes, M. Praetner, A. G. Khandoga, C. A. Reichel, C. Coester, T. Tuomi, M. Rehberg and F. Krombach, Part. Fibre Toxicol., 2008, 5, 14 CrossRef PubMed.
  11. A. L. Forbes, M. J. Arnaud, C. O. Chichester, J. D. Cook, B. N. Harrison, R. F. Hurrell, S. G. Kahn, E. R. Morris, J. T. Tanner and P. Whittaker, et al., Am. J. Clin. Nutr., 1989, 49, 225 CAS.
  12. G. Oberdörster, Z. Sharp, V. Atudorei, A. Elder, R. Gelein, W. Kreyling and C. Cox, Inhalation Toxicol., 2004, 16, 437 CrossRef PubMed.
  13. S. R. Saptarshi, A. Duschl and A. L. Lopata, J. Nanobiotechnol., 2013, 19, 11 Search PubMed.
  14. R. Wegmüller, M. B. Zimmermann, D. Moretti, M. Arnold, W. Langhans and R. F. Hurrell, J. Nutr., 2004, 134, 3301 Search PubMed.
  15. http://nanocon2013.tanger.cz/files/proceedings/14/reports/2144.pdf.
  16. M. Kumari, S. Rajak, S. P. Singh, U. S. Murty, M. Mahboob, P. Grover and M. F. Rahman, Drug Chem. Toxicol., 2013, 36, 296 CrossRef CAS PubMed.
  17. Z. Chen, H. Meng, G. Xing, C. Chen, Y. Zhao, G. Jia, T. Wang, H. Yuan, C. Ye, F. Zhao, Z. Chai, C. Zhu, X. Fang, B. Ma and L. Wan, Toxicol. Lett., 2006, 163, 109 CrossRef CAS PubMed.
  18. B. Wang, W. Y. Feng, T. C. Wang, G. Jia, M. Wang, J. W. Shi, F. Zhang, Y. L. Zhao and Z. F. Chai, Toxicol. Lett., 2006, 161, 115 CrossRef CAS PubMed.
  19. J. S. McCullough, G. M. Hodges, G. R. Dickson, A. Yarwood and K. E. Carr, J. Submicrosc. Cytol. Pathol., 1995, 27, 119 CAS.
  20. N. Hussain, V. Jaitley and A. T. Florence, Adv. Drug Delivery Rev., 2001, 50, 107 CrossRef CAS PubMed.
  21. L. Guo, I. Panderi, D. D. Yan, K. Szulak, Y. Li, Y. T. Chen, H. Ma, D. B. Niesen, N. Seeram, A. Ahmed, B. Yan, D. Pantazatos and W. Lu, ACS Nano, 2013, 7, 8780 CrossRef CAS PubMed.
  22. M. P. Monopoli, D. Walczyk, A. Campbell, G. Elia, I. Lynch, F. B. Bombelli and K. A. Dawson, J. Am. Chem. Soc., 2011, 133, 2525 CrossRef CAS PubMed.
  23. B. Mayank, S. Muthukamalam, S. Sudharani and K. V. Annamraju, RSC Adv., 2015, 5, 32006 RSC.
  24. S. Tenzer, D. Docter, S. Rosfa, A. Wlodarski, J. Kuharev, A. Rekik, S. K. Knauer, C. Bantz, T. Nawroth, C. Bier, J. Sirirattanapan, W. Mann, L. Treuel, R. Zellner, M. Maskos, H. Schild and R. H. Stauber, ACS Nano, 2011, 5, 7155 CrossRef CAS PubMed.
  25. Y. Gao, N. V. Gopee, P. C. Howard and L. R. Yu, J. Proteomics, 2011, 74, 2745 CrossRef CAS PubMed.
  26. D. E. Owens 3rd and N. A. Peppas, Int. J. Pharm., 2006, 307, 93 CrossRef PubMed.
  27. M. A. Dobrovolskaia and S. E. McNeil, Nat. Nanotechnol., 2007, 2, 469 CrossRef CAS PubMed.
  28. H. Wang, M. Zhang, M. Bianchi, B. Sherry, A. Sama and K. J. Tracey, Proc. Natl. Acad. Sci. U. S. A., 1998, 95, 14429 CrossRef CAS.
  29. E. Olivier, E. Soury, P. Ruminy, A. Husson, F. Parmentier, M. Daveau and J. P. Salier, Biochem. J., 2000, 350, 589 CrossRef CAS PubMed.
  30. P. P. Karmali and D. Simberg, Expert Opin. Drug Delivery, 2011, 8, 343 CrossRef CAS PubMed.
  31. S. Nagayama, K. Ogawara, K. Minato, Y. Fukuoka, Y. Takakura, M. Hashida, K. Higaki and T. Kimura, Int. J. Pharm., 2007, 329, 192 CrossRef CAS PubMed.
  32. K. Higashisaka, Y. Yoshioka, K. Yamashita, Y. Morishita, M. Fujimura, H. Nabeshi, K. Nagano, Y. Abe, H. Kamada, S. Tsunoda, T. Yoshikawa, N. Itoh and Y. Tsutsumi, Biomaterials, 2011, 32, 3 CrossRef CAS PubMed.
  33. Y. C. Cao, Nanomedicine, 2008, 3, 467 CrossRef PubMed.
  34. A. K. Mandal, M. Woodi, V. Sood, P. R. Krishnaswamy, A. Rao, S. Ballal and P. Balaram, Clin. Biochem., 2007, 40, 986 CrossRef CAS PubMed.
  35. J. C. Silva, M. V. Gorenstein, G. Z. Li, J. P. C. Vissers and S. J. Geromanos, Mol. Cell. Proteomics, 2005, 5, 144 Search PubMed.

Footnotes

Electronic supplementary information (ESI) available. See DOI: 10.1039/c5ra07724a
Authors share equal contribution.

This journal is © The Royal Society of Chemistry 2015