Magnetic ground state of nanosized β-Fe2O3 and its remarkable electronic features

Ondřej Malinaa, Jiří Tuček*a, Petr Jakubeca, Josef Kašlíka, Ivo Medříka, Hiroko Tokorob, Marie Yoshikiyob, Asuka Namaib, Shin-ichi Ohkoshib and Radek Zbořil*a
aRegional Centre of Advanced Technologies and Materials, Departments of Experimental Physics and Physical Chemistry, Faculty of Science, Palacky University, 17. listopadu 1192/12, 771 46 Olomouc, Czech Republic. E-mail: jiri.tucek@upol.cz; radek.zboril@upol.cz
bDepartment of Chemistry, School of Science, The University of Tokyo, 7-3-1 Hongo, Bunkyo-ku, Tokyo 113-0033, Japan

Received 24th April 2015 , Accepted 19th May 2015

First published on 19th May 2015


Abstract

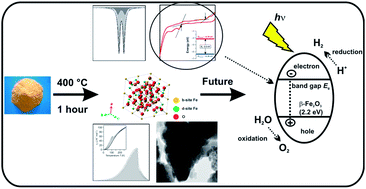
To date, iron oxides have been extensively investigated for promising high applicability in various scientific and industrial fields. In general, several forms can be distinguished with respect to their crystal structure, which drives their specific physical (in particular, magnetic) properties. In this study, the pure β-Fe2O3 phase, prepared in a nanoparticle form by a solid-state synthetic strategy, was investigated by employing 57Fe Mössbauer spectroscopy, magnetization measurements, transmission electron microscopy, X-ray powder diffraction, heat capacity measurements, and cyclic voltammetry. It is revealed that below the Néel transition temperature, β-Fe2O3 behaves as a canted antiferromagnet with a small net magnetic moment. For further possible utilization in photoelectrochemical applications, an estimation of the β-Fe2O3 band gap by cyclic voltammetry was performed, which was measured to be ∼2.2 eV.

Introduction

Iron oxides belong to a family of prominent materials that have been studied for decades. The interest in exploring them stems from the appealing physicochemical properties they exhibit.1 Among them, their electronic and magnetic features have roused eminent attention not only in the scientific world but have also inspired the development of novel applications and the introduction of new technologies in which these features play an irreplaceable role.1 Moreover, they show interesting biochemical properties (e.g., biodegradability, biocompatibility, and non-toxic characteristics) favourable for their exploitation in various biomedical fields where other materials can hardly compete with them.2,3 Moreover, when synthesized as nano-objects (nanoparticles, thin films, nanowires, and nanorods), they become equipped with new material characteristics (e.g., superparamagnetism) driven by finite-size and surface effects,4 remarkably extending their application potential.

Iron(III) oxide shows a polymorphism, a feature connected with the existence of two or more phases that are isochemical in nature but possess various physical behaviors, which originate from different crystal structures they possess.1,5–9 Apart from the amorphous Fe2O3 form, four crystalline iron(III) oxide phases are recognized so far:1,5–9 (i) α-Fe2O3 (hematite), (ii) β-Fe2O3, (iii) γ-Fe2O3 (maghemite), and (iv) ε-Fe2O3. The α-Fe2O3 and γ-Fe2O3 phases are the most frequently occurring polymorphs of iron(III) oxide; they can be readily found in nature and exist in both bulk and nanosized forms. Conversely, β-Fe2O3 and ε-Fe2O3 phases are rare forms with scarce abundance, which are stable only in nanosized dimensions. Upon heating, irreversible polymorphous transformations are commonly observed when β-Fe2O3, γ-Fe2O3, and ε-Fe2O3 transform directly or via intermediates (i.e., other iron(III) oxide polymorphs, existing in a certain temperature range) to α-Fe2O3 as the most thermodynamically stable iron(III) oxide form.5,10,11

β-Fe2O3 was first reported in the pioneering work of Bonnevie-Svensen in 1956.12 β-Fe2O3 shows a body-centered, cubic crystal structure of a bixbyite type with a lattice constant of a = 9.393 Å, which falls into the Ia[3 with combining macron] space group.5,7 The two crystallographically nonequivalent cation sites are recognized in the β-Fe2O3 crystal structure, i.e., the b-sites and d-sites, both occupied with Fe3+ ions in a high-spin state (S = 5/2). They differ in the degree of local symmetry;5,7 whereas cation b-sites show C3i symmetry, cation d-sites are describable in terms of C2 symmetry. In the β-Fe2O3 unit cell, there are three times the number of d-sites than b-sites (24 Fe3+ d-site cations and 8 Fe3+ b-site cations), with all sites filled and no vacant positions remaining.5,7,13,14 The difference in site symmetry implies the different distortion of cation polyhedron related to the b- and d-sites; that is, b-sites are more distorted than d-sites.5 The β-Fe2O3 phase is thermally unstable and in most cases, transforms directly into α-Fe2O3 when the temperature exceeds 500 °C.5,10 However, for β-Fe2O3 nanoparticles with hollow structures, a transformation to γ-Fe2O3 was observed, indicating the role of surface energy on phase stability.10,15 In our recent study, we have also shown the transformation of pure β-Fe2O3 nanoparticles in various ambient atmospheres, with some basic characterization of the resultant products.16

The optical measurement of β-Fe2O3 nanoparticles estimated the band gap to be from approximately 1.7 eV to 1.9 eV, depending on the morphology, which suggested that β-Fe2O3 is an insulator.17,18 From the magnetic ordering point of view, it is an antiferromagnetic material with a Néel temperature of ∼110–119 K.5,7 Thus, out of all iron(III) oxide polymorphs, it is the only phase that behaves paramagnetically at room temperature. This significantly limits its possible utilization in applications requiring either strong magnetic response under low external magnetic fields or stable magnetization without an external magnetic field. Nevertheless, the β-Fe2O3 phase has been proposed to be promising in the field of optoelectronics (suitable absorbance and transmittance features in the visible electromagnetic region),17 as a chloroform sensor19 or as anodes in lithium batteries for performance optimization.20 Recently, the β-Fe2O3 polymorph, prepared as a thin film, was also tested as an alternative iron oxide photocatalyst for photoassisted H2 production.21

Several reaction routes for the production of the β-Fe2O3 phase have been reported in the literature so far. The synthetic techniques employed include hydrolysis,12,22 solid-state decomposition of the suitable iron-containing precursor,5,23,24 chemical vapor deposition,15,17,20,25–33 spray pyrolysis,34 hydrothermal method,19,35 and microwave-assisted solvothermal route.36 As precursors, various substances have been used such as FeCl3,12,19,22,34–36 Fe2(SO4)3,23 Fe(F3CCOCHCOCH3)3,25 Fe(C5H7O2)3,15,17,26–28 Prussian blue,24 and iron(II) diketonate–diamine complexes.20,29–31 Currently, the β-Fe2O3 phase has been prepared in the form of spherical nanoparticles,34 cubic nanoparticles,24 nanoparticles with a hollow structure,15,17,27,28 nanopyramids,20,30,31 and thin films.21,25,26 However, most of the reaction routes reported so far provide β-Fe2O3 phases in low yields or in a mixture with other iron(III) oxide polymorphs (especially α-Fe2O3 and γ-Fe2O3).

In this study, we investigated the structural properties of the β-Fe2O3 phase through transmission electron microscopy and X-ray powder diffraction and physical properties through magnetic measurements and by means of zero-field and in-field 57Fe Mössbauer spectroscopy in paramagnetic and magnetically ordered state. Using 57Fe Mössbauer spectroscopy, we found physical parameters such as an effective vibrating mass, Debye temperature, and the value of the spin-flop transition field, and we propose the magnetic ground state below the Néel temperature. From the 57Fe Mössbauer spectroscopy perspective, all the obtained results complete the previously published data that have been collected for other iron(III) oxide polymorphs but not for the β-Fe2O3 phase. Moreover, we have also experimentally estimated a band gap by cyclic voltammetry to compare the results with a previously reported band gap suggested by optical measurements. The heat capacity measurement was performed to complete the magnetic ordering transition data, including magnetic transition enthalpy and entropy.

Experimental section

Material preparation

The β-Fe2O3 sample was prepared following the thermal decomposition of Fe2(SO4)3·5H2O in the presence of NaCl. The preparation method used has already been published, and the detailed description can be found elsewhere.23,37 Briefly, the Fe2(SO4)3·5H2O (purchased from Sigma-Aldrich) was mixed together with NaCl, and the powdered mixture was then annealed for 1 h at 400 °C.

Characterization techniques

Transmission electron microscopy (TEM) images were collected using a JEOL JEM-2010 electron microscope operating at 160 kV with a point-to-point resolution of 1.9 Å.

The X'Pert PRO MPD diffractometer (PANalytical) in Bragg–Brentano geometry was used to record the diffraction pattern of the prepared sample. The diffractometer operates with iron-filtered CoKα radiation (λ = 0.178901 nm). The pattern was recorded in the 2θ range of 5°–120° (2θ resolution of 0.017°). Commercially available SRM640 (Si) and SRM660 (LaB6) standards from NIST (National Institute of Standards and Technologies) were used to evaluate line positions and instrumental line broadening, respectively. The crystalline phase identification and Rietveld refinement were performed by employing High Score Plus (PANalytical) software in conjunction with the PDF-4+ and ICSD databases.

A superconducting quantum interference device (SQUID, MPMS XL-7, Quantum Design) was used for the magnetization measurements. The temperature dependence of the magnetization was recorded in a sweep mode of 1.5 K min−1 in zero-field-cooled (ZFC) and field-cooled (FC) measuring regimes. To obtain ZFC magnetization, the sample was cooled from 300 to 5 K in a zero magnetic field, and the measurement was carried out on warming from 5 to 300 K under an external magnetic field (0.1 T). In the case of the FC magnetization measurements, the sample was cooled from 300 to 5 K under an external magnetic field (0.1 T), and the measurement was carried out on warming from 5 to 300 K at the same value of the external magnetic field (0.1 T). The heat capacity (Cp) measurement was conducted through a relaxation method using a Quantum Design 6000 physical property measurement system (PPMS). The powder sample for the Cp measurements was pressed into a pellet. The thermal contact between the sample and sample platform was assured by Apiezon N grease.

The zero-field 57Fe Mössbauer spectra were obtained in a broad temperature range from 5 to 300 K by employing a Mössbauer spectrometer operating in a constant acceleration mode and equipped with a 50 mCi 57Co(Rh) source.38–40 The values of the isomer shift are attributed to α-Fe at room temperature. For the in-field 57Fe Mössbauer measurements, the sample was placed in a cryomagnetic system (Oxford Instruments) and exposed to various external magnetic fields, in parallel orientation to the γ-ray propagation. All of the acquired Mössbauer spectra were fitted using the MossWinn software.41

For cyclic voltammetry, all electrochemical experiments were performed using a PGSTAT128N potentiostat (Metrohm Autolab B.V.) monitored by the NOVA software. A conventional three-electrode cell configuration was employed. A β-Fe2O3-modified glassy carbon electrode (GCE) was used as the working electrode, with an Ag/Ag+ electrode and platinum wire as the reference and counter electrodes, respectively; 0.1 mol L−1 tetrabutylammonium hexafluorophosphate (NBu4PF6) dissolved in acetonitrile was employed as a supporting electrolyte. The GCE surface was modified with β-Fe2O3 by a drop-coating method: a 10 μL drop of β-Fe2O3 (2.5 g L−1) was coated onto the GCE surface and allowed to dry at ambient temperature to form a thin film. All experiments were carried out at room temperature.

Results and discussion

Size, structural and magnetic characterization

TEM images of the pure β-Fe2O3 sample (see Fig. 1a and b) revealed that the system contains nanoparticles of two distinct size classes. It is revealed that the two size fractions are well described (employing the χ2-test performed on a 99% statistical confidence level) in terms of log-normal distribution curves with average particle sizes of 14.3 and 51.1 nm and log-normal standard deviations of 0.34 and 0.41, respectively (see Fig. 1c).
image file: c5ra07484c-f1.tif
Fig. 1 (a and b) TEM images showing the fractions of smaller and larger β-Fe2O3 nanoparticles and (c) particle-size distribution derived from TEM images, in which bars correspond to experimentally observed nanoparticle sizes and the red curve represents the best theoretical fit employing two log-normal distribution curves.

The purity of the as prepared β-Fe2O3 sample was also characterized by means of X-ray powder diffraction (XRD), see Fig. 2a. All of the observed diffraction lines correspond to well-crystallized β-Fe2O3 (PDF collection code: 04-003-1027, lattice constant a = 9.42(5) Å and space group Ia[3 with combining macron]) without any experimentally detectable admixtures of other Fe2O3 polymorphs.


image file: c5ra07484c-f2.tif
Fig. 2 (a) XRD pattern of the prepared sample with all of the peaks corresponding to β-Fe2O3; the major XRD peak was detected at 2θ = 38.55°, whereas the second was observed at 2θ = 65.19°; (b) ZFC and FC magnetization measurements under 0.1 T; (c) temperature evolution of the reciprocal molar susceptibility and extrapolation of the Curie–Weiss law.

The macroscopic magnetic response of the prepared sample was studied by measuring the ZFC and FC magnetization curves (see Fig. 2b). A maximum response occurring at ∼112 K is clearly observed in both curves, which corresponds well to the Néel temperature (TN) of β-Fe2O3, a magnetic ordering transition temperature from paramagnetic to antiferromagnetic state. Above TN, the FC magnetization curve shows good correlation with the well-known Curie–Weiss law. The fit of the experimental data (Fig. 2c) yields a Weiss temperature value (θWeiss) and Curie constant (C) equal to −757 K and 104 × 10−6 m3 mol−1, respectively. The θWeiss value was obtained as an extrapolation from the smooth curve through the experimental points (Fig. 2c), and its negative value (negative intercept) corresponds to the presence of antiferromagnetic exchange interactions between neighboring iron magnetic moments as expected for an antiferromagnetic material.

The results of the experimentally determined θWeiss value follows published reports; θWeiss values in antiferromagnets are very often a long way from TN.42 Below TN, despite general assumptions valid for antiferromagnetic materials, there is no continuous decrease in magnetization with a decrease in temperature. However, there is a change in the slope in the temperature evolution of magnetization around ∼41 K due to the presence of either temperature-driven magnetic transition or structural change. To the best of our knowledge, there are no observation of any low-temperature magnetic transition (LTMT) in β-Fe2O3 system or publication of any experimental and theoretical suggestions for possible LTMT occurrence as reported in other antiferromagnetic systems.43 Based on XRD and magnetization measurement results, the two possible explanations are suggested. First, the situation appears similar to the study of low-temperature magnetic behavior in an antiferromagnetic alabandite (α-MnS) system, in which oxidation produces very low concentrations of ferrimagnetic hausmannite (Mn3O4) impurity on α-MnS grain surfaces. The impurity (Mn3O4) then governs the magnetic response of the aforementioned system below its Curie temperature (TC ∼ 40 K), modifying its temperature magnetization behavior.44 In the case of the β-Fe2O3 system, we assume that the sign of transition occurring at ∼41 K could reflect the presence of impurity, which is, however, negligible (i.e., below the detection limit of XRD and 57Fe Mössbauer spectroscopy). The second proposal of unusual magnetic behaviour around ∼41 K is based on magnetic measurement results, as well as from the in-field 57Fe Mössbauer spectroscopy (see below). As previously mentioned, slope change is observed only for FC magnetization, which suggests the effect of the external magnetic field on magnetic behaviour. It appears that the spin arrangement is not precisely in an antiparallel orientation, and the β-Fe2O3 phase behaves as a canted antiferromagnetic material below the Néel temperature. This is also encouraged by the calculation of the net magnetic moment, which is equal to 0.0026 μB per Fe cation. The results are in good agreement with in-field 57Fe Mössbauer spectroscopy measurements (see below).

Fig. 3 shows the Cp vs. T plot during the cooling process. As temperature decreases, the Cp value monotonically decreases, and a peak is observed at ∼110 K. The Cp value is described as the sum of the contributions from lattice vibration, Clat, and magnetic ordering, Cmag: Cp = Clat + Cmag. To estimate Clat, we carried out curve fitting of the observed Cp plots with the equation based on the Debye model. The solid line in the inset of Fig. 3 shows the Clat curve. The Cmag is obtained by subtracting Clat from Cp (shadow area in Fig. 3). The magnetic transition enthalpy, ΔHmag (= ∫CmagdT), and magnetic transition entropy, ΔSmag (= ∫Cmagdln[thin space (1/6-em)]T), are estimated as ΔHmag = 1.8 kJ mol−1 and ΔSmag = 23 J K−1 mol−1. By considering the magnetic ion in β-Fe2O3 as the classical Fe3+ (S = 5/2), the theoretical value of ΔSmag per formula is calculated as ΔSmag = 8.31 × ln[thin space (1/6-em)]62 = 29.8 J K−1 mol−1, which is roughly close to the experimental value.


image file: c5ra07484c-f3.tif
Fig. 3 Cmag vs. log[thin space (1/6-em)]T plot of β-Fe2O3 at zero external magnetic field during the cooling process. (Inset) Cp (circles) and calculated lattice vibration Clat (black line) vs. T plot. The shadowed area indicates the contribution of the magnetic heat capacity, Cmag.

57Fe Mössbauer spectroscopy and ground magnetic state determination

To obtain a deeper view into the temperature dependence of the physical properties of the β-Fe2O3 sample, we collected 57Fe Mössbauer spectra in the paramagnetic region with in a wide temperature range from 120 K to room temperature. At these temperatures, the spectral profile can be decomposed to the two doublet components (see, for example, the zero-field Mössbauer spectrum at room temperature in Fig. 4 and Table S1 in ESI) corresponding to the two crystallographically nonequivalent iron cation sites, i.e., the b-sites and d-sites, both occupied by Fe3+ ions in high-spin states (S = 5/2). The spectral-area ratio of the two doublets is ideally equal to 1[thin space (1/6-em)]:[thin space (1/6-em)]3, reflecting the number of b-sites and d-sites in the β-Fe2O3 crystal structure.7 All the Mössbauer spectra above the Néel transition temperature were fitted according to the same model, assuming that (i) the spectral area is very close to 1[thin space (1/6-em)]:[thin space (1/6-em)]3 between the b-sites and the d-sites and (ii) the values of the line width corresponding to the b-sites and the d-sites are not the same but close to each other.
image file: c5ra07484c-f4.tif
Fig. 4 Zero-field 57Fe Mössbauer spectrum at room temperature.

The temperature dependence of the isomer shift (δ) and quadrupole splitting (ΔEQ) was derived from the recorded Mössbauer spectra. It can be clearly evidenced from the Mössbauer hyperfine parameters listed in Table S1 in ESI that there is no strong ΔEQ temperature dependence in either Fe3+ site. In general, we distinguish two main sources of an electrical-field gradient (EFG) tensor having distinct temperature dependences. The first source is strongly temperature dependent and comes from the valence electron contribution, (Vzz)val, associated with an anisotropic electron distribution in the valence shell of the probed Mössbauer atom. On the other hand, the second is related to the lattice contribution, (Vzz)lat, and is hardly affected by temperature. Note that the second source arises from the electrical charge of atoms surrounding the Mössbauer-active atoms. Thus, in the case of β-Fe2O3 nanoparticles, (Vzz)lat seems to be the main source to the EFG tensor in the β-Fe2O3 system for both sites as we observe no or very weak temperature dependence of ΔEQ at both cation sites (see Table S1 in ESI).

Considering the temperature evolution of δ and classical high-temperature limit (eqn (1)), we can calculate the effective vibrating mass (Meff) for both sites following the expression (see Table S2 in ESI)45,46

 
image file: c5ra07484c-t1.tif(1)
where T represents temperature, Eγ is the energy of the Mössbauer gamma photon, kB denotes the Boltzmann constant, Meff stands for the effective vibrating mass, and c corresponds to the speed of light. By using the high-temperature limit, Meff was evaluated to be equal to 79 amu and 72 amu for the b-sites and d-sites, respectively.

Furthermore, an area, A(T), under the absorption resonance curve of a Mössbauer spectrum is connected with the recoil-free fraction, f(T);47 the f(T) temperature evolution follows the A(T) temperature behavior provided by (see Table S2 in ESI)

 
image file: c5ra07484c-t2.tif(2)

If the value of Meff is determined and the high-temperature limit of the recoil-free fraction as well as the relation between A(T) and f(T) (eqn (2)) are considered, then the Debye temperature (ΘD) can be evaluated for both cation sites as a strength of the bonds between the lattice and the probed Mössbauer atom (ESI Table S2), i.e.,

 
image file: c5ra07484c-t3.tif(3)
where ER represents the recoil energy. It follows that ΘD is 167 K and 175 K for the b-sites and d-sites, respectively.

The Mössbauer spectra of the studied sample, measured in a temperature range from 20 to 110 K, are shown in Fig. 5; the values of the Mössbauer hyperfine parameters, derived from the analyses of the collected Mössbauer spectra, are listed in Table S1 in ESI. At 20 K, the spectral profile is well deconvoluted by the two sextet components differing markedly in the quadrupole splitting (ΔEQ) and hyperfine magnetic field (Bhf) values. The presence of the two magnetically split components reflects the two crystallographically nonequivalent Fe3+-occupied cation sites, i.e., the b-sites and d-sites. The spectral-area ratios of the two components corresponding to the b-sites and the d-sites is very close to 1[thin space (1/6-em)]:[thin space (1/6-em)]3, following the occupation of individual cation positions in the β-Fe2O3 crystal structure. Thus, the low-temperature measurement again confirmed that all cation sites are fully filled, excluding any presence of vacancies. The non-zero value of the ΔEQ parameter implies deviation from the spherical symmetry of the local surroundings, driven both by structural arrangement and by electron charge distribution. The difference in ΔEQ value observed for the b-sites and d-sites originates from a distinct degree of symmetry around the probed Mössbauer atoms. It is well known that the b-sites exhibit a higher distortion level, compared with that of the d-sites.7 At the b-sites, the Bhf value is higher than that found at the d-sites. On increasing the temperature, the magnetically split spectral profile is preserved up to a temperature of 100 K, above which the spectrum collapses into doublets. At both sites, the decrease in Bhf (see Fig. S1a in ESI) follows the Brillouin S = 5/2 function as expected, taking into account the spin state of iron cations. Note that the decrease in Bhf with temperature is not identical due to the different number of the nearest neighbors at each site.48 Contrary to the paramagnetic region (above 120 K), when the ΔEQ parameter is temperature independent for both sites in the magnetically ordered state (below 120 K), we observe a monotonous increase in ΔEQ for the b-sites (in the case of the d-sites, no practical change with the temperature is observed; see Fig. S1b in ESI). This implies a change in the symmetry of the local surroundings.


image file: c5ra07484c-f5.tif
Fig. 5 Temperature evolution of the zero-field 57Fe Mössbauer spectra for the prepared β-Fe2O3 sample, measured in a temperature range from 20 to 120 K.

At 110 K, the Mössbauer spectrum consists of doublet and sextet components; the sextet is fitted with hyperfine magnetic-field distribution, which indicates the collapse of the magnetically ordered state (see Fig. 5). The appearance of the relaxation component at 80 and 100 K (see Fig. 5) is connected with the onset of the magnetic transition due to the increasing fluctuations of the cation magnetic moments around the particular easy axis of magnetization.

Moreover, we performed the in-field 57Fe Mössbauer experiments in parallel geometry to monitor the magnetic behaviour of the β-Fe2O3 phase at low temperatures and under external magnetic fields. The in-field Mössbauer spectra of β-Fe2O3, measured at a temperature of 5 K and under various inductions of the external magnetic field ranging from 0 to 8 T, are depicted in Fig. 6; the values of the Mössbauer hyperfine parameters, derived from the spectra fitting, are summarized in Table S1 in ESI.


image file: c5ra07484c-f6.tif
Fig. 6 The in-field 57Fe Mössbauer spectra of the prepared β-Fe2O3 sample.

The Mössbauer spectrum recorded at 5 K and without an induction of the external magnetic field is comparable with that measured at 20 K (see Fig. 6 and Table S1 in ESI), as well as the Mössbauer spectra recorded at 5 K and under 1 T and 2 T fields. The two sextets are still resolved having the spectral-area ratio of 1[thin space (1/6-em)]:[thin space (1/6-em)]3, corresponding to b-sites and d-site occupation by Fe3+ ions. However, in external magnetic fields of 3.5 and 5 T, the spectral profile is completely changed. The two sextets are observed again but with the spectral-area ratio close to 1[thin space (1/6-em)]:[thin space (1/6-em)]1. Moreover, the values of the ΔEQ parameter for both sextets are different from those derived for the two sextets related to the crystallographically nonequivalent sites. This implies that under 3.5 T, the magnetically split components observed belong to the two magnetic sublattices (denoted as A-sublattice and B-sublattice) evolved after spin-flop transition. Thus, for β-Fe2O3, the field-induced spin-rearrangement phenomenon, typically occurring in antiferromagnetic materials, occurs somewhere in the range of external magnetic fields from 2 T to 3.5 T. In other words, the b-sites and d-sites do not represent magnetic sublattices; the A-sublattice consists of 2/3 of d-sites, and the B-sublattice is composed of all of the b-sites and remaining d-sites.

To further explain the identification of cation positions belonging to a particular sublattice, the Mössbauer spectra under 5 T and 8 T were recorded. For Fe3+ ions, it is well accepted that the hyperfine magnetic field is given only by the negative Fermi contact term; the dipolar and orbital terms are equal to zero.46 Thus, an Fe3+ magnetic moment lies exactly in the opposite direction with respect to the hyperfine magnetic-field orientation. Assuming that the intensities of the second and fifth Mössbauer resonant lines are given as A2,5 = (4sin2(θ))/(1 + cos2(θ)),46 where θ is the angle of the (effective) hyperfine magnetic field oriented along the direction of γ-rays propagation, a vector diagram can be constructed showing the magnetization orientation in a particular magnetic sublattice.49 It can be clearly observed from Fig. 7a that under 5 T, β-Fe2O3 does not behave as an ideal antiferromagnetic material; the angle between sublattice magnetizations is not equal to 180°, providing a net moment of the magnetic structure equal to 0.0033 μB per cation. This value is in good accordance with the net magnetic moment derived from magnetization measurements. Thus, β-Fe2O3 orders as a canted antiferromagnet below the Néel transition temperature. If stronger magnetic field is applied (8 T; see Fig. 7b), three spectral components are resolved (see Fig. 6). From the spectral analysis, it is revealed that the d-sites forming the B-sublattice magnetically decouple from the b-sites in the B-sublattice, further proof of β-Fe2O3 magnetic structural non-colinearity.


image file: c5ra07484c-f7.tif
Fig. 7 Vector diagram demonstrating the magnetic moment orientations of Fe atoms at individual β-Fe2O3 crystal sites as derived from analysis of the (a) 5 K/5 T 57Fe Mössbauer and (b) 5 K/8 T 57Fe Mössbauer spectra.

Estimation of band gap

For the design of novel electronic devices, it is necessary to determine the absolute energy-level locations of both conduction and valence bands.50 It is very well known that cyclic voltammetry (CV) can be used for the determination of band gaps, as well as that of conduction (EedgeCB) and valence band-edge (EedgeVB) energy levels, respectively.51,52 The onset potentials of the studied material can be determined from the intersection of the two tangents drawn at the rising and baseline-charging currents of the CV record (see Fig. 8). It can be observed in Fig. 8 that during the CV scan, β-Fe2O3 undergoes irreversible electron exchange at around −0.5 V and 1.6 V.
image file: c5ra07484c-f8.tif
Fig. 8 Cyclic voltammogram of β-Fe2O3-modified GCE in an acetonitrile solution containing 0.1 mol L−1 tetrabutylammonium hexafluorophosphate (NBu4PF6) as a supporting electrolyte (arrows indicate where the onsets of the oxidation and reduction peaks are); conditions: three-electrode cell (GCE, working electrode, Pt, counter electrode, Ag/Ag+, reference electrode) and scan rate: 100 mV s−1. Inset: energy band diagram.

The band edge can be calculated from the onset oxidation potential (Eonsetox) and onset reduction potential (Eonsetred), according to the following equations:53

 
EedgeCB = −Ip = −(Eonsetox + 4.71)eV, (4)
 
EedgeVB = −Ea = −(Eonsetred + 4.71)eV, (5)
where Ip is an ionization potential correlated to Eonsetox, and Ea is an electron affinity corresponding with Eonsetred. From Fig. 8, it is obvious that the reduction peak occurs at around −0.5 V, and therefore, EedgeVB can be estimated to be −4.16 eV. An oxidation peak can be observed around 1.6 V, and thus, EedgeVB can be estimated to be −6.36 eV. The energy band gap (Eg) can then be calculated, resulting in the value of 2.2 eV. For the characterization of reproducibility, five different electrodes were modified and subsequently tested. Relative standard deviation (R.S.D.) as the average value of five measurements of β-Fe2O3 was found to be 1.7%.

The band gap value experimentally determined by cyclic voltammetry is highly similar to that of hematite. Due to these interesting results, β-Fe2O3 nanoparticles can be considered as suitable materials for photoelectrochemical water-splitting reactions.

Conclusions

In the present study, we examined the structural and physicochemical properties of a pure β-Fe2O3 phase with following conclusions:

(i) From the magnetic temperature behaviour and Curie–Weiss law, we calculated the Weiss temperature and the Curie constant to be equal to −757 K and 104 × 10−6 m3 mol−1, respectively. Note that the Néel temperature for the highly pure β-Fe2O3 phase was found to be ∼112 K. To precisely determine the transition information of the magnetically ordered state, we also performed heat capacity measurements. Measured data reveals magnetic transition enthalpy and entropy values to be equal to ΔHmag = 1.8 kJ mol−1 and ΔSmag = 23 J K−1 mol−1, respectively.

(ii) The zero-field 57Fe Mössbauer spectra collected in the paramagnetic regime, i.e., above ∼112 K, were used to determine the Debye temperature (effective vibrating mass) to be equal to 167 K (79 amu) and 175 K (72 amu) for the b-sites and d-sites, respectively. In addition, the lattice contribution, (Vzz)lat, arising from the electric charges of atoms surrounding the Mössbauer-active atoms were identified as a main source of the EFG tensor for both crystallographically nonequivalent cation sites (i.e., Fe3+ sites) in the β-Fe2O3 phase.

(iii) From the in-field 57Fe Mössbauer spectra up to 8 T, the spin-flop transition field was found to be between 2 and 3.5 T for the β-Fe2O3 phase. Below 2 T, the 57Fe Mössbauer spectra reflect the arrangements of Fe3+ cations in the two crystallographically nonequivalent cation positions. On the other hand, above 3.5 T, β-Fe2O3 magnetic sublattices are clearly identified with an A-sublattice formed by 2/3 of the d-sites, and a B-sublattice composed of 1/3 of the d-sites and all of the b-sites. The β-Fe2O3 magnetic structure is not collinear, and thus β-Fe2O3 behaves as a canted antiferromagnet with a non-zero net magnetic moment as evidenced from Mössbauer analysis and magnetization measurements.

(iv) The cyclic voltammetry measurements reveal the value of the band gap amounting to ∼2.2 eV, which is not identical from that estimated by optical measurements. Conversely, the estimated band-gap value and valence band-edge positions predestinate β-Fe2O3 as a convenient and promising material for the conversion of solar energy to chemical fuel.

Acknowledgements

The authors gratefully acknowledge the support from the Ministry of Education, Youth and Sports of the Czech Republic (LO1305), the LH-KONTAKT II research project (LH12079 of the Ministry of Education, Youth and Sports of the Czech Republic), the Education for Competitiveness Operational Program—European Social Fund (CZ.1.07/2.3.00/20.0155 and CZ.1.07/2.3.00/20.0058 of the Ministry of Education, Youth and Sports of the Czech Republic), the Internal IGA grant of the Palacký University in Olomouc (IGA_PrF_2015_017), CREST of JST, and JSPS KAKENHI 15H05697.

Notes and references

  1. R. M. Cornell and U. Schwertmann, The Iron Oxides, WILEY-VCH, Weinheim, 2nd edn, 2000 Search PubMed.
  2. A. K. Gupta and M. Gupta, Biomaterials, 2005, 26, 3995–4021 CrossRef CAS PubMed.
  3. S. Laurent, D. Forge, M. Port, A. Roch, C. Robic, L. Vander Elst and R. N. Muller, Chem. Rev., 2008, 108, 2064–2110 CrossRef CAS PubMed.
  4. J. L. Dormann, D. Fiorani and E. Tronc, Magnetic Relaxation of Fine Particle Systems, in Advances in Chemical Physics, ed. I. Prigogine and S. A. Rice, John Wiley, New York, 1997, vol. 98, pp. 283–494 Search PubMed.
  5. R. Zboril, M. Mashlan and D. Petridis, Chem. Mater., 2002, 14, 969–982 CrossRef CAS.
  6. J. Tuček, R. Zbořil, A. Namai and S. Ohkoshi, Chem. Mater., 2010, 22, 6483–6505 CrossRef.
  7. J. Tuček, P. Tuček, J. Čuda, J. Filip, J. Pechoušek, L. Machala and R. Zbořil, AIP Conf. Proc., 2012, 1489, 56–74 Search PubMed.
  8. J. Jin, S. Ohkoshi and K. Hashimoto, Adv. Mater., 2004, 16, 48–51 CrossRef CAS PubMed.
  9. A. Namai, M. Yoshikiyo, K. Yamada, S. Sakurai, T. Goto, T. Yoshida, T. Miyazaki, M. Nakajima, T. Suemoto, H. Tokoro and S. Ohkoshi, Nat. Commun., 2012, 3, 1035 CrossRef PubMed.
  10. L. Machala, J. Tuček and R. Zbořil, Chem. Mater., 2011, 23, 3255–3272 CrossRef CAS.
  11. S. Sakurai, A. Namai, K. Hashimoto and S. Ohkoshi, J. Am. Chem. Soc., 2009, 131, 18299–18303 CrossRef CAS PubMed.
  12. M. B. Svendsen, Naturwissenschaften, 1958, 45, 542 CrossRef.
  13. T. Danno, D. Nakatsuka, Y. Kusano, H. Asaoka, M. Nakanishi, T. Fujii, Y. Ikeda and J. Takada, Cryst. Growth Des., 2013, 13, 770–774 CAS.
  14. P. Brázda, J. Kohout, P. Bezdička and T. Kmječ, Cryst. Growth Des., 2014, 14, 1039–1046 Search PubMed.
  15. C.-W. Lee, S.-S. Jung and J.-S. Lee, Mater. Lett., 2008, 62, 561–563 CrossRef CAS PubMed.
  16. O. Malina, J. Kaslik, J. Tucek, J. Cuda, I. Medrik and R. Zboril, AIP Conf. Proc., 2014, 96, 89–96 Search PubMed.
  17. C. W. Lee, K. W. Lee and J. S. Lee, Mater. Lett., 2008, 62, 2664–2666 CrossRef CAS PubMed.
  18. G. Carraro, R. Sugrañez, C. Maccato, A. Gasparotto, D. Barreca, C. Sada, M. Cruz-yusta and L. Sánchez, Thin Solid Films, 2014, 564, 121–127 CrossRef CAS PubMed.
  19. M. M. Rahman, A. Jamal, S. B. Khan and M. Faisal, Superlattices Microstruct., 2011, 50, 369–376 CrossRef CAS PubMed.
  20. G. Carraro, D. Barreca, M. Cruz-Yusta, A. Gasparotto, C. Maccato, J. Morales, C. Sada and L. Sánchez, ChemPhysChem, 2012, 13, 3798–3801 CrossRef CAS PubMed.
  21. G. Carraro, C. Maccato, A. Gasparotto, T. Montini, S. Turner, O. I. Lebedev, V. Gombac, G. Adami, G. Van Tendeloo, D. Barreca and P. Fornasiero, Adv. Funct. Mater., 2014, 24, 372–378 CrossRef CAS PubMed.
  22. A. Kumar and A. Singhal, Mater. Chem. Phys., 2011, 131, 230–240 CrossRef CAS PubMed.
  23. R. Zboril, M. Mashlan, V. Papaefthymiou and G. Hadjipanayis, J. Radioanal. Nucl. Chem., 2003, 255, 413–417 CrossRef CAS.
  24. L. Machala, G. Zoppellaro, J. Tuček, K. Šafářová, Z. Marušák, J. Filip, J. Pechoušek and R. Zbořil, RSC Adv., 2013, 3, 19591 RSC.
  25. L. Ben-Dor, E. Fischbein, I. Felner and Z. Kalman, J. Electrochem. Soc., 1977, 124, 451 CrossRef CAS PubMed.
  26. T. Maruyama and T. Kanagawa, J. Eur. Ceram. Soc., 1996, 143, 1675–1677 CAS.
  27. J. S. Lee, S. S. Im, C. W. Lee, J. H. Yu, Y. H. Choa and S. T. Oh, J. Nanopart. Res., 2004, 6, 627–631 CrossRef CAS.
  28. C. W. Lee, S. Kim and J. S. Lee, Key Eng. Mater., 2006, 317–318, 219–222 CrossRef CAS.
  29. D. Barreca, G. Carraro, A. Devi, E. Fois, A. Gasparotto, R. Seraglia, C. Maccato, C. Sada, G. Tabacchi, E. Tondello, A. Venzo and M. Winter, Dalton Trans., 2012, 149 RSC.
  30. G. Carraro, D. Barreca, E. Comini, A. Gasparotto, C. Maccato, C. Sada and G. Sberveglieri, CrystEngComm, 2012, 14, 6469 RSC.
  31. G. Carraro, D. Barreca, C. Maccato, E. Bontempi, L. E. Depero, C. de Julián Fernández and A. Caneschi, CrystEngComm, 2013, 15, 1039 RSC.
  32. D. Barreca, G. Carraro, A. Gasparotto, C. Maccato, C. Sada, A. P. Singh, S. Mathur, A. Mettenbörger, E. Bontempi and L. E. Depero, Int. J. Hydrogen Energy, 2013, 38, 14189–14199 CrossRef CAS PubMed.
  33. G. Carraro, A. Gasparotto, C. Maccato, E. Bontempi, F. Bilo, D. Peeters, C. Sada and D. Barreca, CrystEngComm, 2014, 16, 8710 RSC.
  34. T. Gonzalez-Carreno, M. P. Morales and C. J. Serna, J. Mater. Sci. Lett., 1994, 13, 381–382 CrossRef CAS.
  35. M. M. Rahman, A. Jamal, S. B. Khan and M. Faisal, J. Nanopart. Res., 2011, 13, 3789–3799 CrossRef CAS.
  36. S. I. S. Ramya and C. K. Mahadevan, Mater. Lett., 2012, 89, 111–114 CrossRef CAS PubMed.
  37. R. Zboril, M. Mashlan, D. Krausova and P. Pikal, Hyperfine Interact., 1999, 120/121, 497–501 CrossRef CAS.
  38. J. Pechousek, D. Jancik, J. Frydrych, J. Navarik and P. Novak, Mössbauer Spectroscopy in Materials Science, 2012, vol. 1489, pp. 186–193 Search PubMed.
  39. J. Pechousek, R. Prochazka, D. Jancik, J. Frydrych and M. Mashlan, J. Phys.: Conf. Ser., 2010, 217, 012006 CrossRef.
  40. P. Novak, J. Pechousek, O. Malina, J. Navarik and L. Machala, AIP Conf. Proc., 2014, 67, 67–71 Search PubMed.
  41. Z. Klencsár, E. Kuzmann and A. Vértes, J. Radioanal. Nucl. Chem., 1996, 210, 105–118 CrossRef.
  42. S. Blundell, Magnetism in Condensed Matter, Oxford University Press Inc., New York, 1st edn, 2001 Search PubMed.
  43. J. Cuda, T. Kohout, J. Tucek, J. Haloda, J. Filip, R. Prucek and R. Zboril, J. Geophys. Res.: Solid Earth, 2011, 116, 1–9 Search PubMed.
  44. J. Čuda, T. Kohout, J. Filip, J. Tuček, A. Kosterov, J. Haloda, R. Skala, E. Santala, I. Medrik and R. Zbořil, Am. Mineral., 2013, 98, 1550–1556 CrossRef.
  45. Y. L. Chen and D. P. Yang, Mossbauer effect in lattice dynamics, WILEY-VCH, Weinheim, 2007 Search PubMed.
  46. N. N. Greenwood and T. C. Gibb, Mössbauer spectroscopy, Chapman & Hall Ltd., London, UK, 1971 Search PubMed.
  47. J. Cuda, R. Zboril, O. Schneeweiss, J. Tucek, V. Prochazka, M. Maslan and P. Tucek, AIP Conf. Proc., 2010, 1258, 55–67 CAS.
  48. E. R. Bauminger, L. Ben-Dor, I. Felner, E. Fischbein, I. Nowik and S. Ofer, Phys. B, 1977, 86–88, 910–912 CrossRef.
  49. J. Tucek, S. Ohkoshi and R. Zboril, Appl. Phys. Lett., 2011, 99, 100–103 CrossRef PubMed.
  50. B. Radisavljevic, A. Radenovic, J. Brivio, V. Giacometti and A. Kis, Nat. Nanotechnol., 2011, 6, 147–150 CrossRef CAS PubMed.
  51. S. K. Haram, A. Kshirsagar, Y. D. Gujarathi, P. P. Ingole, O. A. Nene, G. B. Markad and S. P. Nanavati, J. Phys. Chem. C, 2011, 115, 6243–6249 CAS.
  52. S. N. Inamdar, P. P. Ingole and S. K. Haram, ChemPhysChem, 2008, 9, 2574–2579 CrossRef CAS PubMed.
  53. J. Li, H. Zhong, H. Liu, T. Zhai, X. Wang, M. Liao, Y. Bando, R. Liu and B. Zou, J. Mater. Chem., 2012, 22, 17813 RSC.

Footnote

Electronic supplementary information (ESI) available: Temperature evolution of the hyperfine magnetic field and quadrupole-splitting parameter for both crystallographically non-equivalent sites, values of the Mössbauer hyperfine parameters derived from spectral fitting, and values of the effective mass of the Mössbauer probed atom and Debye temperature. See DOI: 10.1039/c5ra07484c

This journal is © The Royal Society of Chemistry 2015
Click here to see how this site uses Cookies. View our privacy policy here.