Multi-layered graphene quantum dots derived photodegradation mechanism of methylene blue

Sima Umraoa, Poornima Sharmaa, Anushka Bansalb, Ranjna Sinhac, Ranjan K. Singha and Anchal Srivastava*a
aDepartment of Physics, Banaras Hindu University, Varanasi-221005, India. E-mail: anchalbhu@gmail.com; Tel: +91 542 2307 308
bDepartment of Metallurgical Engineering, Indian Institute of Technology-B. H. U., Varanasi, 221005, India
cNational Bureau of Fish Genetic Resources, Lucknow, India

Received 22nd April 2015 , Accepted 1st June 2015

First published on 2nd June 2015


Abstract

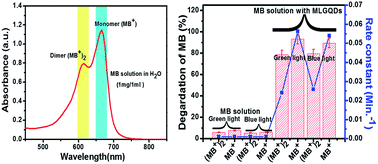
The photocatalytic degradation of methylene blue (MB) under visible light in the presence of a multi-layered graphene quantum dots (MLGQDs) photocatalyst has been investigated in aqueous heterogeneous solution. The photodegradation mechanism, following pseudo first order kinetics, was examined for the effects of the existing monomer (MB+)–dimer {(MB+)2} equilibrium in MB solution. The photocatalytic degradation efficiency of MB+ achieved 93.3% with a rate constant (k) of 0.056 min−1 after 60 min irradiation with green light, while less degradation ∼ 89.44% with k ∼ 0.024 min−1, was achieved for (MB+)2. MB+ is perhaps a short-lived species and favors the photodegradation of MB in comparison to the (MB+)2 species. Similar trends have been found under blue light irradiation. MB+ species easily pulls a proton from the functional groups of MLGQDs, resulting in an intermediate product Luco-methylene blue (LMB). Finally, all MB species and intermediate products degrade into an environmental benign product via highly reactive OH radicals. In addition, our ab initio theoretical results reveals that monomers abstract a proton from hydroxyl groups of MLGQDs and formation of LMB takes place, which is weakly bonded with MLGQDs by hydrogen bonds.

Introduction

In recent years, heterogeneous photocatalysis has emerged as an advanced green technology due to its potential to purify wastewater that is discharged from industries.1 Heterogeneous photocatalysts offer great potential for generating reactive oxygen species (like OH free radicals) and therefore decompose organic contaminants. Organic contaminants, once released into the aquatic ecosystem, can generate numerous environmental problems such as suppressing light penetration, affect photosynthesis and adversely affecting aquatic biota.2,3 Unfortunately, deep colored methylene blue (MB) dye is discharged widely in wastewater from dyeing, feather, textile, and any other industries and the existence of MB in water can cause virulent eye irritation, nausea, vomiting and diarrhoea.2,4,5

To date, a large variety of traditional heterogeneous photocatalysts, such as transition metal oxides semiconductors (e.g. TiO2) including their hybrids with noble metals, quantum dots, non-metal doped semiconductors, carbon nanotubes and graphene derivatives, have been used for the photodegradation of MB in effluents under UV and visible light irradiation1,5–25 However, in the above studies, none have focused on the degradation mechanism of MB. There is a need to find a new class of low cost photocatalysts which show high efficiency, a high rate constant, enhanced absorption of irradiated light, and better absorption of organic molecules. The photodegradation and mechanism of MB is still not explored fully due to its better stability and its dimer formation in water.26

Recently, owing to the high specific surface area of semiconductor quantum dots (zero dimension), there have been numerous efforts to enhance the catalytic performance of these quantum dots.17,19 A high surface area of photocatalyst is of great significance to increase absorption of organic dye and photodegradation rate because the photocatalytic reaction occurs at the surface of the catalyst. Nowadays, graphene quantum dots (GQDs) have been receiving much attention as a new class of co-catalysts,27–29 which could potentially offer desirable reactive oxygen species for enhancing photocatalytic efficiency. Graphene quantum dots (GQDs) are small graphene fragments, where electronic transport is confined in all three spatial dimensions. It possess unique properties owing to its structural uniformity with graphene along with quantum confinement, which make them interesting candidates for a whole range of new applications. Their abundance, the presence of various oxygen functional groups, nontoxicity, high mobility, the extraordinarily long lifetimes of exciton charge carriers, and tuneable band gaps motivated us to explore their potential as photocatalyst. To the best of our knowledge, there have been few efforts to electronically combine GQDs as co-catalyst with other photocatalysts.30–32 But, there is no report in which GQDs are used as main catalyst. With the above points in mind, we planned to study the photocatalytic activity of multi-layered graphene quantum dots (MLGQDs) for the degradation of MB.

The present study investigates the mechanism of photodegradation of MB by MLGQDs under two different lights, green and blue. Our study clearly reveals that photodegradation of MB depends on the presence of its dimer and monomer species in water. It was found that the photocatalytic degradation efficiency of monomer MB in the presence of MLGQDs is 93.3% and 89.4% with k value ∼0.056, and 0.054 min−1, for green and blue light irradiation respectively, after 60 min irradiation. While, lower degradation efficiency of up to 78.8% and 79.5% with low k value ∼0.024 and 0.026 min−1 was achieved for dimer MB, under green and blue light irradiation respectively, in the same time. Additionally, density functional theory (DFT) has been performed to understand the interaction of MLGQDs with MB and also calculated the highest occupied molecular orbital (HOMO) and lowest unoccupied molecular orbital (LUMO) in these charge transfer compounds by time dependent-density functional theory (TD-DFT).

Experimental section

Materials and preparation of multi-layered graphene quantum dots

The one-pot rapid and facile hydrothermal method was used for the preparation of zero-dimensional (0D) multi-layered graphene quantum dots (MLGQDs). Only two ingredients, graphene oxide (GO) synthesized by our group33,34 using Improved Hummers method35 and distilled water (DW), were used for synthesis of MLGQDs. GO solution in distilled water (1 mg ml−1) was subjected to hydrothermal treatment at 200 °C for 4 h and finally a yellow colored solution of MLGQDs was obtained. The resulting yellow colored solution was cooled to room temperature and centrifuged at 8000 rpm for 10 minutes to remove unreacted GO sheets.

Characterization

The morphology of the as-synthesized sample was investigated through transmission electron microscopy (TEM) using a FEI – Tecnai-20 electron microscope. The height of the MLGQDs samples was characterized by using atomic force microscope (AFM) (N8 NEOS Senterra) in non-contact mode. Raman spectra were obtained with a micro-Raman setup (HR LabRam inverse system, JobinYvon Horiba), the 532 nm line from a frequency doubled Nd:YAG laser (Coherent Compass) was used as excitation wavelength. Multi-Purpose X-ray Photoelectron Spectroscopy (XPS) (Sigma Probe, Thermo VG Scientific), and X-ray diffraction (XRD) (diffractometer system-XPERT-PRO) using Cu-Kα1 radiation (λ = 1.5405980 Å) were used for characterization of the as-synthesized MLGQDs. Fourier transform infrared spectra (FTIR) of the samples were recorded using a Perkin Elmer Spectrum 65, FT-IR spectrometer. Photoluminescence (PL) spectra were measured on a fluorescence spectrophotometer (PerkinElmer) with an excitation wavelength of 300 nm. The EIS measurements were carried out on a PARSTAT 2273 potentiostat/galvanostat (Advanced Measurement Technology Inc., NPL, Delhi) by using three-electrode cells. The dye degradation level was measured using a UV/VIS/NIR Spectrophotometer (JASCO-V-670, with PMT and PbS detectors).

Photocatalytic activity test

The photocatalysis experiment was carried out in a normal glass bottle containing a stock solution of MLGQDs–MB. The stock solution of MLGQDs–MB was prepared by mixing 19.25 ml (1 mg/1 ml in DW) of MB solution and 1.75 ml (1 mg/1 ml in DW) of MLGQDs. The mixed solution was stirred well and used for further measurements. UV-Vis absorption spectroscopy was used to study the degradation of MB. The solution of MLGQDs–MB was irradiated separately by two normal LEDs light of power ∼1 W mm2 (central wavelength ca. at 470 and 520 nm) under constant stirring using normal at regular time intervals (10 min). After that, the absorption spectra were recorded as well as optical photographs of the solution.

Density functional theory (DFT) calculation

Molecular geometries of methylene blue (MB), Luco-methylene blue (LMB) and graphene quantum dot (MLGQDs) in the gas phase were fully optimized by DFT method having Becke’s non local three-parameter exchange and correlation functional along with the Lee–Yang–Parr correctional functional (B3LYP).36,37 Geometry of the transition state (TS) between MLGQDs and MB was also optimized. Vibrational analysis was performed in order to ensure that each total minimum energy obtained was genuine, i.e. each minimum has all real frequencies and each transition state has only one imaginary frequency. Zero-point energy (ZPE) correction to total energy and thermal energy correction to enthalpy were obtained at the B3LYP/6-311++g(d,p) level of theory in gas phase and these corrections were also considered to be valid for the corresponding single point energy calculations performed at the same level of theory. All the calculations were performed by Gaussian 03 program.38 For visualization of the optimized structures and vibrational modes Gauss View 4.1 (ref. 39) program was used.

Results and discussion

Structural and spectroscopic characterization

MLGQDs were synthesized employing hydrothermal treatment on GO solution in water. We anticipated that during the sonication process and hydrothermal treatment, cutting of GO takes place due to energy produced under elevated temperature and pressure.29 The systematic presentation for the hydrothermal cutting of GO into MLGQDs are shown in Fig. S1. Fig. 1(a) shows the TEM image of MLGQDs which depicts the ∼8 nm average size particle of MLGQDs as shown in the size distribution curve. The high resolution TEM (HRTEM) image (Fig. 1b) indicates high crystallinity of the MLGQDs with an interlayer spacing ∼0.37 nm. The AFM image measured on the silicon substrate (Fig. 1c) shows a topographic image of MLGQDs. The height profile of MLGQDs corresponds to line Profiles 1 and 2 suggest that the number of layers varies from two to ten.
image file: c5ra07310c-f1.tif
Fig. 1 (a) TEM image of MLGQDs; inset: size distribution curve fitted by Gaussian in origin 8.0 software, (b) HRTEM image of MLGQDs, (c) AFM image of MLGQDs and (d) height profile corresponding the Profile lines 1 and 2 in the AFM image of MLGQDs.

To investigate the chemical composition and functional groups of as-synthesized MLGQDs, XPS, FT-IR, XRD and Raman measurements have been performed. Fig. S2a shows the core level spectra of C 1s for MLGQDs with its deconvoluted peak positions observed at binding energies of 284.2, 284.8, 286.1, 287.1 and 288.5 eV corresponding to C–C, C[double bond, length as m-dash]O, C–O, C–OH and COOH bonds, respectively. The FTIR spectrum of MLGQDs (Fig. S2b) illustrates the presence of C[double bond, length as m-dash]C stretching (1631 cm−1), C[double bond, length as m-dash]O (1725 cm−1), and C–O (1393 and 1060 cm−1).28 The relatively broad peak at 3430 cm−1 (–OH bending), is due to the adsorbed water content in the surface of MLGQDs. The spectral results described above reflect that MLGQDs have many oxygenated functional groups such as carboxylic, epoxy, alkoxy, hydroxyl and carboxyl groups on their surface, making them hydrophilic in nature while graphite and graphene are hydrophobic in nature.28,40 The access charges on the surface of MLGQDs prevent their aggregation resulting in high surface area for the absorption and the present oxygen functional group support the photo catalytic degradation of MB. To further confirm the graphitic nature of as-synthesized QDs, Raman and XRD measurements have been performed. The Raman spectrum of MLGQDs shows two typical peaks at ca. 1349.3 and 1579.3 cm−1, corresponding to the D-band and G-band respectively (Fig. S2c). The value of ID/IG ratio is found ∼1.22. According to Axel Eckmann et al.,14 the ID/IG ratio varies inversely with crystallite size (Ld) in nano-crystalline graphene [ID/IG ∼ 1/(Ld)2], where Ld is the length in nm. The calculated crystallite size of as-synthesized MLGQDs is ca. 0.90 nm. These results imply that the surfaces of MLGQDs have few structural defects due to the presence of various oxygenated groups on the surface.29,41 In the XRD pattern (Fig. S2d), the diffraction peak is broad and centered at 24.75 degree corresponding to (0 0 2) reflection plane with interplanar spacing of 0.37 nm. The broad band (0 0 2) peak shows poor crystallization with crystallite size ∼0.87 nm calculated by Scherrer formula (Ld = /β(2θ)cos[thin space (1/6-em)]θ, where k is dimensionless shape factor equals 0.9, λ is the X-ray wavelength and β is the line broadening at half the maximum intensity (FWHM) after subtracting the instrumental line broadening, in radians), which are close to the value calculated from the Raman measurements.

The optical properties of MLGQDs are the key to their forthcoming applications in the photocatalysis, energy and biological field.28,42 Therefore, ultraviolet-visible (UV-Vis) absorption, the excitation wavelength dependent photoluminescence (PL) and photoluminescence excitation (PLE) were measured to study the optical properties of MLGQDs. Fig. 2a shows the UV-Vis absorption spectrum of green fluorescent MLGQDs, which exhibits double absorption band edges around 240 and 301 nm and extends to 600 nm without noticeable structures. It shows the absorption peak at 240 nm is ascribed to π–π* transition of aromatic C[double bond, length as m-dash]C bonds, while a shoulder at 301 nm attributes to n–π* transition of C[double bond, length as m-dash]O bonds.43 The optical band gap was calculated using modified Kubelka–Munk function i.e. [αhν]1/2 (α is the absorption coefficient, h is Planck’s constant, ν is the light frequency) versus hν plot (Fig. 2b).


image file: c5ra07310c-f2.tif
Fig. 2 (a) UV-Vis spectra of MLGQDs; inset: optical photographs of the MLGQDs under UV light, (b) Tauc plot of transformed Kubelka–Munk function versus the energy of light () for the calculation of band gap (Eg), (c) 2D matrices from PL emission spectra of MLGQDs under various excitation wavelength, and (d) PLE (the detection wavelength (λde) of 470 nm) spectra of the MLGQDs and PL (λex = 396 nm).

The optical band gap of MLGQDs shows double absorption edges corresponding to a band gap of 3.48 eV and 1.73 eV, which shows that the MLGQDs will absorb energy in a broad range visible to Ultra violet. Because of its novel electronic configurations, MLGQDs shows unique and characteristic spectra of excitation (absorption) and emission. The PLE spectrum of the MLGQDs was measured using the detection wavelength (λde) of 470 nm as shown in Fig. 2d with blue color, showing a maximum absorption at 396 nm. Further, the PL emission spectrum has been recorded under the maximum absorption (excitation) wavelength 396 nm, which shows the emission maxima at 510 nm corresponding to green fluorescence. There is an overlap between the higher wavelength end of the excitation spectrum and the lower wavelength end of the emission spectrum. When electrons return to the ground state from the excited state this results in the emission spectrum to be shifted to low energy due to a loss of vibrational energy.44,45 This energy shift is ca. 114 nm, known as Stokes shift.45 Additionally, a two dimensional (2D) PL intensity map of MLGQDs (Fig. 2c) was recorded using an excitation wavelength range from 320 to 480 nm with the interval of 20 nm. A broad asymmetric emission consisting of two peaks ranging from blue (∼445 nm) to green (∼500 nm) was found with increasing PL intensity corresponding to excitation wavelength (300 to 360 nm). This PL behavior of MLGQDs should be attributed to the multi-photon active process.44 Moreover, the excitation wavelength range from 380 to 480 nm show a strong symmetric peak at ca. 510 nm which is red shifted and almost constant in intensity . This green emission can be attributed to quasi-molecular fluorophores,46 which are formed by the electronic coupling of carboxylic and carbonyl groups for an appropriate chemical reaction. The optical properties of MLGQDs contribute to the MLGQDs absorbing a full range of ultra-violet and visible light, which will support the photocatalysis process for photodegradation of MB.

Photocatalytic degradation of MB in presence of MLGQDs

Illumination of an aqueous solution of MB in the presence of MLGQDs results in fast decomposition under visible light irradiation, whereas in the absence of catalyst the degradation is remarkably less (Fig. 3b.). This study analyzed both the light and time dependent photocatalytic activity of MLGQDs from the photodegradation of toxic colored MB into non-toxic colorless ones under green and blue light irradiation respectively. MLGQDs can degrade MB (blue color) into non-toxic colorless CO2, H2O and inorganic anions NO3, SO42− etc. under both blue and green light irradiation. First of all, we have investigated the absorption spectra of pure methylene blue solution in water (Fig. 3a), which reveals that the peak at 614 nm due to the dimer {(MB+)2} and the peak with enhanced intensity at 664 nm is attributed to the monomer species (MB+). Due to molecular attractive cation–cation interaction, the MB+ molecule exist as a dimer {(MB+)2} species.26 During photodegradation, the observed change in normalized temporal concentration (C/C0) of MB+ and (MB+)2 is proportional to the normalized maximum absorbance (A/A0). Here initial concentration (C0) is regarded as the concentration of MB+ and (MB+)2 molecule after adsorption equilibrium.
image file: c5ra07310c-f3.tif
Fig. 3 (a) Absorption spectra of MB in H2O (1 mg/1 ml), (b) the bar plot showing the degradation percentage of monomer and dimer form of MB in solution after 60 minute irradiation with visible light over as-synthesized MLGQDs; (c) plot of Ct/C0 versus irradiation time under green light and (d) plot of Ct/C0 versus irradiation time under blue light with same concentration of MB.

Fig. 3b shows the degradation percentage of MB+ and (MB+)2 molecule with reaction rate constant in aqueous solution of MB after irradiation with green and blue light separately. The photodegradation of MB+ and (MB+)2 molecule follow pseudo first order reaction well, i.e. ln(C/C0) = −kt, where C is the final concentration of molecule, C0 is the initial concentration of molecule, t is the irradiation time, and k is the apparent rate constant. Fig. 3c depicts the photocatalytic performance of MLGQDs with respect to time. The existence of monomer and dimer species in the MB solution in H2O makes it difficult to degrade the dye properly, because the large unit of the dimer species takes a longer time to degrade even though it is present in smaller quantities than the monomer (1.41 times less). It was found that MB+ exhibits faster and better photodegradation capability than (MB+)2 with higher rate constant (Fig. 3b) under both green and blue irradiation light. After 60 min irradiation, the photocatalytic degradation efficiency of MB+ in the presence of MLGQDs is found to be 93.3% and 89.4% with k value ∼0.056, and 0.054 min−1 for green and blue light irradiation, respectively. While a lower degradation efficiency up to 78.8% and 79.5% with low k value ∼0.024 and 0.026 min−1 was achieved for (MB+)2 under both irradiation conditions in the same time. From these results it is clear that in green light irradiation, MLGQDs lead to increased degradation efficiency of dye with high rate constant. The degradation of MB can also be seen in the optical photograph of the MB solution by changing color from blue to colorless (Fig. S4).

After interaction with the MLGQDs in the presence of photo-exicton, the absorption spectra of the MB solution carry all the information about the photocatalytic activity. 2D imaging of the absorption spectra clearly show the spectroscopic changes during the photocatalytic degradation of the MB solution under blue and green irradiation, respectively, at regular time intervals (Fig. 4c and d). It clearly shows that the intensity of MB+ (absorption at 665 nm) and (MB+)2 (absorption at 614 nm) decreased steadily. By the perpendicular (horizontal dashed line) spatial coordinate, we obtain the spectroscopic information along the absorption strength along MB+ and (MB+)2 species in MB solution.


image file: c5ra07310c-f4.tif
Fig. 4 (a and c) Time dependent spectroscopic change on MB when catalyzed by MLGQDs under green and blue light, respectively, and (b and d) a horizontal cross-section at the maximum absorbance change corresponding to time (purple dashed line in (a and b)) is shown, depicting the spatial distribution of the absorbance strength with photodegradation of present monomer (MB+) and dimer ((MB+)2) in MB cationic dye solution.

The photodegradation of MB+ is remarkably higher than (MB+)2, even though the absorption strength of MB+ is 1.41 times than (MB+)2. MB+ might be a short-lived species and favoring the photodegradation of MB in comparison to (MB+)2. MB+ may easily convert into Luco-methylene blue (LMB+) as intermediate product by abstracting a proton from functional groups of MLGQDs in the presence of photoexcited electrons. Photodegradation takes place mainly via highly reactive reagents like OH free radical, which reacts with MB+ and LMB+ and may degrade into harmless CO2, H2O and inorganic anions (NO3, SO42− etc.). Due to the large unit of the (MB+)2 species, it may not be easy to degrade into harmless products. In the control experiments no reduction in MB takes place in the conditions, viz., (a) MB in absence of MLGQDs under blue light and (b) MB in absence of MLGQDs under green light irradiation (Fig. S5 in ESI). These observations confirmed that the photodegradation of MB occurs in the presence of MLGQDs under visible irradiation. Table 1 summarizes the meticulous comparative analysis of photodegradation efficiencies and rate constants of our MLGQDs with the previously reported TiO2 based catalyst for MB degradation.

Table 1 Comparative study of photodegradation performance
Materials Rate constant value Photodegradation efficiency Number of times increase in k value over bare TiO2 Ref.
TiO2 0.0033 36.85 1 6
CNT–TiO2 0.01077 60 3.26 47
TiO2–GR 0.0195 90 5.9 48
Pd–fullerene–TiO2 0.0032 57 0.96 49
TiO2–GO 0.02027 93 6.14 6
TiO2–RGO 0.06209 99 18.81 6
MLGQDs 0.056 93.3 16.96 (present study)


The plausible mechanism of the photodegradation of MB in the presence of MLGQDs under visible light irradiation can be described as follows:

MLGQDs + → MLGQDs (e + h+)

H2O + h+ → H+ + OH˙

H2O + → H+ + OH

OH + h+ → OH˙

image file: c5ra07310c-t1.tif

image file: c5ra07310c-t2.tif

MB+ (blue color) + H+ → LMB+ (colorless)

LMB+ (colorless) + OH˙ → CO2, H2O and inorganic anions (NO3, SO42− etc.)

MB+ + OH˙ → CO2, H2O and inorganic anions (NO3, SO42− etc.)

(MB+)2 + OH˙ → CO2, H2O and inorganic anions (NO3, SO42− etc.)

Since the optical energy band gap of MLGQDs covers a wide range (visible to ultra violet), therefore, the electron and hole pairs will be generated at the surface of MLGQDs when it is excited with an energy higher than the band gap energy of MLGQDs. The defect sites in MLGQDs can act as trapping center for the excited carriers and thereby hinder the recombination process. MB+ molecules act as a proton acceptor and readily accept a proton from functional groups of MLGQDs in the presence of the photoexcited electrons resulting the N–H bond in the MB+ molecule and thereby changes the color from blue (MB+) to colorless (LMB+) as intermediate product. Finally, highly reactive free radicals mineralize all the MB species with particular rate constant.

DFT calculations for the interaction of monomer species of MB with MLGQDs

In order to understand the interaction of MB with MLGQDs, we studied the interaction between MLGQDs and monomer species of MB using DFT. To see the interaction between the MLGQDs and MB systems, first of all the individual units MLGQDs and MB+ were optimized. After that, the MB–MLGQDs complex was optimized using the optimized individual structures. The optimized structure of the MB–MLGQDs complex (Fig. 5a) reveals that a good interaction occurs via a weak hydrogen bonding between the MLGQDs and MB systems. The hydroxyl functional group (–OH) of MLGQDs plays the role of proton donor and makes a hydrogen bond with the nitrogen atom of the MB system. The bond length of participating O–H groups in hydrogen bonding is increased in comparison to isolated OH groups of MLGQDs from 0.969 Å to 0.976 Å. The bond length of N–C in the central ring of MB is also increased by a considerable amount (from 1.371 Å to 1.395 Å) on interaction.
image file: c5ra07310c-f5.tif
Fig. 5 (a) Optimized structure of MLGQDs–MB complex; during optimization the MB system abstracts a proton from the –OH side of MLGQDs and converts to its colorless chemical species LMB with weak hydrogen bonding to MLGQDs; RC-reactants, TS-transition state and PC-product, (b) chemical structures and distribution of HOMO and LUMO for the MLGQDs–MB complex were calculated by TD-DFT level theory.

The dipole moments of MLGQDs and MB are aligned (Fig. 5a) which is indicative of a strong dipole–dipole interaction. MB abstracts a proton from the –OH functional group of MLGQDs during interaction of both and converts into LMB. LMB is bonded with MLGQDs by a weak hydrogen bond with a typical hydrogen bond length of ∼1.687 Å. The binding energy is obtained after correcting the theoretical results for basis-set superposition error (BSSE). The error due to zero-point harmonic vibrations is also approximately considered. Transition state (TS) calculations were performed in order to understand the reaction mechanism for abstraction of proton from MLGQDs. The formation of LMB through direct proton transfer and corresponding barrier energy at B3LYP/6-311++g(d,p) level of theory is in the gas phase. Fig. 5a shows the structures of reactant complex (RC), transition state (TS), and product (PC) for the gas phase reaction.

Activation energies are calculated from the Gibbs free energy differences between the optimized transition state and the optimized reactant complex. The transition state calculations reveal that the moving proton H26 is located between O25 and N19 atoms and C25H26 and N19H26 distances are 1.4086 Å and 1.206 Å, respectively. This reaction is predicted to be exothermic as shown by the ZPE-corrected barrier ∼2.5 kcal mol−1 and released energies ∼16.09 kcal mol−1 at the B3LYP/6-311++g(d,p) level.

The delocalization of the HOMO level was designed using TD-DFT calculations in the MB–MLGQDs complex system. Consequently, the energy difference between HOMO and LUMO level is calculated by TD-DFT. The experimental absorption spectra of the MB–MLGQDs complex display common broad bands at around 665 nm with an absorption edge from 705 nm due to charge transfer transitions (Fig. S5). The vertical excitation energies, oscillator strength, composition and tentative nature of transitions obtained at the TD-DFT level of theory (Fig. 5b). Each absorption line in calculated absorption spectrum is due to several single excitations. The calculations reveal that the first energy band is dominated by the HOMO–LUMO transition and can be assigned some minimal charge transfers within MLGQDs. However, the intensity is relatively weak; therefore this is a local transition (Fig. S6). The next higher energy transition corresponds to charge transfer from MB to MLGQDs with oscillator strength 0.0425. This transition corresponds to 704 nm excitation wavelength and the energy difference between HOMO and LUMO was estimated to be 1.7601 eV along with a dipole moment ∼5.98 eV, which is also evident in our experimental result.

Conclusions

In this study, the photocatalytic activity of MLGQDs was studied by evaluating the mechanism of photodegradation efficiency of methylene blue (MB) in the presence of green and blue light emitting diodes (LEDs) as source of visible light. The co-existence of monomer (MB+) and dimer {(MB+)2} species in the MB solution in H2O makes it difficult to degrade the dye as well as to understand the degradation mechanism. After 60 min irradiation with green light 93.3% of photocatalytic degradation of MB+ with a rate constant (k) 0.056 min−1 was achieved, while the (MB+)2 species degrades by 89.44% with k ∼ 0.024 min−1. Furthermore, we have found a similar trend under blue light. MB+ easily abstracts a proton from functional groups of MLGQDs, resulting in Luco-methylene blue (LMB) as intermediate product, and subsequently photodegradation takes place via highly reactive reagents, i.e. OH radicals. MB+ may possibly be a short-lived species and highly degradable with OH free radicals in comparison to (MB+)2 species. The photocatalytic reaction follows pseudo first-order kinetics. Further, DFT calculations attest the proposed proton transfer mechanism behind the photoreduction of MB and the good interaction with MLGQDs. After interaction of MLGQDs with MB+, the protons leave the hydroxyl group resulting in a short lived intermediate product LMB. In conclusion, we have successfully investigated the mechanism behind the degradation of MB comprehensively and the encouraging results revealed that the monomer species of MB predominates in the photodegradation.

Conflict of interests

The authors declare no competing financial interest.

Acknowledgements

S.U. is thankful to Mr Anurag Mishra from Bio-physics lab, BHU, for PL, UV-Vis and FTIR measurements. S.U. is also thankful to Dr Saurabh Srivastava from NPL, New Delhi, India, for EIS measurements. A.S. acknowledges the CAS program sponsored by UGC at the Department of Physics, B. H. U and DST, New Delhi, India. S.U. and P.S. express their gratitude for the U.G.C. financial assistance.

References

  1. S. G. Kumar and L. G. Devi, J. Phys. Chem. A, 2011, 115, 13211–13241 CrossRef CAS PubMed.
  2. M. Saquib, M. Abu Tariq, M. M. Haque and M. Muneer, J. Environ. Manage., 2008, 88, 300–306 CrossRef CAS PubMed.
  3. R. Jain and M. Shrivastava, J. Hazard. Mater., 2008, 152, 216–220 CrossRef CAS PubMed.
  4. A. R. Lang, Dyes and Pigments: New Research, Nova Science Publishers, 2009, New York, pp. 44–45 Search PubMed.
  5. E. A. El-Sharkawy, A. Y. Soliman and K. M. Al-Amer, J. Colloid Interface Sci., 2007, 310, 498–508 CrossRef CAS PubMed.
  6. S. Umrao, S. Abraham, F. Theil, S. Pandey, V. Ciobota, P. K. Shukla, C. J. Rupp, S. Chakraborty, R. Ahuja, J. Popp, B. Dietzek and A. Srivastava, RSC Adv., 2014, 4, 59890–59901 RSC.
  7. A. A. Ismail, D. W. Bahnemann, I. Bannat and M. Wark, J. Phys. Chem. C, 2009, 113, 7429–7435 CAS.
  8. Y. C. Yang Li, W. Zhang and J. Niu, ACS Nano, 2012, 6, 5164–5173 CrossRef PubMed.
  9. D. Wang, Y. Zou, S. Wen and D. Fan, Appl. Phys. Lett., 2009, 95, 012106–012108 CrossRef PubMed.
  10. L.-W. Zhang, H.-B. Fu and Y.-F. Zhu, Adv. Funct. Mater., 2008, 18, 2180–2189 CrossRef CAS PubMed.
  11. A. Mukherji, R. Marschall, A. Tanksale, C. Sun, S. C. Smith, G. Q. Lu and L. Wang, Adv. Funct. Mater., 2011, 21, 126–132 CrossRef CAS PubMed.
  12. S. Al-qaradawi and S. R. Salman, J. Photochem. Photobiol., A, 2002, 148, 161–168 CrossRef CAS.
  13. K. Krishnamoorthy, R. Mohan and S.-J. Kim, Appl. Phys. Lett., 2011, 98, 244101 CrossRef PubMed.
  14. N. Zhou, L. Polavarapu, N. Gao, Y. Pan, P. Yuan, Q. Wang and Q.-H. Xu, Nanoscale, 2013, 5, 4236–4241 RSC.
  15. N. Shi, X. Li, T. Fan, H. Zhou, J. Ding, D. Zhang and H. Zhu, Energy Environ. Sci., 2011, 4, 172 CAS.
  16. H. Wang, L. Thia, N. Li, X. Ge, Z. Liu and X. Wang, Appl. Catal., B, 2015, 166–167, 25–31 CAS.
  17. X. Shi, X. Xia, G. Cui, N. Deng and Y. Zhao, Appl. Catal., B, 2015, 163, 123–128 CrossRef CAS PubMed.
  18. R. Saada, S. Kellici, T. Heil, D. Morgan and B. Saha, Appl. Catal., B, 2015, 168–169, 353–362 CrossRef CAS PubMed.
  19. J. Hou, C. Yang, Z. Wang, S. Jiao and H. Zhu, Appl. Catal., B, 2013, 129, 333–341 CrossRef CAS PubMed.
  20. J. Podporska-carroll, E. Panaitescu, B. Quilty, L. Wang, L. Menon and S. C. Pillai, Appl. Catal., B, 2015, 176, 70–75 CrossRef PubMed.
  21. K. Tsai and Y. Hsu, Appl. Catal., B, 2015, 164, 271–278 CrossRef CAS PubMed.
  22. C. Cui, Y. Wang, D. Liang, W. Cui, H. Hu, B. Lu, S. Xu, X. Li, C. Wang and Y. Yang, Appl. Catal., B, 2014, 158–159, 150–160 CrossRef CAS PubMed.
  23. M. Seredych and T. J. Bandosz, Appl. Catal., B, 2014, 147, 842–850 CrossRef CAS PubMed.
  24. C. P. Athanasekou, S. Morales-torres, V. Likodimos, G. Em, L. M. Pastrana-martinez, P. Falaras, D. D. Dionysiou, J. L. Faria, J. L. Figueiredo and A. M. T. Silva, Appl. Catal., B, 2014, 158–159, 361–372 CrossRef CAS PubMed.
  25. Y. Li, J. Qu, F. Gao, S. Lv, L. Shi and C. He, Appl. Catal., B, 2015, 162, 268–274 CrossRef CAS PubMed.
  26. J. R. S. Wynetta Spencer, J. Phys. Chem., 1979, 83, 1573–1576 CrossRef.
  27. L. Tang, R. Ji, X. Li, K. S. Teng and S. P. Lau, Part. Part. Syst. Charact., 2013, 30, 523–531 CrossRef CAS PubMed.
  28. S. Umrao, M. Jang, J. Oh, G. Kim, S. Sahoo, Y. Cho, A. Srivastva and I. Oh, Carbon, 2014, 81, 514–524 CrossRef PubMed.
  29. D. Pan, J. Zhang, Z. Li and M. Wu, Adv. Mater., 2010, 22, 734–738 CrossRef CAS PubMed.
  30. S. Zhuo, M. Shao and S.-T. Lee, ACS Nano, 2012, 6, 1059–1064 CrossRef CAS PubMed.
  31. T.-F. Yeh, C.-Y. Teng, S.-J. Chen and H. Teng, Adv. Mater., 2014, 26, 3297–3303 CrossRef CAS PubMed.
  32. D. K. L. Chan, P. L. Cheung and J. C. Yu, Beilstein J. Nanotechnol., 2014, 5, 689–695 CrossRef CAS PubMed.
  33. V. Kumar, S. Srivastava, S. Umrao, R. Kumar and G. Nath, RSC Adv., 2014, 4, 2267–2273 RSC.
  34. S. Srivastava, M. A. Ali, S. Umrao, U. K. Parashar, A. Srivastava, G. Sumana, B. D. Malhotra, S. S. Pandey and S. Hayase, Appl. Biochem. Biotechnol., 2014, 174, 960–970 CrossRef CAS PubMed.
  35. D. C. Marcano, D. V Kosynkin, J. M. Berlin, A. Sinitskii, Z. Sun, A. Slesarev, L. B. Alemany, W. Lu and J. M. Tour, ACS Nano, 2010, 4, 4806–4814 CrossRef CAS PubMed.
  36. A. D. Becke, J. Chem. Phys., 1993, 98, 5648–5652 CrossRef CAS PubMed.
  37. R. G. P. Chengteh lee and W. Yang, Phys. Rev. B: Condens. Matter Mater. Phys., 1988, 37, 785–789 CrossRef.
  38. M.J. Frisch, G.W. Trucks, H.B. Schlegel, G.E. Scuseria, M.A. Robb, J.R. Cheeseman, V.G. Zakrzewski, J.A. Montgomery Jr., R.E. Stratmann, J.C. Burant, S.J. Dapprich, M. Millam, A.D. Daniels, K.N. Kudin, M.C. Strain, O. Farkas, J. Tomasi, V. Barone, M. Cossi, R. Cammi, B. Mennucci, C. Pomelli, C. Adamo, S. Clifford, J. Ochterski, G.A. Petersson, P.Y. Ayala, Q. Cui, K. Morokuma, D.K. Malick, A.D. Rabuck, K. Raghavachari, J.B. Foresman, J. Cioslowski, J.V. Ortiz, A.G. Baboul, B.B. Stefanov, G. Liu, A. Liashenko, P. Piskorz, I. Komaromi, R. Gomperts, R.L. Martin, D.J. Fox, T. Keith, M.A. Al-Laham, C.Y. Peng, A. Nanayakkara, M. Challacombe, P.M.W. Gill, B. Johnson, W. Chen, M.W. Wong, J.L. Andres, C. Gonzalez, M. Head-Gordon, E.S. Replogle, J.A. Pople, Gaussian 03, Gaussian, Inc., Pittsburgh PA. 2003.
  39. R. G. R. Dennington II, T. Keith, J. Millam, K. Eppinnett and W. L. Hovell, Gauss Veiw 4.1, Semichem, Inc., Shawnee Mission, KS, 2003 Search PubMed.
  40. V. Kumar, V. Singh, S. Umrao, V. Parashar, S. Abraham, A. K. Singh, G. Nath, P. S. Saxena and A. Srivastava, RSC Adv., 2014, 4, 21101–21107 RSC.
  41. J. Peng, W. Gao, B. K. Gupta, Z. Liu, R. Romero-Aburto, L. Ge, L. Song, L. B. Alemany, X. Zhan, G. Gao, S. A. Vithayathil, B. A. Kaipparettu, A. a Marti, T. Hayashi, J.-J. Zhu and P. M. Ajayan, Nano Lett., 2012, 12, 844–849 CrossRef CAS PubMed.
  42. X. Yan, X. Cui, B. Li and L. Li, Nano Lett., 2010, 10, 1869–1873 CrossRef CAS PubMed.
  43. L. Zhang, X. Li, Y. Huang, Y. Ma, X. Wan and Y. Chen, Carbon, 2010, 48, 2367–2371 CrossRef CAS PubMed.
  44. S. Wu, N. Duan, X. Ma, Y. Xia, H. Wang, Z. Wang and Q. Zhang, Anal. Chem., 2012, 84, 6263–6270 CrossRef CAS PubMed.
  45. G. G. Guilbault, Practical fluorescence, second edn, 1990, 0–8247–8350–6 Search PubMed.
  46. C. Galande, A. D. Mohite, A. V. Naumov, W. Gao, L. Ci, A. Ajayan, H. Gao, A. Srivastava, R. B. Weisman and P. M. Ajayan, Sci. Rep., 2011, 1, 1–4 Search PubMed.
  47. J. Yu, T. Ma and S. Liu, Phys. Chem. Chem. Phys., 2011, 13, 3491–3501 RSC.
  48. N. Yang, Y. Liu, H. Wen, Z. Tang, H. Zhao, Y. Li and D. Wang, ACS Nano, 2013, 7, 1504–1512 CrossRef CAS PubMed.
  49. Z.-D. Meng, F.-J. Zhang, L. Zhu, C.-Y. Park, T. Ghosh, J.-G. Choi and W.-C. Oh, Mater. Sci. Eng., C, 2012, 32, 2175–2182 CrossRef CAS PubMed.

Footnote

Electronic supplementary information (ESI) available: Schematic for synthesis of MLGQDs, XPS, FTIR, RAMAN, XRD pattern and AC impedance spectra of as-synthesized MLGQDs. Photographic images of MB–MLGQDs solution as well as time dependent absorbance spectrum of MB alone under green and blue light. Optimized structures of MLGQDs, MB, LMB and ground state HOMO–LUMO level of MLGQDs–MB complex. See DOI: 10.1039/c5ra07310c

This journal is © The Royal Society of Chemistry 2015
Click here to see how this site uses Cookies. View our privacy policy here.