Influence of bovine serum albumin coated poly(lactic-co-glycolic acid) particles on differentiation of mesenchymal stem cells

Pengfei Jiang, Dahai Yu, Wenjing Zhang, Zhengwei Mao* and Changyou Gao
MOE Key Laboratory of Macromolecular Synthesis and Functionalization, Department of Polymer Science and Engineering, Zhejiang University, Hangzhou 310027, China. E-mail: zwmao@zju.edu.cn; Fax: +86-571-87951108

Received 21st April 2015 , Accepted 30th April 2015

First published on 30th April 2015


Abstract

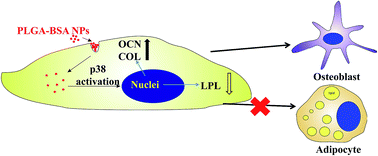
Interaction with colloidal particles may change the structure and function of the cytoskeleton, and influence cell shape and signal pathways, and thereby modulate the differentiation of stem cells. In this study, bovine serum albumin-coated poly(lactic-co-glycolic acid) particles (PLGA–BSA) were prepared and incubated with rat mesenchymal stem cells (MSCs). It was found that they promote osteogenic ALP activity and the expression of collagen type I (COL) and osteocalcin (OCN) of MSCs, but inhibit the expression of adipogenic peroxisome proliferator-activated receptor-gamma (PPARγ) and lipoprotein lipase (LPL) at both mRNA and protein levels. The p38 pathway is altered in the presence of PLGA–BSA particles, which might be responsible for the particle-induced differentiation of MSCs.
1. Introduction

Nano and submicrometer sized polymeric particles are promising carriers for proteins, peptides, genes, vaccines, antigens, and cell growth factors, as well as small molecular drugs such as antibiotics, chemotherapeutic agents, and so on.1,2 The lactic acid (LA) and glycolic acid (GA) copolymer, poly(D,L-lactide-co-glycolide) (PLGA), is one of the most frequently used polymers in the biomedical field.3 PLGA has many attractive properties, such as biodegradability and biocompatibility, and ease of surface modification to enable controlled interaction with biological materials.4 The PLGA-based nanoparticles can be used as drug delivery systems for the treatment of different pathologies, such as oncotherapy,5,6 cerebral diseases,7,8 cardiovascular diseases,9 infections,10 diabetes11 and regenerative medicine.12,13

The great potential of PLGA nanoparticles makes it essentially necessary to carry out an in-depth study of their safety issue, because the uptake of nanoparticles may bring some unexpected effects such as cytotoxicity and alternation of cell functions.3,14–20 The impact is largely dependent on the physiochemical properties of nanomaterials. For example, Yu et al. found that PLGA particles coated with polyethyleneimine (PEI) not only strongly influence cell viability, but also some essential cellular physiological functions such as cell adhesion and mobility.3 In contrast, bovine serum albumin (BSA)-coated PLGA particles show much smaller influence on cell functions. However, the influence of PLGA particles on cell phonotype and/or differentiation has not been addressed so far.

Mesenchymal stem cells (MSCs) with versatile differentiation capacity to various lineages including osteoblasts, adipocytes and neurons have drawn intensive attention in tissue regeneration.21,22 The differentiation of MSCs is greatly influenced by many factors from the surrounding microenvironment, such as growth factors, cell–cell contacts, and cell–extracellular matrix (ECM) interactions.23–36 In the past decades, PLGA nanoparticles carrying bioactive molecules were employed as the important carrier for inducing the differentiation of MSCs.37–39 For example, Sarkar et al.40 found that PLGA particles containing dexamethasone can promote osteogenesis of stem cells because of the release of dexamethasone. Park et al.41 found that PLGA nanoparticles polyplexed with SOX trio genes transfected into human MSCs increase the ability of chondrogenesis.

Although the PLGA particles have been extensively used in medicinal and pharmaceutical fields as carriers for bioactive substances, no attention has been paid to the effects of native PLGA nanoparticles themselves. In this work, BSA-coated PLGA particles (PLGA–BSA) were prepared, and their impacts on the osteogenic and adipogenic differentiation of MSCs were studied in terms of alkaline phosphatase (ALP) activity, expressions of osteogenic and adipogenic markers, calcium deposition and the formation of lipid droplets. Finally, the expressions of key differentiation-related markers were studied to elucidate the potential mechanism for regulating cell differentiation based on cell–particle interactions.

2. Experimental section

2.1 Materials

Poly(lactide-co-glycolide) (PLGA, LA/GA = 75[thin space (1/6-em)]:[thin space (1/6-em)]25, Mw = 130 kDa) was obtained from Shandong Institute of Medical Instruments, China. Bovine serum albumin (BSA), alizarin red S, and oil red O were purchased from Sigma-Aldrich. Bicinchoninic acid (BCA) kit and alkaline phosphatase kit were purchased from KeyGEN Co. Ltd., China. Picogreen dsDNA kit was purchased from life technologies, USA. The water used in the experiments was purified by a Milli-Q water system (Millipore, USA).

2.2 Particles preparation

PLGA–BSA particles were prepared using an O/W emulsion-solvent evaporation method as reported previously.3,42,43 In brief, 1 mL 2% (w/v) PLGA dichloromethane solution (organic phase) was added into 4 mL 3% BSA solution (water phase), and then emulsified with an ultrasonicator (MISONIX Ultrasonic liquid Processors) for 20 s. The obtained emulsion was poured into 150 mL of water and stirred for 3 h at room temperature with a magnetic stirrer until the organic solvent was completely evaporated. The PLGA particles were collected by centrifugation at 12[thin space (1/6-em)]000g for 15 min and washed with water five times to remove free BSA in the water phase. The PLGA particles containing Nile red (NR) were similarly prepared by adding 0.2 mg mL−1 NR into the PLGA solution before mixing with the BSA solution. The fluorescence intensity of NR-labeled PLGA–BSA particles was tracked for 7 d in cell culture medium to guarantee there is no significant leakage of fluorescent dye from the particles.

2.3 Particles characterization

The morphology of particles was analyzed by transmission electron microscopy (TEM, Philips TECNAL-10). A drop of the particles suspension (∼50 μg mL−1) was added onto a copper grid with a carbon membrane and dried in air. The size and zeta potential of the particles was determined using Beckman Delsa Nano (Beckman Coulter) in 10 mM NaCl solution at neutral pH (a recommend solution for zeta potential measurement) and low glucose DMEM containing 10% fetal bovine serum (FBS, cell culture medium), respectively. The BSA content on PLGA–BSA particles was determined by the BCA kit following the manufacturer's instruction.

2.4 Cell isolation and culture

The committee on animal experimentation of Zhejiang University approved the animal experiments. Bone mesenchymal stem cells (MSCs) were isolated from bone marrow of Sprague-Dawley rats (6–8 weeks old) as described previously.44 The procedures were performed in accordance with the “Guidelines for Animal Experimentation” by the Institutional Animal Care and Use Committee, Zhejiang University. Briefly, the bone marrow cells were obtained from the femoral shafts of rats by flushing out with 10 mL of culture medium (low glucose Dulbecco's modified Eagle's medium (DMEM) supplemented with 10% fetal bovine serum (FBS) (Life Technologies, New York, USA), 100 U per mL penicillin and 100 μg mL−1 streptomycin). The released cells were collected into a 9 cm cell culture dish (Corning, USA) containing 10 mL of culture medium and incubated in a humidified atmosphere of 95% air and 5% CO2 at 37 °C. After the cells reached about 80% confluence, they were detached and serially subcultured. The BMSCs at passage 2 (P2) were used in this study.

2.5 Exposure MSCs with particles

The BMSCs were seeded on disks in the 25 cm2 culture plates at an initial seeding density of 2 × 10⁴ cells per cm2, and cultured for 1–2 d until cells were 90% confluence. Then culture medium containing 50 μg mL−1 particles was used for following 21 d. The culture medium was changed every 3 d with fresh one containing 50 μg mL−1 particles.

Fluorescent staining of cell nuclei was performed to display the intracellular distribution of the PLGA particles by confocal laser scanning microscopy (CLSM, LSM 510, Carl Zeiss). Briefly, after being cultured with 50 μg mL−1 of NR-labeled PLGA particles for the desired time (1 d, 7 d and 21 d), the cells were carefully washed with PBS 3 times and continually cultured with DAPI at 37 °C for another 30 min.

After being cultured with 50 μg mL−1 of NR-labeled PLGA particles for the desired time (1 d, 7 d and 21 d), the cells were trypsinized and resuspended in PBS, and their fluorescence intensity was determined via flow cytometry (FACS Calibur, Becton Dickinson BD). The value was used to quantify the relative amount of PLGA particles internalized by MSCs.

2.6 Cell viability

The cell viability was determined by MTT assay. Briefly, after the cells were co-incubated with particles for specific time (1 d, 7 d, 14 d and 21 d), 20 μL of 3-[4,5-dimethylthiazol-2-yl]-2,5-diphenyltetrazolium bromide (MTT, 5 mg mL−1) was added to each well and the cells were further cultured at 37 °C for 4 h. The dark blue formazan crystals generated by the mitochondria dehydrogenase in viable cells were dissolved in dimethyl sulphoxide (DMSO), whose absorbance was measured at 570 nm by a microplate reader (Biorad Model 680).

2.7 Alkaline phosphatase (ALP) activity

After being cultured for 7 d, the MSCs were washed with PBS 3 times and treated with 0.5% Triton–PBS at 4 °C for 24 h. The ALP activity was measured using a colorimetric Kit (KeyGEN Biotech). The cell number of the MSCs in each sample was quantified using a PicoGreen dsDNA Assay Kit (Life technologies). As a result, ALP activity per 104 cells was presented.

2.8 Real-time RT-PCR analysis

Real-time quantitative reverse transcription polymerase chain reaction (Realtime RT-PCR) was performed to examine the expression profiles of osteo-differentiation-related genes including osteocalcin (OCN) and collagen type I (COL) as well as adipo-differentiation-related genes including peroxisome proliferator-activated receptor gamma (PPARγ) and lipoprotein lipase (LPL). Briefly, after the MSCs were cultured for 21 d, total RNA was extracted by using Trizol reagent (Invitrogen, USA) according to the manufacturer's instructions and quantified by using a biophotometer (Eppendorf, Germany). In each sample, 2 mg RNA was used for the reverse transcription under standard conditions using M-MLV Reverse Transcriptase cDNA synthesis kit (Promega, USA). The resulting cDNA was used as template in subsequent PCR amplification. The primer sequences used in this study are listed in Table 1. 18S ribosomal subunit (18S) was used as the endogenous reference housekeeping gene. The real-time PCR reactions were performed with the SYBR Premix Ex-Taq™ Kit (Takara, Japan) and iQ™ qPCR system (Bio Rad, USA). The relative gene expression values were calculated with a comparative DDCT (threshold cycle) method, and normalized to the housekeeping gene.
Table 1 RT-PCR primer sequences
Gene Primer sequences (5′ to 3′) Size (bp)
Rat PPARγ CCCTTTACCACGGTTGATTTCTC 148
GGGACGCAGGCTCTACTTTGAT
Rat OCN CTCACTCTGCTGGCCCTGAC 111
CACCTTACTGCCCTCCTGCTTG
Rat[thin space (1/6-em)]COL ACCTCCGGCTCCTGCTCCTCTTAG 234
GACAGCACTCGCCCTCCCGTTTTT
Rat LPL GGTCGCCTGGTCGAAGTATTG 89
GTTGCATCCTGGCTGGAAAGTG
Rat 18S GAATTCCCAGTAAGTGCGGGTCATA 105
CGAGGGCCTCACTAAACCATC


2.9 Western blot assay

The MSCs were washed with PBS 3 times and completely homogenized in radio immunoprecipitation assay buffer (RIPA) with protease inhibitors. The lysates were centrifuged at 12[thin space (1/6-em)]000 rpm at 4 °C for 15 min, and separated on a SDS-PAGE. All the gels were run under the same experimental conditions. After being transferred to a PVDF membrane (Millipore, MA, USA), the proteins were incubated overnight with antibodies and detected using an enhanced chemiluminescence (ECL Western Blotting Substrate, Pierce, USA) system. The integral optical density (IOD) was determined using the software Bandscan 5.0.

2.10 Alizarin red S & oil red O staining

Alizarin red S was dissolved to form 1% (w/v) water solution. After 21 d culture, the MSCs were washed 3 times with PBS and fixed in 4% paraformaldehyde for 15 min. Then they were stained in the alizarin red S solution at room temperature for 15 min, washed with PBS 3 times, and observed under a microscope.

Oil red O was dissolved in isopropanol (1% w/v) to prepare a stock solution. The stock solution was mixed with distilled water (3[thin space (1/6-em)]:[thin space (1/6-em)]2) and then filtered to obtain a work solution. After 21 d culture, the cells were washed 3 times with PBS and fixed in 4% paraformaldehyde for 15 min. They were then stained in the oil red work solution at room temperature for 15 min, washed with PBS 3 times, and observed under a microscope.

2.11 Statistical analysis

At least three independent experiments were carried out if not otherwise stated. Results are reported as mean ± standard deviation and are analyzed using a paired student's t-test. The significant difference level was set at p < 0.05.

3. Result and discussion

3.1 Particles preparation and characterization

BSA is the most abundant protein in serum, and is biologically inert for cell differentiation. Therefore, in this work, PLGA–BSA particles were prepared by an O/W emulsion-solvent evaporation method with BSA as stabilizer in aqueous phase.3 As shown in the FTIR spectrum of PLGA–BSA particles (Fig. 1), the absorbance at 1656 cm−1, 1544 cm−1 are assigned to the stretching vibration of C[double bond, length as m-dash]O (amide band I) and bending vibration of N–H (amide band II), respectively, which belong to the characteristic peaks of BSA molecules. The absorbance at 1758 cm−1 are assigned to the stretching vibration of C[double bond, length as m-dash]O of ester bond, which belong to the characteristic peak of PLGA molecule.45 This result confirms the successful incorporation of BSA and PLGA molecules into the PLGA–BSA particles. As shown in Fig. 2a, the PLGA–BSA particles had a core–shell structure. The BSA molecules were entrapped into the PLGA particles and were enriched on the particle surface tightly, forming a corona with the thickness of ∼20 nm and contributing about 5% of the particle mass.3 The number average diameter of PLGA–BSA particles was about 330 nm in water with a narrow distribution (PDI = 0.308, Fig. 2b).
image file: c5ra07219k-f1.tif
Fig. 1 FTIR spectra of PLGA molecules, BSA molecules and PLGA–BSA particles.

image file: c5ra07219k-f2.tif
Fig. 2 Representative transmission electron microscopy images (a) and size distribution histogram (b) of PLGA–BSA particles.

Furthermore, PLGA–BSA particles showed good colloidal stability in cell culture medium containing 10% FBS with an average diameter of 350 nm. There is no significant change compared with those respective ones in water in both particle size and morphology.3 Zeta potential measurement found that the PLGA–BSA particles were all negatively charged (−28.6 ± 2.4 mV) in 10 mM NaCl solution at neutral pH value. The particles possessed similar surface charge in cell culture medium (−23.7 ± 3.2 mV), possibly due to the presence of BSA molecules on their surface which resist to protein adsorption.

3.2 Cell differentiation influenced by PLGA–BSA particles

Although the particles (<1 μm) can be usually internalized into cells,46 they can be exocytosed to some extent if the particles are removed from the medium.40,47,48 Therefore, the MSCs were continually incubated with the medium containing PLGA–BSA particles to maintain a stable intracellular concentration of particles. As shown in Fig. 3, the Nile red-labeled PLGA particles could be observed inside MSCs during the whole experimental period of time (21 d). The average fluorescent intensity per MSC (Fig. 3d) was remained almost constant in the first 7 d, and slightly reduced at 21 d. Since the cells were cultured with a constant concentration of NPs, the newly proliferated cells should have a similar ability of uptake of the PLGA–BSA NPs, as the case before 7 d culture. Therefore, the reduced endocytosis ability at 21 d is most possibly attributed to the alternation of cell phenotype.
image file: c5ra07219k-f3.tif
Fig. 3 CLSM images of MSCs incubated with growth medium containing 50 μg mL−1 Nile red-labeled PLGA–BSA particles (red) for (a) 1 d, (b) 7 d, and (c) 21 d. These are the middle sections of z-stacked images of cells (thickness of 0.8 μm). Scale bar = 20 μm. The cell nuclei (blue) was stained with DAPI. (d) Average fluorescence intensity per cell (represent the amount of PLGA–BSA particles internalized by MSCs) versus culture time. The particle concentration was kept constant at 50 μg mL−1 during the culture period.

The toxicity effect of PLGA particles was firstly investigated by monitoring the viability of adhered MSCs via MTT assay. As shown in Fig. 4, the absorbance (cell viability) increased almost linearly in the presence of PLGA–BSA particles for 21 d, indicating cell growth. Moreover, the cell viability was significantly lower than that of the MSCs being cultured in particle-free medium at each time point, suggesting the significant impairment of cell proliferation and/or metabolic activity as a result of the presence of the PLGA–BSA NPs.


image file: c5ra07219k-f4.tif
Fig. 4 Viability of MSCs in the presence of 50 μg mL−1 PLGA–BSA particles as a function of culture time.

In order to reveal the impact of PLGA particles on MSCs' differentiation, the alkaline phosphatase (ALP) activity of MSCs, an important osteogenic marker in earlier stage (usually before 7 d),44,49 was quantitatively measured (Fig. 5). After culture for 7 d in normal medium (−PLGA), it significantly increased compared with that of the pristine MSCs (Control). This is attributed to the osteo-inductive nature of stiff TCPS.50 In the presence of PLGA–BSA particles (+PLGA), the ALP activity further increased 40%, and reached a value about 10 times compared to that of the pristine MSCs.


image file: c5ra07219k-f5.tif
Fig. 5 ALP activity of pristine MSCs (control), MSCs cultured in particle-free medium for 7 d (−PLGA), and MSCs exposed to 50 μg mL−1 PLGA–BSA particles for 7 d (+PLGA). * indicates significant difference at p < 0.05 level.

Furthermore, the expressions of several differentiation hallmarks at relative later stage were studied at both gene and protein levels. Collagen type I (COL) and osteocalcin (OCN) are both important for osteogenic differentiation. It has been proved that COL is the most abundant protein in the organic/inorganic composite matrix of bone tissue.51 OCN is the most abundant noncollagenous protein in the bone matrix, which plays an essential role in bone formation and remodeling.52 Besides, peroxisome proliferator-activated receptor-gamma (PPARγ) and lipoprotein lipase (LPL) play crucial roles in adipocyte differentiation. They can stimulate lipid uptake and adipogenesis by fat cells.53,54

Compared to those of the MSCs in particle-free medium (−PLGA), in the presence of PLGA particles (+PLGA) the mRNA expressions of COL and OCN from the MSCs being cultured for 21 d increased 232% (p < 0.01) and 32% (p < 0.05), respectively (Fig. 6). The protein expressions of COL and OCN from the MSCs also increased significantly (Fig. 7). The results substantiate that the PLGA–BSA particles can act as an osteo-inductive agent in normal culture medium. It is worth pointing out that in particle-free medium (−PLGA) the mRNA expression levels of COL and OCN from the MSCs were about 20% higher than those of the pristine MSCs, suggesting that the MSCs have a self-generated osteogenic differentiation tendency on stiff TCPS substrate in normal culture medium.


image file: c5ra07219k-f6.tif
Fig. 6 Relative gene expressions of osteogenic markers (OCN and COL) and adipogenic markers (PPARγ and LPL) of pristine MSCs (control), MSCs cultured in particle-free medium for 21 d (−PLGA), and MSCs exposed to 50 μg mL−1 PLGA–BSA particles for 21 d (+PLGA). * indicates significant difference at p < 0.05 level.

image file: c5ra07219k-f7.tif
Fig. 7 (a) Western blot analysis of osteogenic markers (OCN and COL) and adipogenic markers (PPARγ and LPL) expressed by pristine MSCs (control), MSCs cultured in particle-free medium for 21 d (−PLGA), and MSCs exposed to 50 μg mL−1 PLGA–BSA particles for 21 d (+PLGA). (b) Integrated optical density (IOD) obtained from (a). * and ** indicate significant difference at p < 0.05 and p < 0.01 levels, respectively. All gels were run under the same experimental conditions.

By contrast, in the presence of PLGA particles (+PLGA) the mRNA expressions of LPL from the MSCs being cultured for 21 d both decreased more than 50% compared to that of the MSCs in particle-free medium (−PLGA) (Fig. 6). The protein expressions of PPARγ and LPL from the MSCs also decreased significantly (Fig. 7). Therefore, it is safe to conclude that the presence of PLGA–BSA particles can significantly impair the adipogenic differentiation of MSCs. Although the mRNA expression of PPARγ from the MSCs in particle-free medium was much higher than that of the pristine MSCs, the protein expression of PPARγ was not obviously enhanced. Thus the MSCs do not have a self-generated adipogenic differentiation tendency on stiff TCPS substrate in normal culture medium.

An osteogenic tissue is capable of forming an extracellular matrix that can regulate mineralization, which represents its ultimate phenotypic expression.55 Therefore, after the MSCs were cultured for 21 d, calcium deposition was measured by alizarin red S staining, which is used as a hallmark for osteogenic differentiation.27,28 The amount of adsorbed dye is proportional to the calcium content. As shown in Fig. 8a, there is no obvious calcium deposition, suggesting that MSCs were not able to produce mineralized matrix in normal medium alone even after 21 d culture. The results suggest that even the stiff TCPS substrate can induce osteogenic differentiation to some extent, the tendency is not strong/fast enough to promote the mineralization of extracellular matrix, which is the hallmark of osteogenesis in late stage. However, the presence of PLGA–BSA particles triggered the formation of large mineralized calcium deposition (Fig. 8b), suggesting the osteogenic differentiation of the MSCs.


image file: c5ra07219k-f8.tif
Fig. 8 Effect of PLGA–BSA particles on calcium deposition and lipid droplets formation of MSCs after 21 d culture. MSCs were stained with alizarin red S solution (a and b) and oil red O solution (c and d), respectively. MSCs were cultured in (a and c) particle-free medium, and (b and d) medium with 50 μg mL−1 PLGA–BSA particles. Scale bars are 100 μm.

Accumulation of lipid-rich vacuoles within cells is a typical marker in the process of adipogenic differentiation of MSCs.21,56 Therefore, after 21 d of cell culture, formation of lipid droplets was characterized with oil red O staining, which is used as a hallmark for adipogenic differentiation. As shown in Fig. 8c and d, there was no apparent droplet structure inside MSCs in normal medium or in the medium containing PLGA–BSA particles, suggesting that the PLGA–BSA particles have no obvious impact on the lipid formation of the MSCs.

3.3 MAPK signaling pathways modulated by PLGA–BSA particles

Mitogen-activated protein kinases (MAPK) signaling pathways are very important in regulating cell behavior including cell proliferation, survival, apoptosis, differentiation and so on.57 In mammalian cells, extracellular signal-related kinases (ERK1/2), protein kinase 38 (p38), and c-Jun-N-terminal kinases (JNKs) pathways are three parallel pathways to modulate cell behaviors.57 JNK and p38 are often referred to as stress-activated protein kinases (SAPK1/JNK and SAPK2/p38), and ERK1/2 are often described as the kinases involved in growth factor stimulation. It has been proved that MAPK signaling pathways in stem cells will be influenced by changing properties of surrounding environments, such as elasticity,24 topography58–60 and so on,61 which in turn dominate stem cell differentiation. Cellular interaction with particles has been demonstrated to regulate MAPK pathways in mammalian cells as well.62–65 As shown in Fig. 9, expression of p38 from MSCs in the presence of PLGA–BSA particles increased 75% compared to that of cells in particle-free medium, suggesting activation of p38 related pathway via the cell–particle interaction. Meanwhile, the expressions of JNK1/2 and ERK1/2 from MSCs were not significantly influenced in the presence of PLGA–BSA particles. Therefore, it is reasonable to conclude that cellular interaction with the PLGA–BSA particles can up-regulate p38 related pathway, which is believed to be an important pathway regulating the differentiation of stem cells.39
image file: c5ra07219k-f9.tif
Fig. 9 (a) Western blot analysis of MAPK pathway related proteins (p38, JNK1/2, ERK1/2) expressed by pristine MSCs (control), MSCs cultured in particle-free medium for 7 d (−PLGA), and MSCs exposed to 50 μg mL−1 PLGA–BSA particles for 7 d (+PLGA). (b) Integrated optical density (IOD) obtained from (a). * indicates significant difference at p < 0.05 level. All gels were run under the same experimental conditions.

In summary, interaction with the PLGA–BSA particles can strongly promote the osteogenic differentiation of MSCs and impair the adipogenic differentiation (Fig. 10). This might be attributed to the alternation of p38 signaling pathway induced by the presence of PLGA–BSA particles, which can exert stronger force to the cytoskeleton and/or larger impact on intracellular organelles or molecules. However, the reason why the particles can alter p38 pathway is still unclear and requires delicate study to look at various signal transduction pathways. One possible mechanism is that the intracellular accumulation of these particles affects the MAPK pathway through the interaction with and/or reducing the present of G protein-coupled receptors (GPCRs) on the membrane of endosomes. We hope we can get more convincing results and theory in near future.


image file: c5ra07219k-f10.tif
Fig. 10 Schematic illustration summarizing the proposed differentiation mechanism of MSCs as a result of uptake of PLGA–BSA particles.

4. Conclusion

The submicron-sized PLGA–BSA particles were found to induce the osteogenic differentiation of MSCs with elevated ALP activity, calcium deposition, the expressions of collagen type I and osteocalcin at mRNA and protein levels. Meanwhile, they impaired the adipogenic differentiation with reduced expression of LPL at mRNA and protein levels. All these results suggest that the presence of the PLGA–BSA particles has a significant influence on the differentiation of MSCs via particle–cell interaction, suggesting this influence should be paid great attention for applications of the PLGA NPs in nanomedicine.

Acknowledgements

This study is financially supported by the Key Science Technology Innovation Team of Zhejiang Province (2013TD02), the Natural Science Foundation of China (51120135001), and the National Basic Research Program of China (2011CB606203).

Notes and references

  1. Q. Wang, L. Wang, M. S. Detamore and C. Berkland, Adv. Mater., 2008, 20, 236–239 CrossRef CAS PubMed.
  2. R. C. Mundargi, V. R. Babu, V. Rangaswamy, P. Patel and T. M. Aminabhavi, J. Controlled Release, 2008, 125, 193–209 CrossRef CAS PubMed.
  3. D. Yu, Y. Zhang, X. Zhou, Z. Mao and C. Gao, Biomacromolecules, 2012, 13, 3272–3282 CrossRef CAS PubMed.
  4. F. Danhier, E. Ansorena, J. M. Silva, R. Coco, A. Le Breton and V. Préat, J. Controlled Release, 2012, 161, 505–522 CrossRef CAS PubMed.
  5. S. Dhar, F. X. Gu, R. Langer, O. C. Farokhzad and S. J. Lippard, Proc. Natl. Acad. Sci. U. S. A., 2008, 105, 17356–17361 CrossRef CAS PubMed.
  6. C. Chuda, X. Sheng-Xue, B. Abdulgader, Y. Tatyana, S. J. Teruna and B. Cory, Eur. J. Pharm. Sci., 2009, 37, 141–150 CrossRef PubMed.
  7. K. Hu, Y. Shi, W. Jiang, J. Han, S. Huang and X. Jiang, Int. J. Pharm., 2011, 415, 273–283 CrossRef CAS PubMed.
  8. G. Tosi, L. Costantino, F. Rivasi, B. Ruozi, E. Leo, A. V. Vergoni, R. Tacchi, A. Bertolini, M. A. Vandelli and F. Forni, J. Controlled Release, 2007, 122, 1–9 CrossRef CAS PubMed.
  9. B. D. Klugherz, P. L. Jones, X. Cui, W. Chen, N. F. Meneveau, S. DeFelice, J. Connolly, R. L. Wilensky and R. J. Levy, Nat. Biotechnol., 2000, 18, 1181–1184 CrossRef CAS PubMed.
  10. H. Gupta, M. Aqil, R. K. Khar, A. Ali, A. Bhatnagar and G. Mittal, Nanomedicine: Nanotechnology, Biology, and Medicine, 2010, 6, 324–333 CrossRef CAS PubMed.
  11. F. Cui, K. Shi, L. Zhang, A. Tao and Y. Kawashima, J. Controlled Release, 2006, 114, 242–250 CrossRef CAS PubMed.
  12. P. Yilgor, K. Tuzlakoglu, R. L. Reis, N. Hasirci and V. Hasirci, Biomaterials, 2009, 30, 3551–3559 CrossRef CAS PubMed.
  13. P. Yilgor, N. Hasirci and V. Hasirci, J. Biomed. Mater. Res. Part A, 2010, 93, 528–536 CAS.
  14. M. Massignani, C. LoPresti, A. Blanazs, J. Madsen, S. P. Armes, A. L. Lewis and G. Battaglia, Small, 2009, 5, 2424–2432 CrossRef CAS PubMed.
  15. M. V. D. Z. Park, A. M. Neigh, J. P. Vermeulen, L. J. J. de la Fonteyne, H. W. Verharen, J. J. Briedé, H. van Loveren and W. H. de Jong, Biomaterials, 2011, 32, 9810–9817 CrossRef CAS PubMed.
  16. L. Florez, C. Herrmann, J. M. Cramer, C. P. Hauser, K. Koynov, K. Landfester, D. Crespy and V. Mailander, Small, 2012, 8, 2222–2230 CrossRef CAS PubMed.
  17. X. Huang, X. Teng, D. Chen, F. Tang and J. He, Biomaterials, 2010, 31, 438–448 CrossRef CAS PubMed.
  18. X. He, F. Liu, K. Wang, J. Ge, D. Qin, P. Gong and W. Tan, Chin. Sci. Bull., 2006, 51, 1939–1946 CrossRef CAS PubMed.
  19. C. He, Y. Hu, L. Yin, C. Tang and C. Yin, Biomaterials, 2010, 31, 3657–3666 CrossRef CAS PubMed.
  20. K. Yin Win and S.-S. Feng, Biomaterials, 2005, 26, 2713–2722 CrossRef PubMed.
  21. M. F. Pittenger, Science, 1999, 284, 143–147 CrossRef CAS.
  22. Y. Wang and X. Pei, Chin. Sci. Bull., 2003, 48, 1392–1396 CrossRef CAS.
  23. A. J. Engler, S. Sen, H. L. Sweeney and D. E. Discher, Cell, 2006, 126, 677–689 CrossRef CAS PubMed.
  24. B. Trappmann, J. E. Gautrot, J. T. Connelly, D. G. Strange, Y. Li, M. L. Oyen, M. A. Cohen Stuart, H. Boehm, B. Li, V. Vogel, J. P. Spatz, F. M. Watt and W. T. Huck, Nat. Mater., 2012, 11, 642–649 CrossRef CAS PubMed.
  25. D. E. Discher, D. J. Mooney and P. W. Zandstra, Science, 2009, 324, 1673–1677 CrossRef CAS PubMed.
  26. W. Luo, S. R. Jones and M. N. Yousaf, Langmuir, 2008, 24, 12129–12133 CrossRef CAS PubMed.
  27. S. Oh, K. S. Brammer, Y. S. Li, D. Teng, A. J. Engler, S. Chien and S. Jin, Proc. Natl. Acad. Sci. U. S. A., 2009, 106, 2130–2135 CrossRef CAS PubMed.
  28. D. S. Benoit, M. P. Schwartz, A. R. Durney and K. S. Anseth, Nat. Mater., 2008, 7, 816–823 CrossRef CAS PubMed.
  29. J. E. Phillips, T. A. Petrie, F. P. Creighton and A. J. Garcia, Acta Biomater., 2010, 6, 12–20 CrossRef CAS PubMed.
  30. M. J. Dalby, N. Gadegaard, R. Tare, A. Andar, M. O. Riehle, P. Herzyk, C. D. Wilkinson and R. O. Oreffo, Nat. Mater., 2007, 6, 997–1003 CrossRef CAS PubMed.
  31. H. Nikukar, S. Reid, P. M. Tsimbouri, M. O. Riehle, A. S. G. Curtis and M. J. Dalby, ACS Nano, 2013, 7, 2758–2767 CrossRef CAS PubMed.
  32. Q. Wang, Z. Gu, S. Jamal, M. S. Detamore and C. Berkland, Tissue Eng., Part A, 2013, 19, 2586–2593 CrossRef CAS PubMed.
  33. A. Neumann, A. Christel, C. Kasper and P. Behrens, RSC Adv., 2013, 3, 24222–24230 RSC.
  34. W. Song, K. Wu, J. Yan, Y. Zhang and L. Zhao, RSC Adv., 2013, 3, 11292–11300 RSC.
  35. S. Yang, M. Wang, H. Zhang, K. Cai, X. Shen, F. Deng, Y. Zhang and L. Wang, RSC Adv., 2014, 4, 65163–65172 RSC.
  36. C. L. Salgado, A. A. P. Mansur, H. S. Mansur and F. J. M. Monteiro, RSC Adv., 2014, 4, 49016–49027 RSC.
  37. Q. Wang, S. Jamal, M. S. Detamore and C. Berkland, J. Biomed. Mater. Res., Part A, 2011, 96, 520–527 CrossRef PubMed.
  38. Q. Wang, J. Wang, Q. Lu, M. S. Detamore and C. Berkland, Biomaterials, 2010, 31, 4980–4986 CrossRef CAS PubMed.
  39. H. Zeng, X. Li, F. Xie, L. Teng and H. Chen, J. Mater. Chem. B, 2014, 2, 3609–3617 RSC.
  40. D. Sarkar, J. A. Ankrum, G. S. Teo, C. V. Carman and J. M. Karp, Biomaterials, 2011, 32, 3053–3061 CrossRef CAS PubMed.
  41. J. S. Park, H. N. Yang, D. G. Woo, S. Y. Jeon, H.-J. Do, H.-Y. Lim, J.-H. Kim and K.-H. Park, Biomaterials, 2011, 32, 3679–3688 CrossRef CAS PubMed.
  42. J. Zhou, S. Moya, L. Ma, C. Gao and J. Shen, Macromol. Biosci., 2009, 9, 326–335 CrossRef CAS PubMed.
  43. J. Zhou, G. Romero, E. Rojas, S. Moya, L. Ma and C. Gao, Macromol. Chem. Phys., 2010, 211, 404–411 CrossRef CAS PubMed.
  44. Y. Zhu, Z. Mao and C. Gao, Biomacromolecules, 2013, 14, 342–349 CrossRef CAS PubMed.
  45. H. Wang, Y. Zhao, Y. Wu, Y. Hu, K. Nan, G. Nie and H. Chen, Biomaterials, 2011, 32, 8281–8290 CrossRef CAS PubMed.
  46. T.-H. Chung, S.-H. Wu, M. Yao, C.-W. Lu, Y.-S. Lin, Y. Hung, C.-Y. Mou, Y.-C. Chen and D.-M. Huang, Biomaterials, 2007, 28, 2959–2966 CrossRef CAS PubMed.
  47. H. Jin, D. A. Heller, R. Sharma and M. S. Strano, ACS Nano, 2009, 3, 149–158 CrossRef CAS PubMed.
  48. B. D. Chithrani and W. C. W. Chan, Nano Lett., 2007, 7, 1542–1550 CrossRef CAS PubMed.
  49. S. Jönsson, H. Hjorth-Hansen, B. Olsson, H. Wadenvik, A. Sundan and T. Standal, J. Bone Miner. Metab., 2012, 30, 119–123 CrossRef PubMed.
  50. C. B. Khatiwala, S. R. Peyton, M. Metzke and A. J. Putnam, J. Cell. Physiol., 2007, 211, 661–672 CrossRef CAS PubMed.
  51. C. Blomqvist, L. Risteli, J. Risteli, P. Virkkunen, S. Sarna and I. Elomaa, Br. J. Cancer, 1996, 73, 1074–1079 CrossRef CAS.
  52. A. Nakamura, Y. Dohi, M. Akahane, H. Ohgushi, H. Nakajima, H. Funaoka and Y. Takakura, Tissue Eng., Part C, 2009, 15, 169–180 CrossRef CAS PubMed.
  53. J. R. Jones, C. Barrick, K.-A. Kim, J. Lindner, B. Blondeau, Y. Fujimoto, M. Shiota, R. A. Kesterson, B. B. Kahn and M. A. Magnuson, Proc. Natl. Acad. Sci. U. S. A., 2005, 102, 6207–6212 CrossRef CAS PubMed.
  54. J. R. Mead, S. A. Irvine and D. P. Ramji, J. Mol. Med., 2002, 80, 753–769 CrossRef CAS PubMed.
  55. P. A. Jacobson, J. Biol. Chem., 1995, 270, 9420–9428 CrossRef PubMed.
  56. J. L. Ramírez-Zacarías, F. Castro-Muñozledo and W. Kuri-Harcuch, Histochemistry, 1992, 97, 493–497 Search PubMed.
  57. G. L. Johnson and R. Lapadat, Science, 2002, 298, 1911–1912 CrossRef CAS PubMed.
  58. K. A. Kilian, B. Bugarija, B. T. Lahn and M. Mrksich, Proc. Natl. Acad. Sci. U. S. A., 2010, 107, 4872–4877 CrossRef CAS PubMed.
  59. L. Zhao, L. Liu, Z. Wu, Y. Zhang and P. K. Chu, Biomaterials, 2012, 33, 2629–2641 CrossRef CAS PubMed.
  60. G. Kaur, M. T. Valarmathi, J. D. Potts, E. Jabbari, T. Sabo-Attwood and Q. Wang, Biomaterials, 2010, 31, 1732–1741 CrossRef CAS PubMed.
  61. A. Higuchi, Q.-D. Ling, Y. Chang, S.-T. Hsu and A. Umezawa, Chem. Rev., 2013, 113, 3297–3328 CrossRef CAS PubMed.
  62. J. Rauch, W. Kolch, S. Laurent and M. Mahmoudi, Chem. Rev., 2013, 113, 3391–3406 CrossRef CAS PubMed.
  63. U. Sydlik, K. Bierhals, M. Soufi, J. Abel, R. P. F. Schins and K. Unfried, Am. J. Physiol., 2006, 291, L725–L733 CAS.
  64. Y. Son, Y.-K. Cheong, N.-H. Kim, H.-T. Chung, D. G. Kang and H.-O. Pae, J. Signal Transduction, 2011, 2011, 792639 Search PubMed.
  65. C. Yi, D. Liu, C.-C. Fong, J. Zhang and M. Yang, ACS Nano, 2010, 4, 6439–6448 CrossRef CAS PubMed.

This journal is © The Royal Society of Chemistry 2015
Click here to see how this site uses Cookies. View our privacy policy here.