Electronic structures of two types of TiO2 electrodes: inverse opal and nanoparticulate cases

Taro Toyoda*ad, Witoon Yindeesuka, Tsuyoshi Okunoa, Masaya Akimotoa, Keita Kamiyamab, Shuzi Hayasecd and Qing Shen*ad
aDepartment of Engineering Science, The University of Electro-Communications, 1-5-1 Chofugaoka, Chofu, Tokyo 182-8585, Japan. E-mail: toyoda@pc.uec.ac.jp; shen@pc.uec.ac.jp; Fax: +81-42-443-5501; Tel: +81-42-443-5464
bBunkoukeiki Co. Ltd, 4-8 Takakura, Hachioji, Tokyo 192-0033, Japan
cGraduate School of Life Science and Systems Engineering, Kyushu Institute of Technology, 2-4 Hibikino, Wakamatsu-ku, Kitakyushu, Fukuoka 808-0196, Japan
dCore Research for Evolutional Science and Technology (CREST), Japan Science and Technology Agency (JST), 4-1-8 Honcho, Kawaguchi, Saitama 332-0012, Japan

Received 20th April 2015 , Accepted 21st May 2015

First published on 22nd May 2015


Abstract

We present a comparison between the electronic structures of inverse opal (IO) and nanoparticulate (NP)-TiO2 electrodes. The electronic structure details were obtained from optical absorption, fluorescence, and valence band studies in order to clarify the nature of the higher photovoltaic performance observed in sensitized solar cells using IO-TiO2 electrodes. We used photoacoustic (PA) and photoluminescence (PL) spectroscopy to characterize the optical absorption and fluorescence properties, respectively. Photoelectron yield (PY) spectroscopy was applied to characterize the position of the valence band maximum (VBM) of the IO- and NP-TiO2 electrodes. The PA spectrum for IO-TiO2 is different to that for NP-TiO2, indicating differences in the exciton–phonon interactions and the density of states in the conduction band. PL measurements showed that the curvature of the valence band structure of IO-TiO2 is different to that of NP-TiO2. Also, PL measurements showed that the oxygen vacancy in IO-TiO2 is different to that in NP-TiO2. Moreover, PY measurements showed VBM in IO-TiO2 to be at a higher position than that in NP-TiO2, suggesting a correlation with the increased open circuit voltage (Voc) in sensitized solar cells.

Introduction

Titanium dioxide (TiO2) is an important oxide semiconductor, used in numerous technological applications such as photocatalysis and solar energy conversion.1 Nanostructured TiO2 is of tremendous importance for improving charge collection efficiency and photochemical activity. For the last two decades, much attention has been devoted to dye-sensitized solar cells (DSCs) made from nanostructured TiO2 electrodes, firstly because of their high photovoltaic conversion efficiency, which exceeds 10%, and secondly, because the technology to manufacture them is low cost.1,2 In DSCs, the organic dye molecules, which act as photosensitizers, and nanostructured TiO2, which is the recipient/electron transport layer for electrons injected from the optically excited sensitizer, improve the light harvesting efficiency. One promising approach in the development of third-generation solar cells is to exchange the organic dye by semiconductor quantum dots (QD-sensitized solar cells: QDSCs). Firstly, semiconductor QDs can be utilized as photosensitizers, since their bandgap (or HOMO-LUMO gap) can be tuned by controlling the size of the dots so that the absorption spectrum matches the spectral distribution of sunlight.3 Secondly, they possess high extinction coefficients and large intrinsic dipole moments, leading to rapid charge separation.4 Thirdly, semiconductor QDs have the potential for multiple exciton generation (MEG), which can potentially increase the photovoltaic conversion efficiency up to 44%.5–8 For the last decade much attention has been devoted to QDSCs with nanostructured TiO2 electrodes.9–23

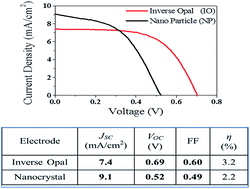
One of the main factors determining the photovoltaic performance of sensitized solar cells is the morphology of the TiO2 electrodes, which has an effect on the sensitizer assembly and, consequently, the photovoltaic conversion efficiency. The morphology of the TiO2 electrodes, including the crystal structure and surface orientation, is important, because this has a strong influence on the photovoltaic properties.19–21,24–26 In sensitized solar cells, the nanostructured TiO2 electrodes have a large surface area which increases the loading of the sensitizer thus enhancing light harvesting. On the other hand, the recombination process is proportional to the electrode surface area. The recombination process has a significant effect on the open-circuit voltage, Voc. A balance between recombination and light harvesting is needed to maximize solar cell performance.27,28 Another factor is the transport of photogenerated electrons through the nanostructured TiO2 electrode network. The results suggest that the photovoltaic conversion efficiency can be further enhanced by having a more efficient electron transport path through the TiO2 electrodes. To accomplish higher photovoltaic conversion efficiency, recent research has focused on using electrodes with an ordered structure rather than a randomly packed nanoparticulate TiO2 (NP-TiO2) structure.19,29,30 The relatively low photovoltaic conversion efficiency obtained with sensitized solar cells compared to that with conventional Si solar cells and the theoretical value of the Shockley–Queisser detailed balance limit (∼31%)31 are ascribed to the poor penetration of the sensitizers and redox couples into thick TiO2 electrodes. To address the penetration of both the sensitizers and the redox couples, an approach has been proposed using mesoporous inverse opal (IO)-TiO2 produced from self-organizing systems.32,33 IO-TiO2 electrodes have a honeycomb structure with large interconnected pores that lead to better infiltration despite the smaller surface area than NP-electrodes.19 In addition, depending on the filling fraction of the TiO2, a photonic bandgap is formed in the photonic crystal,34–37 which gives the possibility of enhancing the light harvesting efficiency. Photonic crystals have unique structural properties and optical characteristics, which have been utilized not only in solar cells11,12,20,38–45 but also in photocatalysis.46–48 In DSC and QDSC applications, there are several reports claiming that Voc can be increased by about 30% by using IO-TiO2 electrodes.11,12,19,41–45 In order to study the unique properties of IO structure in sensitized solar cell applications, the typical photovoltaic performance of CdSe QD-sensitized IO-TiO2 and NP-TiO2 solar cells were compared, which have been characterized in our laboratory, as shown in Fig. 1. The thickness of both TiO2 films was similar (∼3 μm). The short circuit current, Jsc, of solar cells with IO-TiO2 electrodes (7.4 mA cm−2) is a little smaller than those with NP-TiO2 electrodes (9.1 mA cm−2) in spite of the smaller specific surface area of IO-TiO2 electrode than that of NP-TiO2 electrode. A higher Voc is observed with IO-TiO2 electrodes compared to conventional NP-TiO2 electrode, resulting a higher photovoltaic conversion efficiency (3.2%) than that of NP-TiO2 case (2.2%), although the amount of CdSe QDs in the IO-TiO2 case is smaller than the NP-TiO2 due to the difference specific surface area.19 The higher Voc observed in the IO-TiO2 case is a superior characteristics compared to NO-TiO2 ones. However, the key factors that determine the enhancement of Voc still remain unclear. It appears that fundamental studies are needed to shed light on the underlying physics and chemistry governing the enhancement of the photovoltaic conversion efficiency. Nevertheless, a detailed analysis of the effects of the nanostructured morphology on the electronic structure of TiO2 has not yet been studied, neither experimentally nor theoretically. In this work, we compare the electronic structures of IO-TiO2 and NP-TiO2, the details for which were obtained from optical absorption, fluorescence, and valence band studies. A fundamental understanding of the comparison between the electronic structures including the surface chemistries of IO-TiO2 and NP-TiO2 is lacking, and this deficiency needs to be addressed to determine the factors leading to the enhancement of Voc. In general, it is necessary to develop suitable combinations of QDs and nanostructured TiO2 electrodes with different morphologies to enhance photovoltaic conversion efficiencies of QDSCs.


image file: c5ra07092a-f1.tif
Fig. 1 Current density–voltage characteristics in CdSe-sensitized IO-TiO2 and NP-TiO2 solar cells with the same thickness. Parameters in the photovoltaic solar cells are listed in the table.

Initially, information regarding the optical absorption properties of IO- and NP-TiO2 was needed to investigate the absorption edge and sub bandgap absorption with the aim of carrying out studies on photosensitization by QDs. The samples used in this study optically scatter light and we applied photoacoustic (PA) spectroscopy to measure the optical absorption characteristics. PA spectroscopy is a branch of photothermal spectroscopy in which heating the sample causes the selective absorption of the optical energy. The PA technique detects the acoustic energy produced by heat generated through nonradiative processes in materials.49 The PA signal is less sensitive to light scattering effects than conventional transmission signals.21,25,26,50–52 The PA sensitivity is higher for weak absorption than that of conventional transmission techniques due to the induced thermal energy. Hence, the technique is useful not only for optical absorption edge characterization but also for sub bandgap characterization. For characterizing the exciton and defect states in IO- and NP-TiO2, photoluminescence (PL) spectroscopy can be applied although the results in the literature on the PL characteristics of TiO2 are rarely consistent to explain this clearly.53 Moreover, PL spectroscopy has been employed as an important tool in studies of the electronic structures and optical properties of many different nanostructured materials,54,55 and therefore the differences between the electronic structures of IO- and NP-TiO2 can be obtained. In addition to the characterization by PA and PL spectroscopies, photoelectron yield (PY) spectroscopy56,57 is applied to characterize the position of the valence band maximum (VBM) which is correlated with the photovoltaic properties, especially Voc, since Voc is related to the difference between the Fermi level of the electrode material and the redox potential in the electrolyte. As PY spectroscopy does not need complex energy corrections in the data analysis, it is expected to have an advantage in analyzing dielectric materials. By utilizing this characteristic of PY spectroscopy, direct observations of the positions of VBM in IO- and NP-TiO2 can be realized with which the effect of morphological differences can be evaluated without the need for special techniques.

Experimental

Materials and chemicals

The preparation method for IO-TiO2 electrodes has been reported in a previous study.40 Fluorine-doped tin oxide (FTO) conducting glass (10 Ω sq−1) was ultrasonically cleaned in detergent, KOH, distilled water, and methanol. A uniform polystyrene (PS) latex suspension (474 nm in diameter) was agitated by ultrasound for 30 min to split the aggregated particles. The fabricated opal samples were prepared by dipping the FTO substrate vertically in a 0.1 wt% monodispersed PS suspension and evaporating the solvent in an oven at 40 °C slowly leaving behind a colloidal PS film on the substrate as a template.32 Then the TiO2 was brought into the voids in the template by the following method. A 10 μl drop of 2% TiCl4 in methanol was added via a micropipette onto the PS colloidal crystal surface. After hydrolysis for 30 min, the sample was subsequently heated to 80 °C in air. This process was repeated three times to ensure the filling of all the voids. Finally, the sample was heated at 450 °C for 1 h in air with a ramp rate of 0.5 °C min−1 to calcinate the template and anneal the TiO2. After calcination of the latex template, a honeycomb structure appeared with an ordered hexagonal pattern of spherical pores that connected each sphere to its nearest neighbors. Typical scanning electron microscopy (SEM) images of IO-TiO2 are shown in Fig. 2 ((a) top view; (b) side view). The diameter or center to center distance of the pores, referred to as the periodic lattice constant of IO-TiO2, was determined to be ∼380 nm (Fig. 2(a)) which shows the amount of shrinkage suffered by the 474 nm diameter PS latex particles. This structure consists of several layers connected to each other (Fig. 2(a) and (b)). The TiO2 thickness was measured as 3 μm using a contact profilometer (DEKTAC, ULVAC Co., Ltd, Japan). The reflection spectrum of IO-TiO2 using 474 nm PS latex particles had a peak at 710 nm, indicating that the IO-TiO2 has a photonic crystal character. This peak value is in good agreement with the Bragg reflection in a photonic crystal.40 In order to ascertain the influence the electrode morphology has, conventional NP-TiO2 electrodes were prepared by a combination of 15 nm NP-TiO2 (Super Titania, Showa Denko, Co., Ltd, Japan) and polyethylene glycol (molecular weight: 500[thin space (1/6-em)]000) in distilled water. In our experiments, we showed the optimal conditions for QDSCs was to use 15 nm NP-TiO2. The prepared pastes were applied onto FTO substrates using the doctor blade method, followed by sintering at 450 °C for 30 min in air. Typical SEM images of NP-TiO2 are shown in Fig. 3 ((a) top view; (b) side view), which shows a randomly packed NP-TiO2 structure both in the top and side views. The thickness was measured as 3 μm. The X-ray diffraction (XRD) patterns of IO- and NP-TiO2 are shown in Fig. 4. The characteristic diffraction peaks of both IO- and NP-TiO2 at 2θ values of 25.3°, 37.9°, 48.1°, 54.0°, 55.2°, and 62.8° can be assigned to the (101), (004), (200), (105), (211), and (204) faces of anatase TiO2, respectively.48 IO- and NP-TiO2 have similar XRD patterns, suggesting that the three-dimensional periodic structure (IO-TiO2) does not have an impact on the TiO2 crystalline phase. The crystallite domain sizes of IO- and NP-TiO2 were characterized by applying Scherrer equation in (101) XRD peak. The width of the half-maximum of the XRD peaks in (101) is identical with each other (∼0.015 rad). Hence, the crystal domain size of IO-TiO2 is same as that of NP-TiO2 (∼11 nm), also indicating that the three-dimensional periodic structure (IO-TiO2) does not have an impact on the TiO2 crystalline phase. Preliminary AFM observations show that IO-TiO2 wall consists of TiO2 nanoparticles with several tens order and size of NP-TiO2 is also close to several tens order consistent with the use of 15 nm nanoparticles (aggregation). The Brunauer–Emmett–Teller (BET) method was applied to characterize the specific surface areas of IO- and NP-TiO2. The specific surface areas of IO- and NP-TiO2 are 35 m2 g−1 and 80 m2 g−1, respectively, indicating that the former is smaller than the latter (one half of the latter).
image file: c5ra07092a-f2.tif
Fig. 2 Scanning electron microscopy (SEM) images of IO-TiO2 ((a) top view, (b) side view).

image file: c5ra07092a-f3.tif
Fig. 3 Scanning electron microscopy (SEM) images of NP-TiO2 ((a) top view, (b) side view).

image file: c5ra07092a-f4.tif
Fig. 4 X-ray diffraction (XRD) patterns of IO-TiO2 and NP-TiO2.

PA spectroscopic characterization

The optical absorption properties of IO- and NP-TiO2 were investigated using a single beam PA spectrometer. A typical gas-microphone technique was applied in the PA measurements.49 The sample was placed inside a closed cell (PA cell) containing air. The PA cell was composed of an aluminum cylinder with a small channel at the periphery in which a microphone was inserted. The light source was a 300 W xenon short arc lamp. Monochromatic light through a monochromator was modulated at frequencies of 33, 133, and 233 Hz to investigate the effect of saturation.49 Modulated monochromatic light was focused onto the sample surface located inside the sealed PA cell. Light absorbed by the sample was changed into periodic heating by a nonradiative process, which results in a pressure variation due to the air inside the cell (acoustic wave). The PA signal was monitored by first passing the microphone output through a preamplifier and then a lock-in amplifier synchronized with the modulation frequency. The data were averaged to improve the signal-to-noise ratio (S/N). The spectra were taken at room temperature in the wavelength range of 300–830 nm. The optical absorption length for wavelengths from 350 to 830 nm is longer than the thermal diffusion length and the thickness of sample, indicating that the PA signal intensity is proportional to the optical absorption coefficient.49 In this case (optically transparent and thermally thin solid conditions), the PA intensity (P) is given by the relationship,
 
P = Aβl, (1)
where A is a constant, β is the optical absorption coefficient, and l is the thickness of the sample.49 The spectra were calibrated by the PA measurement from a carbon black sheet that was proportional to the incident light intensity due to the fact that the optical absorption length is shorter than the thermal diffusion length in the wavelength range concerned.49 A UV cut filter was used for the measurements in the wavelength range of 600–830 nm to avoid mixing with second harmonic light. The experimental conditions for the measurements were fixed as far as possible to compare each of the PA spectra directly.

PL spectroscopic characterization

The PL spectra were measured using a He–Cd laser (325 nm, 20 mW) as an excitation light source at room temperature.58 When the semiconductor surface is illuminated by light with sufficient energy above the bandgap, photons are absorbed strongly. Electrons are excited from the VB to the conduction band (CB), leaving a hole in the VB. The electron and hole can recombine producing PL through several deexcitation processes. The PL was measured with a single monochromator and CCD detection. The spectra were taken at room temperature in the wavelength range of 350–900 nm.

PY spectroscopic characterization

The PY spectra were collected using an ionized energy measurement system (BIP-KV201, Bunkoukeiki, Co., Ltd., Japan). A negative bias was applied to a base plate behind the sample against the grounded anode for the PY measurements. The number of photoelectrons was obtained by measuring the current needed to compensate for the photoexcited holes at the sample with an ammeter. In the PY measurements, the photoemission yield Y was measured as a function of photon energy () and the value of the ionization potential (I) can be determined from the onset of the PY spectrum. The PY spectrum around the photoelectric threshold I is usually expressed by the following relation
 
Y = B(I)n, (2)
where B is a constant and n is a parameter which mainly depends on the shape of the density of electronic states at the upper edge of the occupied states and the transmission probability of electros across the surface.56 The square-root law (n = 2) and cube root law (n = 3) are often used for fitting the PY spectra of metals and organic materials, respectively.56,59 In this work, we employed n = 3 based on the theoretical analysis.56,59 The plot of the values of Y1/3 as a function of obtained here show a fairly linear relationship at the onset. The value of I was determined by extrapolating the linear part of Y1/3 to the baseline. An energy scan of the incident photons was performed while increasing the photon energy of the UV light (4–9.5 eV). The UV light was focused on the sample over an area of 1 × 3 mm2. All measurements were performed in a vacuum chamber (∼4 × 10⁻³ Pa) at room temperature.

Results and discussion

PA characteristics of IO- and NP-TiO2

The shape of the PA spectrum is independent of the modulation frequency concerned, indicating that the PA spectra reflect the optical absorption characteristics (the optical absorption length is longer than the thermal diffusion length). The influence of the absorption of the FTO (SnO2, bandgap: 3.6 eV) substrate is low, since the thickness of this is ∼500 nm thicker than that of TiO2 (∼3 μm). According to eqn (1) the PA intensity is proportional to the thickness of the sample. The spectra are normalized at a photon energy of 3.7 eV. To clarify the subtle distinction between the spectra for IO- and NP-TiO2, we show the logarithmic PA intensities ((a) IO-TiO2 and (b) NP-TiO2) at a modulation frequency of 133 Hz as a function of photon energy in Fig. 5. In the case of the semiconductors, both for direct and indirect transitions, the band edge as measured by the position of the knee (an inflection point) in the logarithmic PA spectrum agrees very well with the values recorded in the literature.60 Also, the low energy tail of the absorption edge depends exponentially on the photon energy (Urbach rule).61 Fig. 5 shows that the logarithmic PA intensity varies linearly as a function of photon energy in two regions (2.8–3.2 eV and 3.2–3.7 eV), indicating the possibility of two optical absorption processes.60 These two steps variations are inherent in TiO2 and are not due to instrumental reasons since other semiconductor samples, such as CdS and CdSe (direct transition case), show one step variation in PA intensity in our measurements similar to the ref. 60. The positions of the knees are shown as arrows (↑) in Fig. 5. The position in the lower energy region (2.8–3.2 eV) for the IO-TiO2 spectrum agrees with that in NP-TiO2 (∼3.2 eV), possibly indicating the first bandgap energy of anatase TiO2. A short modified energy level diagram of anatase TiO2 is depicted in Fig. 6, where Γ denotes the center of the Brillouin zone (BZ) and X the edge of BZ.62–64 The VB of anatase TiO2 is composed principally of oxygen 2p orbitals, with the corresponding wave functions considerably localized on the O2− lattice sites. The CB consists mostly of Ti4+ excited states.63 The arrows in Fig. 6 indicate direct allowed (image file: c5ra07092a-u1.tif: blue) and indirect allowed (image file: c5ra07092a-u2.tif: red) transitions, respectively. The level X2a is positioned at zero energy for simplicity.62–64 The positions of the first arrow in the lower energy region in both IO- and NP-TiO2 (2.8–3.2 eV, ∼3.2 eV) in Fig. 6 are ascribed to the indirect band transition, Γ3 → X1b, according to the ref. 62–64. The position of the second arrow in the higher energy region (3.2–3.7 eV) in IO-TiO2 (∼3.63 eV) is a little higher than that of NP-TiO2 (∼3.52 eV). The possible reason for the difference in the position of the arrows between IO- and NP-TiO2 is the difference in thermal properties between IO- and NP-TiO2.49 However, the positions of the arrows in the IO- and NP-TiO2 spectra are independent of the modulation frequency, indicating that there is little possibility of a difference in thermal properties. Within the experimental accuracy, those positions are ascribed to the direct band transitions, X2b → X1b for IO-TiO2 (theoretical value: 3.59 eV) and X1a → X1b (theoretical value: 3.45 eV) for NP-TiO2, respectively.62–64 Two steps variations similar to our results with indirect and direct transitions in absorption spectra were measured in Ge (indirect transition: 0.62 eV; direct transition: 0.81 eV) and Si (indirect transition: 1.06 eV; direct transition: 2.5 eV).65 Thus, indirect and direct band transitions in TiO2 can be observed separately by applying PA spectroscopy, owing to the lower sensitivity to light scattering effect.
image file: c5ra07092a-f5.tif
Fig. 5 Photoacoustic (PA) spectra of (a) IO-TiO2 and (b) NP-TiO2 (semi-logarithmic scale).

image file: c5ra07092a-f6.tif
Fig. 6 Short energy diagram of anatase TiO2.63,64

Preliminary, we have prepared IO-TiO2 by applying the different TiO2 precursor with mixtures of absolute ethanol, hydrochloric acid, tetrabutyl titanate, and deionized water.66 The PA spectra of IO-TiO2 with different precursor and different periodic constant (200–600 nm) showed the same spectra which were identical with Fig. 5, indicating the possibility that the PA spectrum in IO-TiO2 is independent of preparation method and periodic constant.

Studies of the exponential tail (Urbach rule) give basic information about the exciton–phonon interaction, band structure, and disordered states.67–72 Here, we analyze and discuss the Urbach tails in the PA spectra of IO- and NP-TiO2 using phenomenological models that have been extensively used for semiconductors.61 The dependence of the PA intensity of the exponential tail on the photon energy at a given temperature (T) is given by the empirical relationship

 
image file: c5ra07092a-t1.tif(3)
where P is the PA intensity as a function of photon energy (), h is Planck's constant, ν is frequency ( corresponds to photon energy), k is the Boltzmann constant, and P0, σ, νo are fitting parameters.61 Here, σ is a characteristic of the logarithmic slope (exponential tail) below the fundamental absorption edge and is called the steepness parameter. Also, the Urbach energy is defined as EU = kT/σ, which indicates the width of the exponential tail in the PA spectra. We assume that the value of σ (or EU) in the lower energy region (2.8–3.2 eV) is a reflection of the exciton–photon interaction in the oxide semiconductor crystal.73 In this model, the interaction of excitons with a phonon causes the Urbach tail. The effects of disorders and impurities are taken into account in the exciton–phonon interaction. When the exciton–phonon interaction increases, the optical absorption below the band edge energy increases. Hence, the value of σ decreases or EU increases. Toyozawa and co-workers, ascribed the Urbach tail to the influence of phonon fields on the center-of-mass motion of excitons, i.e., the momentary self-trapping of excitons.73,74 Smaller σ (or larger EU) corresponds to a broader Urbach tail, and hence to larger exciton–phonon interactions, which has been generally accepted on the basis of various kinds of observation. The steepness parameter is proportional to the inverse of the exciton–phonon coupling constant.75 In the lower energy region (2.8–3.2 eV), the value of σ in IO-TiO2 (0.043 or EU = 600 meV) is smaller than that in NP-TiO2 (0.066 or EU = 390 meV) (Fig. 5), indicating that the exciton–phonon interaction in IO-TiO2 is higher than that in NP-TiO2 including the effect from the oxygen vacancies which is discussed later. In the higher energy region (3.2–3.7 eV), we assume that the value of σ (or EU) is a reflection of the band structure, especially the density of states, in the oxide semiconductor crystal with the hypothesis that the optical transition probability in IO-TiO2 is the same as that in NP-TiO2. In the higher energy region (3.2–3.7 eV), the value of σ in IO-TiO2 (0.215 or EU = 120 meV) is higher than that in NP-TiO2 (0.130 or EU = 200 meV), indicating a higher density of states in the conduction band in IO-TiO2 than that in NP-TiO2. The possibility of the higher density of states in the conduction band of IO-TiO2 is the overlap of wavefunctions due to a long-range electronic connectivity.

The absence of visible absorption peaks in the PA measurements below a photon energy of 3.0 eV in Fig. 5 does not indicate that oxygen vacancies are absent in IO- and NP-TiO2. As IO- and NP-TiO2 are luminescent materials (the details are discussed later), when an optically excited energy level decays via luminescence partially (radiative transition), a lower PA signal is produced due to the fact that PA signal is proportional to nonradiative transition probabilities.60 The PA intensities of IO-TiO2 below a photon energy of 3.0 eV are one half smaller than those of NP-TiO2, indicating the possibility that the radiative transition probabilities by defect states in IO-TiO2 is higher than that of NP-TiO2 in the photon energy region. In the future, the comparison of the PL excitation spectra and PA spectra of IO- and NP-TiO2 are needed to reveal the relaxation processes of photoexcited electrons.

PL characteristics of IO- and NP-TiO2

In order to confirm the presence of defects in IO- and NP-TiO2, PL measurements were carried out on those samples. The PL method is a sensitive technique for finding the presence of defect related excitation peaks. The excitation wavelength used was 325 nm, corresponding to a photon energy of 3.82 eV, higher than the indirect and direct bandgaps of the investigated TiO2. At first step, time resolved PL spectra were attempted over 1 ms time domain both in IO- and NP-TiO2 to investigate the nature of luminescence. As a result of the measurements, no luminescence signals were detected over 1 ms time domain, indicating the possibility that the luminescence is not phosphorescence but fluorescence. Also, there is a possibility that the IO- and NP-TiO2 show fluorescence, since IO- and NP-TiO2 indicate anatase structures in which lifetime is several tens of ns according to the ref. 76 and 77. The PL spectra of IO- and NP-TiO2 are shown in Fig. 7. The PL spectra have broad bands in the visible range. The PL spectrum for IO-TiO2 exhibits three distinct luminescence peaks at ∼3.2 eV (↑: black), ∼3.1 eV (image file: c5ra07092a-u3.tif: red), and ∼2.2 eV with a broad band from 1.8 to 2.5 eV (image file: c5ra07092a-u4.tif). The PL spectrum for NP-TiO2 also exhibits three distinct peaks at ∼3.2 eV (↑: black), ∼2.9 eV (image file: c5ra07092a-u5.tif: red), and ∼2.6 eV (image file: c5ra07092a-u6.tif: blue). The peaks at ∼3.2 eV in IO- and NO-TiO2 are attributed to phonon assisted indirect transition from X1b → Γ3 in the Brillouin zone.62–64 IO- and NP-TiO2 exhibit intense emission peaks at ∼3.1 eV and ∼2.9 eV, respectively, which are assigned to self-trapped excitons (STE) localized on TiO6 octahedra.78–80 The difference between the bottom of the conduction band and the self-trapped exciton state (E1) in IO-TiO2 is smaller (∼0.1 eV) than that in NP-TiO2 (∼0.3 eV). The value of E1 is given by the relationship (hydrogen model)
 
image file: c5ra07092a-t2.tif(4)
where A is a constant, m0 is the electron rest mass, ε is the dielectric constant of the semiconductor, and μ is the reduced mass.81 The reduced mass is defined as μ−1 = me*−1 + mh*−1, where me* and mh* are the electron and hole effective masses, respectively. In general, the values for the effective electron and hole masses of TiO2 are me* ≥ 10m0 and mh* ≈ 0.8m0, respectively.82 Therefore, mh* is predominant in determining the value of E1 (E1mh*). The PL measurements show that the reduced mass μ of IO-TiO2 is smaller than that of NO-TiO2, suggesting that mh* of IO-TiO2 is smaller than that of NP-TiO2. The effective mass is defined as the inverse of the curvature of the Ek curve (band structure). So, there is a difference in the valence band structure between IO- and NP-TiO2, indicating that the curvature of the Ek curve on the valence band in IO-TiO2 is larger than that in NP-TiO2. The larger curvature of the Ek curve on the valence band of IO-TiO2 is the overlap of wavefunctions due to a long-range electronic connectivity.

image file: c5ra07092a-f7.tif
Fig. 7 Photoluminescence (PL) spectra of IO- and NP-TiO2.

The PL bands on the lower photon energy side of anatase TiO2 nanoparticles have been attributed to oxygen vacancies at the surface.63 In the lower photon energy region, IO- and NP-TiO2 exhibit oxygen vacancy related emission peaks at ∼2.2 eV and ∼2.6 eV, respectively, in agreement with the reported values.63 We suppose that there are two possibilities to identify those two emission peaks. One possibility is as follows. Since TiO2 is semi-covalent material83,84 (iconicity: ∼50%), the two emission peaks are ascribed to F+ (∼2.2 eV) and F (∼2.6 eV) centers, respectively, referred to the ref. 79, 80 and 85. The F+ and F centers are oxygen-ion vacancies, the former with a trapped single electron and the latter occupied by two electrons. In IO-TiO2, the oxygen vacancies of the F+ centers might be larger than those in NP-TiO2 and there is a possibility that those of the F centers are smaller than NP-TiO2, indicating a difference in the vacancy structure between IO- and NP-TiO2. Another possibility of the two peaks is the difference of the stoichiometry in IO- and NP-TiO2. Preliminary, we have measured the PL of IO-TiO2 which are prepared by different method66 as mentioned in the PA spectroscopic characterization. The PL spectra showed the similar spectra as in Fig. 7. In this respect, it is important to investigate the differences in the concentration of oxygen vacancies. Detailed experiments on the concentration and electronic structure of oxygen vacancies are desirable for future investigations to clarify the nature of the difference of the vacancy states in IO- and NP-TiO2. Also, the comparison of the PA and PL excitation spectra between IO- and NP-TiO2 are needed to reveal the nature of electronic structure and oxygen vacancy states in the future.

PY characteristics of IO- and NP-TiO2

Fig. 8 shows the PY spectra ((a) IO-TiO2 and (b) NP-TiO2) as a function of photon energy. As the PY signal intensity has a good S/N ratio, an error bar is included for each point. The positions of VBM of IO- and NP-TiO2 can be regarded as the ionization potential on the basis of the intersection of the tangent to the spectra with the baseline. We applied straight lines above a photon energy of 8.3 eV (linear region). The positions of VBM measured for IO- and NP-TiO2 were −7.38 ± 0.05 and −7.52 ± 0.05 eV, respectively. Fig. 9 shows the relative band edge positions of VBM and CBM for IO- and NP-TiO2 together with those for the (111), (101), and (001) surfaces of anatase TiO2 single crystal. The band gap value of 3.2 eV from the results in Fig. 5 is used for both IO- and NP-TiO2 to determine the positions of the conduction minimum (CBM). The positions of VBM for (111), (101), and (001) surfaces of anatase TiO2 single crystals are −7.67 ± 0.05, −7.57 ± 0.05, and −7.70 ± 0.05 eV, respectively, showing slight difference between each surfaces. The observed positions of VBM in anatase single crystals are different from those observed in rutile TiO2 single crystals, indicating differences in the electronic structure and surface states.26 The positions of VBM and CBM in IO-TiO2 are higher than those in NP-TiO2. Also, the positions of VBM and CBM in IO-TiO2 are higher than those for the (111), (101), and (001) surfaces of anatase TiO2 single crystals. Anatase TiO2 single crystal has a few fundamental low-index facet systems. Typical anatase TiO2 single crystals, including natural grown crystals, consist mostly of (101) surfaces (∼80%) due to the much greater stability of this surface than the other surfaces due to its lower surface energy. Therefore, the characteristics of TiO2 nanoparticles have mostly been attributed to the (101) surface.86 The position of VBM in NP-TiO2 (−7.52 eV) is close to that of the (101) surface of anatase TiO2 (−7.57 eV), indicating that NP-TiO2 consists mostly of (101) surfaces. Therefore, the higher position of VBM of IO-TiO2 than that of NP-TiO2 cannot be explained by a special surface orientation effect. The ionization potential of the surface of a semiconductor material is defined as the difference in the potential energy of an electron between the vacuum level and the position of VBM. The vacuum level is the energy of an electron at rest at a point sufficiently far outside the surface so that the electrostatic image force on the electron is neglected. The orientation of the exposed crystal surface affects the value of the ionization potential because the strength of the electric double layer at the surface depends on the concentration of positive ion cores on the surface. The double layer exists because the surface ions are in an asymmetrical environment, with vacuum on one side and the substrate on the other. Therefore, the PY measurements show that the formation of the double layer in IO-TiO2 is different from that in NP-TiO2. Recently, a method to produce a low-work function electrode by surface modification was realized.87 The surface of IO-TiO2 has a larger distribution of oxygen vacancies assumed to F+ centers with trapped single electrons than NP-TiO2. As a result, the electric double layer in IO-TiO2 is different from that in NP-TiO2, indicating that IO-TiO2 is polarized with a more positive dipole moment towards the vacuum level88 than that of NP-TiO2. Hence, the ionization potential in IO-TiO2 is lower than that in NP-TiO2, and a higher position of VBM in IO-TiO2 (lower-ionization potential) than that in NP-TiO2 (higher-ionization potential) can be achieved, suggesting a correlation with the increased Voc in sensitized solar cells. Moreover, Hanmin et al. proposed the influencing factors for Voc of sensitized solar cells.89 The main influencing factors are the electron back-propagation constant Ket and the semiconductor light-free concentration n0. Our preliminary Voc decay measurement of IO-TiO2 shows longer decay time (∼8 s) than that of NP-TiO2 (∼1 s), indicating that the Ket of IO-TiO2 is lower than that of NP-TiO2. Lower Ket corresponds to the increase of Voc.89 Also, n0 of IO-TiO2 is higher than that of NO-TiO2, since the density of states of IO-TiO2 in conduction band is higher than that of NP-TiO2. Higher n0 corresponds to the increase of Voc.89 These facts suggest the possibility of the increase of Voc in IO-TiO2.
image file: c5ra07092a-f8.tif
Fig. 8 Photoelectron yield (PY) spectra of (a) IO-TiO2 and (b) NP-TiO2.

image file: c5ra07092a-f9.tif
Fig. 9 Relative band edge positions of the valence band maximum (VBM), the conduction band minimum (CBM) together with those on the (111), (101), and (001) surfaces of anatase TiO2 single crystals.

Conclusions

One of the main factors determining the photovoltaic performance in sensitized solar cells is the morphology of the TiO2 electrode. The assembly of the sensitizers depends on the morphology and using a suitable morphology can lead to improvements in the photovoltaic conversion efficiency. A higher open circuit voltage, Voc, was observed with IO-TiO2 electrodes compared to conventional NP-TiO2 electrodes. However, the key factors that determine the enhancement of Voc still remain unclear. It appears that fundamental studies are needed to shed light on the underlying physics and chemistry governing the enhancement of Voc. Optical absorption measurements by the PA method showed that indirect and direct transitions can be observed in IO- and NP-TiO2. The indirect bandgaps of IO- and NP-TiO2 are similar to each other (∼3.2 eV), and the direct bandgaps of them are ∼3.6 eV and ∼3.5 eV, respectively, indicating differences in the electronic structure. The density of states in the conduction band of IO-TiO2 is larger than that of NP-TiO2. Analysis of the Urbach tail shows there is a higher exciton–phonon interaction in IO-TiO2 than in NP-TiO2. Indirect PL and exciton PL can be observed. Also, PL due to oxygen vacancies was observed. The PL spectra suggest differences in the valence band structure between IO- and NP-TiO2, indicating that the curvature in the valence band of IO-TiO2 (Ek curve) is larger than that of NP-TiO2. The position of VBM for IO-TiO2 is higher than that for NP-TiO2, indicating that the surface of IO-TiO2 is polarized with a more positive dipole moment towards the vacuum level than that of NP-TiO2. Hence, the formation of a double layer in the former is different from that in the latter due to the differences in the formation of oxygen vacancies, suggesting a correlation with the increased Voc in sensitized solar cells.

Acknowledgements

Part of this work was supported by Core Research for Evolutional Science and Technology (CREST), Japan Science Technology Agency (JST). Also, it was supported by JSPS Kakenhi Grant Number 26390016. We also thank T. Amano and Y. Takeshita of Bunkoukeiki Co., Ltd. for cooperation with the photoelectron yield spectroscopy measurements. We wish to acknowledge D. Tai, Y. Kuwano, and M. Hironaka for helping the sample preparation.

Notes and references

  1. X. Chen and S. S. Mao, Chem. Rev., 2007, 107, 2891–2959 CrossRef CAS PubMed.
  2. M. A. Green, K. Emery, K. Hishikawa, W. Warta and E. D. Dunlop, Prog. Photovoltaic. Res. Appl., 2012, 20, 12–20 CrossRef PubMed.
  3. W. W. Yu, L. Qu, W. Guo and X. Pen, Chem. Mater., 2003, 15, 2854–2860 CrossRef CAS.
  4. E. F. Underwood, T. Kippeny and S. J. Rosental, Eur. Phys. J. D, 2001, 16, 241–244 CrossRef.
  5. A. J. Nozik, Phys. E, 2002, 14, 115–120 CrossRef CAS.
  6. R. D. Schaller, M. Sykora, J. M. Pietryga and V. I. Klimov, Nano Lett., 2006, 6, 424–429 CrossRef CAS PubMed.
  7. V. I. Klimov, J. Phys. Chem. B, 2006, 110, 16827–16845 CrossRef CAS PubMed.
  8. M. T. Trinh, A. J. Houtepen, J. M. Schins, T. Hanrath, J. Piris, W. Knulst, A. P. L. M. Goossens and L. D. A. Siebbeles, Nano Lett., 2008, 8, 1713–1718 CrossRef PubMed.
  9. Q. Shen, D. Arae and T. Toyoda, J. Photochem. Photobiol., A, 2004, 164, 75–80 CrossRef CAS PubMed.
  10. O. Niitsoo, S. K. Sarkar, P. Pejoux, R. Rühle, D. Cahen and G. Hodes, J. Photochem. Photobiol., A, 2006, 182, 306–311 CrossRef PubMed.
  11. L. J. Diguna, Q. Shen, A. Sato, K. Katayama, T. Sawada and T. Toyoda, Mater. Sci. Eng., C, 2007, 27, 1514–1520 CrossRef CAS PubMed.
  12. L. J. Diguna, Q. Shen, J. Kobayashi and T. Toyoda, Appl. Phys. Lett., 2007, 91, 023116 CrossRef PubMed.
  13. A. Kongkanand, K. Tvrdy, K. Takechi, M. Kuno and P. V. Kamat, J. Am. Chem. Soc., 2008, 130, 4007–4015 CrossRef CAS PubMed.
  14. I. Mora-Seró, S. Giménez, F. Fabregat-Santiago, R. Gómez, Q. Shen, T. Toyoda and J. Bisquert, Acc. Chem. Res., 2009, 42, 1848–1857 CrossRef PubMed.
  15. I. Mora-Seró and J. Bisquert, J. Phys. Chem. Lett., 2010, 1, 3046–3052 CrossRef.
  16. H. Tada, M. Fujishima and H. Kobayashi, Chem. Soc. Rev., 2011, 40, 4232–4243 RSC.
  17. K. Tvrdy, P. A. Frantsukov and P. V. Kamat, Proc. Natl. Acad. Sci. U. S. A., 2011, 108, 29–34 CrossRef CAS PubMed.
  18. S. Emin, S. P. Singh, L. Han, N. Satoh and A. Islam, Sol. Energ., 2011, 85, 1264–1282 CrossRef CAS PubMed.
  19. T. Toyoda and Q. Shen, J. Phys. Chem. Lett., 2012, 3, 1885–1893 CrossRef CAS.
  20. W. Yindeesuk, Q. Shen, S. Hayase and T. Toyoda, AIP Adv., 2013, 3, 102115 CrossRef PubMed.
  21. T. Toyoda, Y. Onishi, K. Katayama, T. Sawada, S. Hayase and Q. Shen, J. Mater. Sci. Eng. A, 2013, 3, 601–608 CAS.
  22. M. A. Becker, J. G. Radich, B. A. Bunker and P. V. Kamat, J. Phys. Chem. Lett., 2014, 5, 1575–1582 CrossRef CAS.
  23. M. Fujishima, K. Tanaka, N. Sakami, M. Wada, K. Morii, T. Hattori, Y. Sumida and H. Tada, J. Phys. Chem. C, 2014, 118, 8917–8924 CAS.
  24. N.-G. Park, J. van de Lagemaat and A. J. Frank, J. Phys. Chem. B, 2000, 104, 8989–8994 CrossRef CAS.
  25. T. Toyoda, T. Uehata, R. Suganuma, S. Tamura, A. Sato, K. Yamamoto, Q. Shen and N. Kobayashi, Jpn. J. Appl. Phys., 2007, 46, 4616–4621 CrossRef CAS.
  26. T. Toyoda, W. Yindeesuk, K. Kamiyama, S. Hayase and Q. Shen, J. Phys. Chem. C, 2014, 118, 16680–16687 CAS.
  27. P. Sudhagar, T. Song, D.-H. Lee, I. Mora-Seró, J. Bisquert, M. Laudenslager, W. M. Sigmund, W. Il Park, U. Paik and Y.-S. Kang, J. Phys. Chem. Lett., 2011, 2, 1984–1990 CrossRef CAS.
  28. J. Xu, X. Yang, H. Wang, X. Chen, C. Luan, Z. Xu, Z. Lu, V. A. Roy, W. Zhang and C.-S. Lee, Nano Lett., 2011, 11, 4138–4143 CrossRef CAS PubMed.
  29. A. S. Nair, R. Jose, Y. Shengyuan and S. Ramakrishna, J. Colloid Interface Sci., 2011, 353, 39–45 CrossRef CAS PubMed.
  30. O. K. Varghse, M. Paulose and C. A. Grimes, Nat. Nanotechnol., 2009, 4, 592–597 CrossRef PubMed.
  31. W. Shockley and H. J. Queisser, J. Appl. Phys., 1961, 32, 510–519 CrossRef CAS PubMed.
  32. J. E. G. J. Wijnhoven and W. L. Vos, Science, 1998, 281, 802–804 CrossRef CAS.
  33. P. Lodahl, A. Floris van Driel, I. S. Nikolaev, A. Irman, K. Overgaag, D. Vanmaekelbergh and W. L. Vos, Nature, 2004, 430, 654–657 CrossRef CAS PubMed.
  34. E. Yablonovitch, Phys. Rev. Lett., 1987, 58, 2059–2062 CrossRef CAS.
  35. K. Sakoda, M. Sasada, T. Fukushima, A. Yamanaka, N. Kawai and K. Inoue, J. Opt. Soc. Am. B, 1999, 16, 361–365 CrossRef CAS.
  36. Z.-Z. Gu, S. kubo, W. Qian, Y. Einaga, D. A. Tryk, A. Fujishima and O. Sato, Langmuir, 2001, 17, 6751–6753 CrossRef CAS.
  37. D. Wang, A. L. Rogach and F. Caruso, Chem. Mater., 2003, 15, 2724–2729 CrossRef CAS.
  38. S. Nishimura, N. Abrams, B. A. Lewis, L. I. Halaoui, T. E. Mallouk, K. D. Benkstein, J. van de Lagemaat and A. J. Frank, J. Am. Chem. Soc., 2003, 125, 6306–6310 CrossRef CAS PubMed.
  39. L. I. Halaoui, N. M. Abram and T. E. Mallouk, J. Phys. Chem. B, 2005, 109, 6334–6442 CrossRef CAS PubMed.
  40. L. J. Diguna, M. Murakami, A. Sato, Y. Kumagai, T. Ishihara, N. Kobayashi, Q. Shen and T. Toyoda, Jpn. J. Appl. Phys., 2006, 45, 5563–5568 CrossRef CAS.
  41. M. El Harakeh and L. I. Halaoui, J. Phys. Chem. C, 2010, 114, 2806–2813 CAS.
  42. J.-H. Shin and J.-H. Moon, Langmuir, 2011, 27, 6311–6315 CrossRef CAS PubMed.
  43. Y.-G. Seo, K. Woo, J. Kim, H. Lee and W. Lee, Adv. Funct. Mater., 2011, 21, 3094–3103 CrossRef CAS PubMed.
  44. M. Samadpour, S. Giménez, P. P. Boix, Q. Shen, M. E. Calvo, N. Taghavunia, A. Iraji zad, T. Toyoda, H. Míguez and I. Mora-Seró, Electrochim. Acta, 2012, 75, 139–147 CrossRef CAS PubMed.
  45. H.-N. Kim and J.-H. Moon, Curr. Appl. Phys., 2013, 13, 841–845 CrossRef PubMed.
  46. S. Meng, D. Li, X. Zheng, J. Wang, J. Chen, J. Fang, Y. Shao and X. Fu, J. Mater. Chem. A, 2013, 1, 2744–2747 CAS.
  47. S. Lee, Y. Lee, D.-H. Kim and J.-H. Moon, ACS Appl. Mater. Interfaces, 2013, 5, 12526–12532 CAS.
  48. X. Zheng, S. Meng, J. Chen, J. Wang, J. Xian, Y. Shao, X. Fu and D. Li, J. Phys. Chem. C, 2013, 117, 21263–21273 CAS.
  49. A. Rosencwaig and A. Gersho, J. Appl. Phys., 1976, 47, 64–69 CrossRef PubMed.
  50. Y. Inoue, T. Toyoda and J. Morimoto, Jpn. J. Appl. Phys., 2006, 46, 4604–4608 CrossRef.
  51. T. Toyoda, S. Tsugawa and Q. Shen, J. Appl. Phys., 2009, 105, 034314 CrossRef PubMed.
  52. T. Toyoda, K. Oshikane, D. Li, Y. Luo, Q. Meng and Q. Shen, J. Appl. Phys., 2010, 108, 114302 CrossRef PubMed.
  53. H. Yoo, M. Kim, C. Bae, S. Lee, H. Kim, T. K. Ahn and H. Shen, J. Phys. Chem. C, 2014, 118, 9726–9732 CAS.
  54. J. Marzin, J. Gérard, A. Izraël, D. Barrier and G. Bastard, Phys. Rev. Lett., 1994, 73, 716–719 CrossRef CAS.
  55. N. Greenham, X. Peng and A. Alivisatos, Phys. Rev. B: Condens. Matter Mater. Phys., 1996, 54, 17628–17637 CrossRef CAS.
  56. M. Honda, K. Kanai, K. Komatsu, Y. Ouchi, H. Ishii and K. Seki, J. Appl. Phys., 2007, 102, 103704 CrossRef PubMed.
  57. Y. Nakayama, S. Machida, T. Minari, K. Tsukagishi, Y. Noguchi and H. Ishii, Appl. Phys. Lett., 2008, 93, 173305 CrossRef PubMed.
  58. K. Kawabata, Y. Nanai, S. Kimura and T. Okuno, Appl. Phys. A, 2012, 107, 213–220 CrossRef CAS.
  59. J. M. Ballantyne, Phys. Rev. B: Condens. Matter Mater. Phys., 1972, 6, 1436–1455 CrossRef CAS.
  60. A. Rosencwaig, Anal. Chem., 1975, 47, 592A–604A CrossRef CAS.
  61. F. Urbach, Phys. Rev., 1953, 92, 1324 CrossRef CAS.
  62. N. Daude, C. Gout and C. Jouanin, Phys. Rev. B: Condens. Matter Mater. Phys., 1977, 15, 3229–3235 CrossRef CAS.
  63. N. Serpone, D. Lawless and R. Khairutdinov, J. Phys. Chem., 1995, 99, 16646–16654 CrossRef CAS.
  64. N. D. Abazović, M. I. Čomor, M. D. Dramićanin, D. J. Jovanović, S. P. Ahrenkiel and J. M. Nededljković, J. Phys. Chem. B, 2006, 110, 25366–25370 CrossRef PubMed.
  65. W. C. Dash and R. Newman, Phys. Rev., 1955, 99, 1151–1155 CrossRef CAS.
  66. X. Zhang, Y. Liu, S.-T. Lee, S. Yang and Z. Kang, Energy Environ. Sci., 2014, 7, 1409–1419 CAS.
  67. G. D. Cody, T. Tiedje, B. Abeles and Y. Goldstein, Phys. Rev. Lett., 1981, 47, 1480–1483 CrossRef CAS.
  68. A. Meeder, D. Fuertes Marrón, A. Rumberg and M. Ch. Lux-Steiner, J. Appl. Phys., 2002, 92, 3016–3020 CrossRef CAS PubMed.
  69. D. A. Drabold, Y. Li, B. Cal and M. Zhang, Phys. Rev. B: Condens. Matter Mater. Phys., 2011, 83, 045201 CrossRef.
  70. D. A. Jones and J. U. Lee, Nano Lett., 2011, 11, 4176–4179 CrossRef CAS PubMed.
  71. S. De Wolf, J. Holovsky, S.-J. Moon, P. Löper, B. Niesen, M. Ledinsky, F.-J. Haug, J.-H. Yum and C. Ballif, J. Phys. Chem. Lett., 2014, 5, 1035–1039 CrossRef CAS.
  72. A. Sadhanala, F. Deschler, T. H. Thomas, S. E. Dutton, K. C. Goedel, F. C. Hanusch, M. L. Lai, U. Steiner, T. Bein, P. Docampo, D. Cahen and R. H. Friend, J. Phys. Chem. Lett., 2014, 5, 2501–2505 CrossRef CAS.
  73. H. Sumi and Y. Toyozawa, J. Phys. Soc. Jpn., 1971, 31, 342–358 CrossRef CAS.
  74. M. Schreiber and Y. Toyozawa, J. Phys. Soc. Jpn., 1982, 51, 1528–1536 CrossRef CAS.
  75. H. Tang, F. Lévy, H. Berger and P. E. Schmid, Phys. Rev. B: Condens. Matter Mater. Phys., 1995, 52, 7771–7774 CrossRef CAS.
  76. L. Cavigli, F. Bogani, A. Vinattieri, V. Faso and G. Baldy, J. Appl. Phys., 2009, 106, 053516 CrossRef PubMed.
  77. Y. Yamada and Y. Kanemitsu, Appl. Phys. Lett., 2012, 101, 133907 CrossRef PubMed.
  78. J. Preclíková, P. Galář, F. Trojánek, S. Daniš, B. Rezek, I. Gregora, Y. Némcová and P. Malý, J. Appl. Phys., 2010, 108, 113502 CrossRef PubMed.
  79. Y. Lei, L. D. Zhang, G. W. Meng, G. H. Li, X. Y. Zhang, C. H. Liang, W. Chen and S. X. Wang, Appl. Phys. Lett., 2001, 78, 1125–1127 CrossRef CAS PubMed.
  80. B. Choudhury and A. Choudhury, Physica E, 2014, 56, 364–371 CrossRef CAS PubMed.
  81. R. J. Elliot, Phys. E, 1957, 108, 1387–1389 Search PubMed.
  82. B. Enright and D. Fitzmaurice, J. Phys. Chem., 1996, 100, 1027–1035 CrossRef CAS.
  83. A. Stashans, S. Lunell and R. W. Grimes, J. Phys. Chem. Solids, 1996, 57, 1293–1301 CrossRef CAS.
  84. J. Chen, L.-B. Lin and F.-Q. Jing, J. Phys. Chem. Solids, 2001, 62, 1257–1262 CrossRef CAS.
  85. H. Zhang, M. Zhou, Q. Fu, B. Lei, W. Lin, H. Guo, M. Wu and Y. Lei, Nanotechnology, 2014, 25, 275603 CrossRef PubMed.
  86. M. M. Maitani, K. Tanaka, D. Mochizuki and Y. Wada, J. Phys. Chem. Lett., 2011, 2, 2655–2659 CrossRef CAS.
  87. Y. Zhou, C. Fuentes-Hernandez, J. Shim, J. Meyer, A. J. Giordano, H. Li, P. Winger, T. Papadopoulos, H. Cheun, J. Kim, M. Fenoll, A. Dindar, W. Haske, E. Najafabadi, T. M. Khan, H. Sojoudi, S. Barlow, S. Graham, J.-L. Brédas, S. R. Marder, A. Kahn and B. Kippelen, Science, 2012, 336, 327–332 CrossRef CAS PubMed.
  88. K. Nishimori, K. Tanaka and Y. Inoue, J. Appl. Phys., 1991, 69, 8042–8046 CrossRef CAS PubMed.
  89. T. Hanmin and L. Shoubin, Adv. Biomed. Eng., 2012, 8, 59–63 Search PubMed.

This journal is © The Royal Society of Chemistry 2015
Click here to see how this site uses Cookies. View our privacy policy here.