How I met your elastomers: from network topology to mechanical behaviours of conventional silicone materials

A. M. Stricherab, R. G. Rinaldib, C. Barrèsa, F. Ganachaud*a and L. Chazeau*b
aIMP@INSA-Lyon, CNRS UMR 5223, 17 avenue Jean Capelle, F-69621 Villeurbanne, France. E-mail: francois.ganachaud@insa-lyon.fr
bMATEIS, CNRS UMR 5510, 7 avenue Jean Capelle, F-69621 Villeurbanne, France. E-mail: Laurent.chazeau@insa-lyon.fr

Received 17th April 2015 , Accepted 27th May 2015

First published on 27th May 2015


Abstract

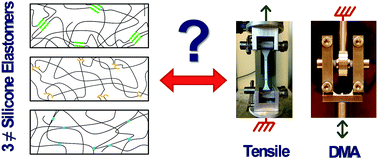
Silicone elastomers are available in different formulations that are mainly discriminated by their crosslinking mechanisms. Different chemical networks lead to diverse mechanical behaviours. This work aims at comparing three types of conventional silicone elastomers, one Liquid Silicone Rubber (LSR), one High Consistency Rubber (HCR) and one, thermoplastic, hydrogen bonded cross-linked elastomer (TPE). Each one is studied and compared in terms of network microstructure versus mechanical behaviour.

1 Introduction

Polysiloxanes are semi-inorganic polymers characterized by their repeating [–Si(CH3)2O–] backbone. They are at the basis of high performance rubbers which combine extremely low glass transition temperature, outstanding thermal stability, resistance to oxidation and to energetic beams (thanks to the stability of Si–C and Si–O links), good dielectric properties, biocompatibility and high hydrophobicity.1 Since unfilled cross-linked polydimethylsiloxane (PDMS) networks are inherently weak materials, fillers, or hard phases in a more general manner, are added to improve their mechanical properties.1,2 The mechanical reinforcement resulting from the addition of inorganic fillers has been widely investigated.3 It includes silica, which is most of the time modified via different surface treatments,4–6 zirconia, alumina7,8 and other layered fillers such as montmorillonite.4 Silica prevails because of its important reinforcing capability, which comes from the numerous interactions between silanol groups at silica's surface and the siloxane backbone.9,10 This filler–chain interaction is the main mechanism to increase the rubber mechanical properties.11,12 The bonding energy of hydrogen interaction between silanol and siloxane has been estimated by Hanson et al.13 at around 25 kcal mol−1, which is in the same order of magnitude as covalent bonds (e.g. Si–O is 110 kcal mol−1). Many other parameters govern the filler reinforcement of elastomer networks, such as the presence and microstructure of aggregates, the content of silanol groups at the surface, the percolation of the filler network14 and so on.

The cross-linking of silicone elastomer arises from different chemical reactions. Liquid Silicone Rubbers (LSR) are addition-cured through a “controlled” platinum-catalysed hydrosilylation reaction between a short crosslinker and longer telechelic chains,15,16 resulting in a regular network with very few dangling chains (Fig. 1a). High Consistency Rubber (HCR) silicone elastomers are constituted of very high molar mass PDMS-co-PVMS chains cured via free radicals obtained from a peroxide decomposition at hot temperature, which leads to a random network17,18 containing numerous dangling chains (Fig. 1b). Some other grades of silicone elastomer are cross-linked at room temperature (RTV2 for room temperature vulcanization in 2 parts) with the same addition cure scheme as LSRs, with longer curing time. Other formulations, not considered in this work, are: (i) UV-cured silicone elastomers,19 whose crosslinking mechanism limits their use to surface applications, such as coatings; (ii) polycondensation-based systems, i.e. RTV1, mostly used for sealants applications.


image file: c5ra06965c-f1.tif
Fig. 1 Comparison of the 3 silicone elastomers studied here: (a) main formulation components (b) origin of reinforcement, (c) crosslinking mechanisms, (d) figurative representation of the network (note: when present, silica particles are not represented).

Recently, progress in supramolecular chemistry allowed for the creation of thermoplastics silicone gels, based on the introduction of segments capable of creating hydrogen-bonding interactions and/or π–π stacking.20–32 The resulting materials are mostly described in the open literature as academic model networks, although Wacker Chemie AG managed to launch a thermoplastic silicone elastomer (TPE) commercially available under the trade name Geniomer©. This material is a filler-free linear copolymer constituted of soft PDMS segments (SS) and hard segments (HS) containing bis-urea groups which self-associate via hydrogen-bonding (Fig. 1c).

In terms of volume, HCR is the most used type of silicone elastomers, thanks to its price, ease of processing, stiff mechanical behaviour and availability. It also displays a wide temperature and frequency stability. Also, HCRs can be processed in several ways including extrusion for cables application for instance, while LSR is at this stage limited to molding. LSRs however possess strong arguments for being used in high performance applications. One primary advantage of LSR against HCR is the absence of molecular by-products that makes this class of material suitable for e.g. biomedical use (HCR usually needs a post-cure to eliminate peroxide residues). However, the platinum catalyst used in the LSR addition cure reaction consequently increases their price. TPE still has to earn its place in the sun, for instance in thin coatings where transparency is sought.

Although all these materials are graded as silicone elastomers, their crosslinking mechanisms, reinforcement method and ultimately their mechanical behaviours strongly differ. To our knowledge, there have hardly been any studies on the comparison of silicone elastomer grades. Some authors have confronted addition (LSR) and free radical (HCR) cured silicones in very specific fields, such as medical applications, but without trying to enlighten the origin of the differences between these elastomers.33 Numerous studies concern only one type of these materials, if not some “model” PDMS networks synthetized for the only need of fundamental mechanical studies.4,11,34,35 Besides, since thermoplastic silicone elastomers are quite new (less than 30 years), their properties have not been extensively compared to “regular” ones in the bibliography.

This work aims at evaluating the three main types of elastomer silicones, namely, LSR, HCR and thermoplastic silicone elastomers (abbreviated TPE), all of similar shore A hardness, which is the main parameter used in the industry to classify mechanical performance. First, a literature survey of mechanical behaviours typically expected from silicone elastomers is presented. Then, each material formulation is rapidly described to enlighten the network and filler differences. Mechanical tests help to correlate materials structures to their mechanical behaviours, in order to determine which parameters are predominant. A final, short discussion summarizes the properties of each formulation in regards to one another.

2 Literature survey of typical mechanical behaviours of silicone elastomers

Mechanical behaviours of silicone elastomers can be related to their structure, tentatively described by three main features: (i) the chemical network, characterized by the average molar mass between crosslinks, its distribution, the presence of dangling chains, chains loops or chains entanglements, (ii) the filler, its mass and volumetric ratio, size and distribution, surface functionality and finally (iii) the different interactions between them: chain–filler, chain–chain, filler–filler. Note that these three characteristics of the material do not apply to the silica-free thermoplastic elastomer since the network is made of crosslinking points reversible with temperature. In this last case, important parameters are: (i) the type and volume fraction of hard and soft segments, (ii) the intermolecular bonding, which affects the global morphology of the polymer, and finally (iii) the size of the two types of segments and their distribution.

2.1 Behaviour of thermoplastic silicone elastomer: silicone-urea copolymers

Yilgör and et al.36 reviewed the articles dealing with silicone-urea copolymers in the literature, from their synthesis to their mechanical properties as elastomers, and potential applications. Pioneers in the synthesis and characterization of segmented silicone-urea copolymers used as elastomers, Tyagi et al. managed to obtain, in 1984, materials whose tensile behaviour could already be qualified as elastomeric, but with high viscoelasticity (strong permanent set, and hysteresis).26,27

Hydrogen bonding between PDMS chains is practically inexistent because of methyl shielding, and it is still weak between siloxane and urea.28 On the opposite, urea–urea interactions are much stronger, enabling the formation of a structured morphology with phase separation and hard, H-bonded domains.25,28 Note that in the case of a similar copolymer where the soft segments were replaced by polyether, which strongly interacts with urea, the obtained materials showed much weaker strength at room temperature.37 It was also demonstrated that in the case of silicone-urea copolymers, the tensile strength is directly proportional to the HS content, at constant SS size.38

For any given polymer chain, the critical molecular weight is defined as the mass above which a mechanically active physical entanglement network appears. For PDMS this molar mass is estimated1 at Mcrit = 25[thin space (1/6-em)]000 g mol−1. For soft segments with larger molar masses, entanglements play a substantial role not only in the ultimate tensile strength, but also in the elastic properties. At similar SS/HS ratio, a Si-urea copolymer where the siloxane segments are above Mcrit will exhibit smaller residual deformation and reduced hysteresis after loading than one whose SS are below Mcrit.32 Also, its elongation at break and ultimate tensile strength will be increased.31

As for the thermo-mechanical properties, as soon as the PDMS soft segments exhibit an average molar mass above 3000 g mol−1, they crystallize below −70 °C, and melt above −40 °C.27 Hydrogen bonds are known to be reversible even at room temperature, breaking and recombining within experimental time scales.39 This time scale is affected by temperature, hence it is predictable that silicone-urea behaviour should strongly depend on this latter parameter. Indeed, comparing the storage and loss moduli versus temperature profiles of several PDMS-urea formulations clearly indicates that above 40 °C, the elastic modulus decreases drastically, while the damping factor increases regularly, indicating the loss of the elastic behaviour.27,29,31 Note finally that the use of such silicone thermoplastic elastomers is still much less widespread than the covalently cross-linked ones, even though their use has been investigated for anti-fouling purposes,40 as well as for bio-implantable devices.

2.2 Behaviour of peroxide and platinum cured silicone elastomers

Despite different cross-linking mechanisms, peroxide and platinum-cured silicones are both reinforced with an inorganic filler, silica. For any type of filler in an elastomeric matrix the first mechanism involved in reinforcement is hydrodynamic, i.e. the introduction of rigid particles creates obstacles to the materials flow,11 whatever the polymer–filler and filler–filler interactions. As mentioned before, the second and main type of reinforcement mechanism is related to silica, which creates strong bonds with the silicone chains, thus introducing polymer–filler and filler–filler interactions.41

The adsorption of PDMS on the randomly dispersed silica particles surface widens the length distribution of free polymer chains among the material.42 Other consequences described by several authors are an apparent increase of the effective filler loading,43 an increased amount of entanglements14 or crosslinking density.44 These mechanisms are controlled by: (i) the filler loading,45 whether or not percolation is attained,46 (ii) the filler specific area,47 (iii) the potential aggregation of the filler particles,48 and (iv) the filler surface chemistry. Changes in this chemistry impact the type of filler–filler and polymer–filler interaction (mainly hydrogen bonding49 and covalent bonds50), and indirectly the filler structuration during the material processing.2 As a result, the addition of silica in PDMS networks leads to an increase of the stress magnitude, the modulus, and even the elongation (up to a certain level).45

Usually three stages are observed when testing filled elastomers in tension (see Fig. 2a): a first one where the modulus drops off, a second one with a constant modulus region, and a third one, corresponding to a modulus increase. At small strain, the modulus drop-off was described by Payne.51 In this theory, the material is described as a percolated filler network in a polymer matrix that would break off under stretching. This scenario was later enriched considering both filler–filler and filler–matrix interactions so that the filler network would include glassy elastomer adsorbed near the filler surface.52,53 In this model, aggregates entrap some polymer chains, leading to so-called “occluded rubber clusters”, which behave mechanically as a unique filler particle and artificially increase the filler content. Upon increasing deformation, the breakage of such mixed polymer–filler networks and clusters would explain the drop-off of the modulus. A scheme of this phenomenon in cyclic strain sweep is shown on Fig. 2b. When performing such strain sweeps, ideal sample geometry is one that produces a perfectly uniform strain field throughout the sample, as observed in true shear solicitation.


image file: c5ra06965c-f2.tif
Fig. 2 (a) Typical tensile behaviour of filled elastomer. (b) Typical behaviour of filled elastomer undergoing cyclic strain sweep and showing a Payne effect. (c) Model representation of the mechanical behaviour of rubbers undergoing Mullins' softening.

Indeed, non-linear behaviour coupled with non-uniform strain (such as those obtained in tensile measurements for instance) would be impossible to deconvolute, and one could mask the other. Chazeau et al.54 studied in details the so-called Payne effect and found out that the strain dependence of the modulus was closely related to the material thermo-mechanical history. The Payne effect is also independent of an applied constant strain as far as it is not too large, and a sufficient time is waited after the application of this strain. It was also demonstrated that the modulus loss which occurs as a result of the strain perturbation is fully recoverable with time, even if some Mullins effect is also involved.54

Such phenomenon has been largely studied in literature, especially in the moderate strain domain, and was first reported by Mullins.55 Basically, stress softening invariably occurs in filled, and even some unfilled elastomers when comparing the stress–strain curves of two consecutive identical loading cycles of a pristine material (Fig. 2c). Multiple theories tried to explain this behaviour including bond ruptures,56,57 chain slipping along filler particles,58 filler aggregates and cluster rupture,51 chain disentanglement45 and network rearrangement.59,60 Other studies specific to PDMS elastomers by Fitzgerald et al.61 suggested that the break of load-bearing chains creates ionic fragments capable to react with moisture to create silanol chain ends that reduce the effective crosslink density, thus the overall modulus. None of the above theories are unanimously accepted, however it is likely that a combination of those would explain this phenomenon, and that some explanation could be elastomer-dependent. It is often reported that the Mullins effect is partially reversible with time57 and temperature.55,57 However, such observations are often questionable as they are based on cyclic tensile tests where the Payne effect is also involved. To avoid any confusion between Payne and Mullins effects in the following, we will adopt the definition proposed in ref. 54, i.e. the Mullins effect will be considered as the irreversible modification of the material behaviour. Recently, Hanson et al.62 reported the absence of this stress-softening in cross-linked silica-filled PDMS when the second strain axis is perpendicular to the initial one, which poses a challenge for existing models, even though partial axis dependency was already known.55 Numerous papers are trying to propose new constitutive models accounting for these phenomena.62–66

The influence of the network topology on the behaviour at large strains has mostly been investigated for unfilled model networks.67–72 It has been shown that to get better elongation and ultimate strength, multi-modal networks were superior to unimodal ones. They usually absorb greater energy before failure, and can display a distinct upturn in stress at high strains (so called strain hardening). This effect is often attributed to an increased loading of short chains as they approach their limited extensibility, while longer chains maintain the overall integrity of the networks.68

The influence of dangling chains was also investigated by Andrady et al. who found that even if their presence did not affect the elongation modulus, they were detrimental to the elongation at break and ultimate tensile strength.69–71

The role of the reinforcing filler in PDMS at high strains is also critical: when unfilled, PDMS is subjected to tear and cannot withstand high elongation or strain. Fillers may increase the uniformity of force among network chains, thus reducing early fracture of overextended chains.73 Such mechanism might involve decohesion and cavitation which are generally reported in strained filled elastomers.74 In addition to intrinsic polymer chains properties, toughness is believed to arise from viscous dissipation, strain-induced crystallization (not in the case of PDMS since TmeltTamb), and deviation of the tear path in reinforced materials.73,75 About the latter, the tear propagation changes from regular and steady in unfilled PDMS, to unstable (or stick-slip tearing) in filled PDMS.76,77

In the following, the three classes of elastomers are first presented in terms of structure versus main properties. Then, their mechanical behaviours are compared and interpreted according to classical elastomer theories.

3 Materials and methods

3.1 Elastomer processing

200 × 200 × 2 mm3 sheets of the three silicones were manufactured. Liquid silicone rubber was transformed by first mixing two equivalent parts of A and B for about 5 minutes, one containing the platinum catalyst, the other containing the curing agent, and then curing for 15 minutes at 180 °C under a 200 bars press. High Consistency rubber was cured with 0.8 phr of a peroxide curing agent called Trigonox 101, which was incorporated using a two roll mill at room temperature for about 15 min. Curing was carried out for 15 minutes at 180 °C under a 200 bar press. The TPE was molded under a manual 5 bar press for 10 minutes at 200 °C. H2 (standard, dog bone shape of L0 = 25 mm, e = 2 mm, w = 4 mm) and H3 (L0 = 17 mm, e = 2 mm, w = 4 mm) (ISO 37:2011) samples were punched from these sheets, and left to rest for around one week before mechanical testing.

3.2 Mechanical testing

Frequency and temperature sweeps were performed using tensile geometry on a Dynamic Mechanical Analysis (DMA) apparatus (GABO Eplexor) on H3 samples. After a single elongation up to 100% nominal strain, samples were left at rest for 4 hours to ensure recovery of viscoelastic properties. Tests were then carried on with a 0.4% strain offset and ±0.25% sinusoidal strain amplitude at 1 Hz, for temperatures ranging from −50 °C to 200 °C.

To study the Payne effect, DMA strain sweeps were performed at room temperature using a double shear sandwich geometry assuring simple shear stress on two cylinders of Φ = 6 mm and 2 mm thick (see the right-hand photo on the TOC figure). The plotted data are those obtained with the last strain sweep of three consecutive ones from 0.1 to 20% strain; each strain sweeps was performed after 30 min rest, to ensure that the modulus drop is not due to an irreversible damage of the material, i.e. within our definition, to the Mullins effect.

The tensile tests up to failure were performed on an MTS 2/m machine with a 100 N load cell on H2 samples at different crosshead speeds, 50, 80 or 500 mm min−1. Video-extensometry was used to study the strain recovery of H2 samples submitted to a load-unload cycle up to 200% nominal strain at 15 mm min−1. During unload, once the zero force is reached, the remaining strain was set to be the initial residual strain after a 200% strain. Samples were immediately freed from the bottom tensile clamp and the distance between the two dots drawn on the surface of the specimen was measured as a function of time, and ultimately converted into axial strain. Data of these tests are plotted in nominal strain and stress.

3.3 Characterizations methods

Thermogravimetric analyses (TGA) were performed on a Q500 equipment from TA Instrument. Around 20 mg of samples were heated in a platinum pan at 50°C min−1 from room temperature to 900 °C, under a nitrogen flow of 50 mL min−1.

Size exclusion chromatography (SEC) in toluene was carried out using a Malvern Viscotek GPC Max apparatus equipped with three Shodex columns (KF-804, 805, and 806) set at 35 °C. Detection systems were a refractive index and a differential viscometry detectors. Toluene (HPLC grade, provided by Sigma Aldrich) was eluted at 1 mL min−1. Components were dissolved in toluene at an approximate concentration of 3 mg mL−1, then filtered down to 0.45 μm pores to separate polymer chains from the filler. Molar masses were measured using an universal calibration from polystyrene standards.

The chemical structure of the uncrosslinked products was characterized by 1H (128 scans, D1 = 2 s) and 29Si (4096 scans, D1 = 5 s) nuclear magnetic resonance (NMR) measurements on a Bruker AC 400 MHz spectrometer in CDCl3 solutions. For 1H experiments, no TMS was added in order to get quantitative signals and the calibration was made using the deuterated solvent displacement. For 29Si NMR chromium(III) acetylacetonate was added to decrease relaxation time and get quantitative signals.

Differential scanning calorimetry (DSC) was conducted on a TA Q20 apparatus with 2 successive temperature sweeps from −150 °C to 200 °C at 20 °C min−1 back and forth, to erase the thermal history of the materials. Temperature was regulated thanks to a helium gaseous flow of 25 mL min−1. The crystallinity ratio α was deduced from the area under the melting peaks of the Cp = f(T) plot of the second sweep using the following equation:

 
image file: c5ra06965c-t1.tif(1)
where ΔH0melt(100%) = 60.8 J g−1 is taken from the work of Lebedev et al.78 and represents the melting enthalpy of a pure crystalline phase.

Extraction and swelling measurements were performed on crosslinked materials to estimate the average molar mass between crosslinks (Mc) via the Flory–Rehner equation.80 When immerged in a good solvent, elastomer samples tend to swell more or less depending on their crosslink density. Such crosslinks encompass the chemical links between PDMS chains and the physical interactions between the PDMS chains and the filler network. Cylindrical samples of initial dry weight Wi, were plunged into 100 mL of methyl cyclohexane in a sealed bottle. After 5 days the sample was extracted, gently wiped on each side to remove liquid solvent at the sample surface and immediately weighted to measure the equilibrium swollen weight Ws. Samples were then dried overnight at 70 °C under vacuum and reweighted (Wf). The extractable material and polymer volume fractions in the swollen sample, respectively E and V, were calculated as follows:

 
image file: c5ra06965c-t2.tif(2)
 
image file: c5ra06965c-t3.tif(3)
where c represents the silica weight fraction, ρs and ρp the density of the solvent and polymer respectively. From this volume fraction it is possible to estimate Mc via the Flory–Rehner equation:80
 
image file: c5ra06965c-t4.tif(4)
with Ms the molar mass of solvent, and χ the Flory–Huggins interaction parameter which in case of PDMS-methylcyclohexane equals 0.45.9

In the case of silica-filled PDMS, chain/filler interaction cannot be suppressed by solvent alone, which means that Mc calculated with this procedure accounts for both covalent bonds and filler–matrix weak bonds. It will be called Msc. Suppressing these weak bonds is possible through swelling in a good solvent in presence of ammonia-saturated atmosphere, which allows estimating the average molar mass between covalent crosslinks exclusively, Mac. One can estimate the amount of filler–matrix bonds by comparing Mac to Msc.

In order to simulate the first load tensile behaviour of elastomers, the Mooney–Rivlin model is widely applied for its simplicity and fair accuracy for nominal strain up to 300%. In its most general form, the model links the Cauchy stress tensor to the first two invariants of the Green–Lagrange strain tensor, through two constants (fitting parameters) C1 and C2. Assuming uniaxial tensile loading, the equation simplifies to:81

 
image file: c5ra06965c-t5.tif(5)
where σ is the axial nominal stress, λ is the elongation (ratio between the deformed length l, and initial length l0). Mc was therefore also calculated from tensile test measurements, via the Mooney–Rivlin equation. By plotting the reduced tensile stress σ/(λ − 1/λ2) versus the inverse strain λ−1, a straight line is obtained, whose intercept with the reduced stress axis is equal to 2C1. This parameter is proportional to the crosslink density according to the classical rubber theory:82
 
image file: c5ra06965c-t6.tif(6)
with ρ the polymer density, R the ideal gas constant and T the temperature. However, at high strains, the modulus must take into account the filler hydrodynamic reinforcement whose contribution was proposed by Guth and Gold as such:83
 
E = Em(1 + 2.5ϕ + 14.1ϕ2) (7)
with E the modulus of the filled polymer, Em the modulus of the unfilled matrix, and Φ the volume fraction of the filler.

4 Results and discussion

4.1 Elastomer formulations and main properties

4.1.1 Suppliers' information. Table 1 summarizes data given by the providers. Aside from the crosslinking mechanism, one formulation differs from one another through the catalysts it contains. TPE does not need any catalyst, for hydrogen bonding and phase separation favour physical crosslinking, whereas both LSR and HCR vulcanize catalytically using platinum and peroxide, respectively. In LSR, only a small amount of platinum is used (typically from 5 to 20 ppm) and deactivated during curing, turning into inert colloidal platinum.79,84 In HCR, peroxides are used in greater amount (0.5 to 1% in weight) and are known to be harmful, preventing their use for bioapplications.85 The specific gravity differs between TPE and HCR or LSR mostly because of the absence of inorganic filler in TPE, silica having a larger density (∼2.2 g cm−3) than PDMS (∼0.97 g cm−3).
Table 1 Some data on materials from suppliers' information
  LSR HCR TPE
(a) Networks characteristics
Crosslinking system Covalent Covalent Supra-molecular
Catalysis system Platinum Peroxide
Density [g cm−3] 1.1 1.2 0.99
Type of reinforcement Vinyl-modified silica Methyl-modified silica Bis-urea segments
 
(b) Material properties
Shore A hardness 30 30 30
Compression set [%] 15 (at 175 °C) 40 (at 180 °C) 75 (at 23 °C)
Tensile strength [MPa] 8 8 4–6
Elongation at break [%] ≥700 ≥500 ≥400


Compression set (CS) data are reported in Table 1. This parameter is often used in the industry as an indication of the elasticity of the elastomers. Since formulations differ from one to another, the temperatures at which the tests have been performed are indicated between brackets. The compression set value for TPE is more than 2 times larger than for other silicones even at a lower temperature, due to the reversible nature of the crosslinking, which makes the material creep. HCR exhibits subsequent residual strain as well, but at higher temperature. This result could be explained by the presence of long dangling chains in the material, whose relaxation is slow, as investigated by Curro et al.86–88 and other teams.89,90 LSR exhibits the smallest CS amongst the three silicones, certainly because of the absence of dangling chains in its network, and a lower Mullins effect (see below).

4.1.2 Network characterizations. Table 2 summarizes results from complementary analyses done in our laboratory, namely SEC, DSC and swelling measurements. As expected, the initial Mn or number average molar mass of the main constituent is far greater for HCR than for the two others. This makes it a solid, gum-like material when un-crosslinked, whereas LSR is a highly viscous liquid. TPE is always rubbery at ambient temperature, thanks to the existing interactions between its chains that do not require chemical crosslinking. All formulations have molar masses large enough to favour entanglements effectively contributing to the mechanical properties.
Table 2 Comparison of typical parameters of the three materials gathered in this work
  LSR HCR TPE
a Determined by SEC.b Determined by TGA for LSR and HCR and 1H NMR for TPE.c Determined by 1H and 29Si NMR.d Determined by swelling measurements in methylcyclohexane.e Determined by TGA.f Determined by DSC (peak temperatures).g Determined by tensile test at a strain rate of 0.05 s−1.h Determined by tensile DMA.i Determined by double shear sandwich DMA.
(a) Network characteristics
Mn of main constituenta [kg mol−1] 45 230 68
Đa 2.1 1.9 2.6
Weight ratio of fillers (LSR, HCR) or hard segments (TPE)b 30 33 16
Evaluated Mcc [kg mol−1] 45 2.2
Chemical + physical Msc d [kg mol−1] 45 7.4 32
Only chemical Mac d [kg mol−1] 50.5 10.8
Percentage of physical crosslinksd 11 33 100
Extractable contentd [%] 8 3 10
Residue at 900 °Ce 68 33 0
 
(b) Material properties
Tgf [°C] −123 −122 −123
Tcf [°C] −80 −78
Tff [°C] −45 −58
Crystallinityf [%] 36 22 0
Shore A hardness 31 ± 1 38 ± 1 35 ± 3
Tensile modulusg [MPa] 1.0 ± 0.1 3.8 ± 0.1 1.3 ± 0.2
Tensile storage modulush [MPa] 2.1 8.8 3.4
Shear modulusi [MPa] 0.8 1.9 1.1
Modulus at 100% straing [MPa] 0.38 ± 0.03 1.51 ± 0.08 0.3 ± 0.1
Elongation at breakg [%] 1300 ± 100 550 ± 120 600 ± 200
C1g (Mooney–Rivlin) 0.11 0.52 0.12
C2g (Mooney–Rivlin) 0.03 0.07 0.14
Mc tensileg [kg mol−1] 31 7.5 30


The average molar mass between crosslinks (Mc) is one of the main parameter driving the elastomer mechanical properties (due to entropic elasticity), and differs greatly from a system to another. For TPE, the evaluated Mc is calculated as the average molar mass between hard segments, which was determined to be of about 30 –Si(CH3)2O– units by 1H NMR. For the LSR formulation it corresponds theoretically to the average length of the main constituent, considering the crosslinker units as simple nodes. The Mc and percentage of extractable material were determined by swelling measurements in methylcyclohexane, as described in part 3.3. It is worth mentioning that this determination procedure is questionable for TPE, since the reversible nature of the H-bonds is enhanced in the swollen state. Nevertheless, the results are presented in order to provide comparison with the other two materials. The amount of extractable material is higher for LSR than for HCR, which is due to the presence of low molecular weight oils added to give the material a greasy touch and therefore facilitate unmolding. For TPE, the extractable fraction is even higher, and it could mean that after an extended period of time, TPE would dissolve completely due to the reversible nature of the crosslinks. Indeed, when the swelling of TPE is performed in presence of ammonia fumes, the sample dissolves completely and when dried, it takes the shape of the containing flask with a dramatic collapse of all the mechanical properties.

On the other hand, Mc for HCR is found smaller than for LSR, indicating a higher crosslink density. The nature of the crosslinks is also different: HCR seems to contain more physical crosslinks than LSR, suggesting that the filler surface in LSR is highly treated to reduce physical interactions with the matrix.93

Typical transition temperatures measured with DSC (Fig. 3 and Table 2b) show no differences from one formulation to another. It indicates that the introduction of fillers with strong interaction with the polymer does not change the glass transition temperature, a result that could be added for the ongoing debate on the possible modification of the matrix glass transition by the filler presence.81 The TPE is the only one not being able to crystallize, because of the short length of its soft segments (below 5000 g mol−1). The crystalline fraction in LSR and HCR explains the smaller signature of their glass transition on the DSC curve. The difference of crystallinity between these two materials is believed to be due to the bigger proportion of both covalent crosslinks, and physical chain–filler interactions in HCR (as seen by comparing Msc and Mac for both elastomers, see Table 2a). Indeed, the literature indicates that PDMS chains are unable to crystallize when they are adsorbed or close to the filler (up to typically 8 to 10 D units).6,67,92 The smaller crystalline fraction for HCR compared to LSR is confirmed by the shape of the crystallization and melting curves (Fig. 3a and b) which show wider peaks for HCR, indicating the presence of more crosslinking heterogeneities (wider Mc distribution, dangling chains) than for LSR.


image file: c5ra06965c-f3.tif
Fig. 3 (a) Offset DSC trace of the second cooling ramp from 200 °C to −150 °C, zoomed on the −50 °C to −150 °C region, and (b) offset DSC traces of the second heating ramp from −150 °C to 200 °C, zoomed on the −150 to 150 °C region.

The residues at 900 °C measured by TGA are very different for the 3 materials (Table 2 and Fig. S1a). For HCR, the amount of residue is directly equal to the weight ratio of silica filler. Silica is not modified with temperature, while PDMS is depolymerized into small and volatile cyclic structures.6 For TPE, which does not contain any inorganic filler, the complete material is degraded at 700 °C. For LSR, the residue is twice the weight ratio of filler. This increase is caused by the filler–matrix crosslinking at 400 °C thanks to the platinum catalyst, promoting ceramisation and thus an increase of the final weight of residue.94 Besides, analysing separate parts A and B by TGA confirms this analysis: (i) the part containing the crosslinker gives the expected residue (30 wt%); (ii) the part containing the platinum gives a very high residue (66%) (Fig. S1b), indicating the presence of vinylated silica in the material.94 Differences in thermal properties are even more pronounced when looking at fire resistance (see ESI).

4.2 Mechanical behaviours

4.2.1 Frequency sweeps. The results of the frequency sweep tests at 25 °C are given in Fig. S2. Both LSR and HCR display little dependence of their storage modulus versus frequency, as expected for materials exhibiting an entropic hyper-elasticity. Whereas, the TPE elastic modulus is seen to increase regularly with increasing applied frequency. One explanation could be that at a higher frequency, H-bonds do not have the time to break and reform so the overall network is more elastic.
4.2.2 Temperature sweeps. Fig. 4 and Table 2b compares the dynamical mechanical behaviour of the three materials as a function of the temperature. HCR and LSR have similar, gradual storage modulus decrease from low temperatures up to 25 °C, at which it remains almost stable. The measurements were performed in a temperature domain where the materials cannot crystallize (see Fig. 3); therefore the modulus drop cannot be assigned to a melting process. Besides, the modulus decrease is more pronounced for HCR than for LSR. The former material is globally more crosslinked and contains more filler–polymer physical crosslinks. Thus, it seems reasonable to assign the modulus drop to the mechanical relaxation of the chains in the vicinity of the filler. Heinrich et al.95 reported that such relaxation observed in Styrene Butadiene Rubbers (SBR) materials involves the release of the strong topological constraints created by the physical crosslinks. They showed that the storage modulus of highly filled rubbers exhibits an Arrhenius-like decrease upon temperature increase above the glass–rubber transition, followed by an increase at higher temperatures (around 150 °C above Tg in their study), when the temperature behaviour of the filled rubber sample gets more and more influenced by the entropic elastic behaviour of the polymer network. This Arrhenius-like behaviour is likely seen for HCR and LSR (Fig. S3). This suggests that the filler–polymer interactions for both materials prevail over the entropic elastic behaviour of the matrix in this temperature range. Another possible explanation would be the relaxation of free chain arms that may exist in an elastomer in which the crosslinking process is random along the initially long Si–Vi PDMS chains (as suggested by the crystallization behaviour). Besides, loss moduli decrease with temperature, meaning that both materials tend to dissipate less energy at high temperature.
image file: c5ra06965c-f4.tif
Fig. 4 (a) Elastic modulus (plain lines) and loss modulus (dashed lines) obtained from tensile DMA versus temperature (b) damping factor versus temperature.
4.2.3 Strain sweeps. Strain sweeps performed at ambient temperature helps enlightening the aforementioned Payne effect. From Fig. 5 it is clear that the strongest Payne effect occurs in the HCR, whose modulus is divided by 2 between 0.1% and 10% strain. This effect is also clearly displayed by a wide peak of the damping factor at around 3% of strain. The exact same behaviour is obtained for the LSR, but less pronounced, as a result of the less reinforcing filler network at low strain. This weaker modulus of the filler network can be explained by: (i) a better distribution of the filler network within the PDMS matrix promoted by the large amount of covering agents on the silica surfaces7 (as previously revealed by the TGA curves), which decreases the filler–filler interaction, and (ii) the smaller amount of physical bonds between the filler and the polymer matrix (as evidenced by the swelling measurements).
image file: c5ra06965c-f5.tif
Fig. 5 (a) Storage shear moduli (plain lines), loss shear moduli (dashed lines) against dynamic strain amplitude obtained by double-shear DMA measurements. (b) Damping factor versus strain amplitude in double shear DMA measurements.

The larger Payne effect observed in HCR is due to the reduction of filler–matrix–filler interaction by the strain-induced decrease of the topological constraints resulting from the polymer–filler physical bonds (vide supra). The difference between HCR and LSR lies in (i) the absence of permanent chemical crosslinks that does not limit the decrease of these topological constraints, (ii) a less reinforcing filler structure, and therefore domains of high stress concentration at the level of the filler–matrix–filler junction, that make the modulus decreasing more progressively. For TPE, the Payne effect is not present even though at high strain, the modulus appears to diminish a little, and the damping factor to increase. Indeed, in a mechanism quite similar to the one previously described, the strain leads to a temporary reduction (within the experimental time) of the physical bonds in the material, reducing the topological constraints in the polymer chains.

4.2.4 Tensile behaviour up to failure. Tensile tests up to failure at different strain rates confirm the strong differences existing in the mechanical behaviours of the three elastomers (Fig. 6a and Table 2b). The tensile modulus, taken as the slope at the origin of the strain–stress curve, is quite different from the one measured by DMA. This difference enlightens the difficulty of measuring a tensile modulus for elastomeric materials from uniaxial tension tests, because their stress–strain behaviour is highly non-linear. Comparing moduli obtained in shear and tensile DMA is more accurate, provided one avoids the non-linear effects (Payne, Mullins). Indeed, the following relationship:
 
E′ ≈ 3G (8)
with E′ the storage modulus in tension and G′ in shear applies to these incompressible silicone materials, as verified by comparing Fig. 4 and 5 (see also Table 2b for values).

image file: c5ra06965c-f6.tif
Fig. 6 (a) Nominal stress–strain behaviour in uniaxial tension for TPE, HCR and LSR. Each line type represents a different strain rate. (b) Mooney–Rivlin modelling of the tensile response of the three elastomers at 0.1 s−1.

LSR and HCR both show the typical behaviour of an elastomer,91 often described as hyper-elastic materials, with almost no strain rate dependence nor residual strain (Fig. 6a). HCR has the lowest elongation at break and the highest tensile strength up to failure, with no significant strain hardening. LSR displays an elongation at break of more than 1300%, i.e. twice the one measured for HCR, and similar to some natural rubbers. It also shows some strain hardening above 200% strain, which could arise from the limit of extensibility of polymer chains, or from a reorganization of the filler network.97 TPE is not very different from LSR at 100% strain, except that the stress level is lower. An increase of strain rate increases the stress level while decreasing the elongation at break, consistent with the increase of elastic modulus seen in frequency sweep tests (Fig. S2). Elongation at break drops at high strain rate, going from 1200% to less than 600%. This way of reinforcing PDMS rubber is thus mechanically not as effective as the addition of silica. Note that both methods however improve drastically the mechanical properties of silicone rubber when compared to unreinforced samples, where the strain at break hardly exceeds 100%, while stress levels at below 0.1 MPa.34 This enhancement arises either from filler–filler and chain–filler interactions (in the case of LSR and HCR), or phase separation between hard segments and soft segments in TPE. It also comes from the limitation of tear growth through a complex mechanism involving the amplification of the chain strain near the crack tips by the fillers or hard segments,98 and a mechanism of cavitation96,98,99/decohesion.100

Fig. 6b shows the tensile behaviour and the associated Mooney–Rivlin fit for the three elastomers. The C1 and C2 constants calculated for each elastomer are displayed in Table 2b. The M–R description is consistent above ε > 100%, but is unable to correctly model the behaviour in the Payne effect domain, which has already been reported in the literature.81 The Msc determined by tensile measurements (derived from the C1 constant of the Mooney–Rivlin model) are in the same range as those measured by swelling (Table 2) and consistent with the nature of the elastomers. Still, Mc calculations are both based on strong hypothesis regarding the matrix and the filler network and should always be considered as relative values.

4.2.5 Behaviour in cyclic tension. The 50% and 200% strain cyclic tensile behaviour of the different elastomers is displayed in Fig. 7a–c with a larger strain at zero stress for HCR. Conversely to the two other materials, the strain at zero stress does not stabilize after 10 cycles for TPE, but increases with increasing cycle number, because of the reversible bonds, which tend to reform when the material is elongated. The hysteresis displayed by TPE is the largest while LSR is the most hyperplastic material, as shown by its small hysteresis. For HCR and LSR the cyclic strain–stress curve is stable after one cycle.
image file: c5ra06965c-f7.tif
Fig. 7 Multi-cycles tests for (a) LSR, (b) HCR and (c) TPE. a1, b1 and c1 represent 10 consecutive cycles in tension to εN = 50% (the n + 1th loading occurs when zero force is reached during the nth unloading). a2, b2, and c2 represent tensile tests to εN = 200% with a return at σN = 0 MPa with either a direct reload (darker lines) or a reload delayed by a 1 week resting period (lighter lines).
4.2.6 Strain recovery. The residual strain recovery versus time after enduring a 200% stretch step is displayed in Fig. 8. For LSR, the recovery is complete in a matter of few seconds. For HCR, the recovery is fast just after the release, but it takes hours for the material to reach a completely stable state.
image file: c5ra06965c-f8.tif
Fig. 8 Strain recovery (at zero stress) versus time after 200% nominal strain loading step.

As mentioned for the analysis of the compression set data, the delayed strain recovery of HCR might be due to the slow relaxation of long dangling chains.86–90 The material also exhibits consequent residual strain (3.7%). Likely, breakage of the filler network occurs and prevents the material from fully recovering. For TPE, the initial residual strain is about 40%, much greater than for the two others. Nevertheless, the material slowly relaxes over an extended period of time, finally showing almost no residual strain after a week at rest. This is related to the complex materials dynamics which involves the PDMS chains relaxation and the urea bonding reversibility. The material eventually recovers its initial state at ambient temperature.

4.2.7 Mullins effect. Fig. 7a2–c2 lighter curves represent the stress–strain behaviour of the 3 material after a stretch to 200% and a reload after one week at rest. For TPE the initial slopes of the loading curves for the first and second stretch (after one week at rest) are basically the same. Except for residual strain, TPE is indeed not subjected to stress softening, because of the absence of filler, and reversibility of crosslinking mechanism. For HCR (Fig. 7b2) the softening is pronounced: at a given strain, the stress is divided by a factor of 2, and the strain–stress path roughly follows the shape of the direct reloading curve, at a slightly higher stress. Hence, part of the softening is reversible, and is a signature of the Payne effect. All in all the strongest Mullins effect displayed by HCR is due to the predominant influence of the filler network, which on the one hand gives it outstanding mechanical properties, but makes it more subject to irreversible damage. LSR (Fig. 7b3) exhibits the softest Mullins effect, with a loss of mechanical properties of around 10%. About 3% of the softening is recoverable, as shown by the comparison between the darker and lighter curves. As previously discussed, this effect can be related to the low compression set. This irreversible reorganization is facilitated in HCR, whose crosslink density is more spread out than LSR, and whose network comprises dangling chains.

5 Conclusions

The comparison of the materials properties of three conventional silicone elastomers illustrates fundamental differences in the formulation and network topology of cured materials. Since unfilled PDMS is an inherently weak material, one key parameter is the type of reinforcement, which controls most of the mechanical and environmental behaviours. If silica is the most often used filler, because of its great availability and specific interactions with PDMS chains, thermoplastic elastomer proved to become a serious competitor in specific fields where transparency, ease of re-processing, and low environmental impact are needed. Also, the absence of actual chemical crosslinking reaction makes it a totally pure and biocompatible material.101 On the other hand, the mechanical properties of TPEs are not as strong as those of the covalently bonded elastomers. They lack some primary properties that are usually targeted when working with silicone elastomers, especially thermal stability and hyperelasticity. Due to the thermal reversibility of their crosslinking mechanism, they tend to flow when mechanically solicited, and are usually stickier than the other formulations.

Among chemically crosslinked silicones, important differences exist, as seen when comparing HCR to LSR. If their filler loading and matrix chains are similar, the crosslinking mechanism, coupled with filler surface treatment and the way it is incorporated in the polymer are primordial. Random crosslinking of the network, as seen in HCR, induces a wider distribution of the molar mass between crosslinks and the presence of dangling chains, which all contribute to the viscous characteristics of the material behaviour. On the contrary, the fine control allowed by the polyaddition crosslinking mechanism of LSR produces a more regular network, with great elasticity. HCR mechanical behaviours suggests it comprises a more aggregated filler network than LSR, which results in a stiffer material, usually at the expense of permanent residual strain after loading. In this case, silica is voluntarily left with numerous surface silanol moieties to improve filler–filler interactions. On the contrary, in LSR, the in situ modification of silica reduces the physical filler–matrix interactions, and enhances the chemical ones, allowing a fine filler distribution within the network. This distribution is detrimental to stiffness, but brings an almost hyperelastic behaviour to the material.

As a final note, we described here the behaviour of conventional, commercial silicone materials purposely chosen to display important differences. Studying such complex formulations is tricky but depicts elastomer behaviours used in real life. There is still some work to achieve, the world of silicones being (fortunately) much wider and complicated. For instance, some HCR grades crosslinked by poly-addition or LSR formulations combining a dual radical and addition curing, are available on the market. The next step in our laboratory will be to study the behaviour of RTV 1 and RTV 2 elastomers.

Acknowledgements

This work was supported by the ANR under the project SAMBA (ANR-12-BS09-0008). Many thanks to David Mariot and Jean-Pierre Pascault for helpful discussions.

References

  1. S. J. Clarson and J. A. Semlyen, Siloxane polymers, Prentice Hall Englewood, Cliffs, NJ, 1993 Search PubMed.
  2. K. E. Polmanteer and C. W. Lentz, Rubber Chem. Technol., 1975, 48, 795–809 CrossRef CAS.
  3. D. R. Paul and J. E. Mark, Prog. Polym. Sci., 2010, 35, 893–901 CrossRef CAS PubMed.
  4. S. D. Burnside and E. P. Giannelis, J. Polym. Sci., Part B: Polym. Phys., 2000, 38, 17–22 CrossRef.
  5. G. Pan, J. E. Mark and D. W. Schaefer, J. Polym. Sci., Part B: Polym. Phys., 2003, 41, 3314–3323 CrossRef CAS PubMed.
  6. X. Huang, X. Fang, Z. Lu and S. Chen, J. Mater. Sci., 2009, 44, 4522–4530 CrossRef CAS.
  7. J. E. Mark, Heterog. Chem. Rev., 1996, 3, 307–326 CrossRef CAS.
  8. J. E. Mark, Polym. Eng. Sci., 1996, 3, 2905–2920 Search PubMed.
  9. E. Delebecq and F. Ganachaud, ACS Appl. Mater. Interfaces, 2012, 4, 3340–3352 CAS.
  10. V. M. Litvinov, H. Barthel and J. Weis, Macromolecules, 2002, 35, 4356–4364 CrossRef CAS.
  11. L. Bokobza, J. Appl. Polym. Sci., 2004, 93, 2095–2104 CrossRef CAS PubMed.
  12. L. Bokobza and O. Rapoport, J. Appl. Polym. Sci., 2002, 85, 2301–2316 CrossRef CAS PubMed.
  13. D. E. Hanson, J. Chem. Phys., 2000, 113, 7656 CrossRef CAS PubMed.
  14. M. Aranguren, E. Mora and C. Macosko, J. Colloid Interface Sci., 1997, 195, 329–337 CrossRef CAS.
  15. L. N. Lewis, J. Stein, Y. Gao and R. E. Colborn, Platinum Met. Rev., 1997, 41, 66–75 CAS.
  16. R. M. Malczewski, D. A. Jahn and W. J. Schoenherr, Peroxide or Platinum? Cure System Considerations, Dow Corning Corporation Document No. 52-1077-01, Michigan, USA, 2005 Search PubMed.
  17. A. M. Bueche, Rubber Chem. Technol., 1955, 28, 865–877 CrossRef CAS.
  18. P. R. Dluzneski, Rubber Chem. Technol., 2001, 74, 451–492 CrossRef CAS.
  19. S. Herrwerth, Cationic and Free Radical UV-Curing Silicone Release Coating, AFERA Technical Seminar and Exhibition, Brussels, 2006 Search PubMed.
  20. O. Schäfer, J. Weis, S. Delica, F. Csellich and A. Kneissl, Polym. Prepr., 2004, 49, 714–715 Search PubMed.
  21. A. S. Fawcett and M. A. Brook, Macromolecules, 2014, 47, 1656–1663 CrossRef CAS.
  22. A. Zhang, L. Yang, Y. Lin, L. I. Yan, H. Lu and L. Wang, J. Appl. Polym. Sci., 2013, 129, 2435–2442 CrossRef CAS PubMed.
  23. J. H. K. K. Hirschberg, F. H. Beijer, H. a. Van Aert, P. C. M. M. Magusin, R. P. Sijbesma and E. W. Meijer, Macromolecules, 1999, 32, 2696–2705 CrossRef.
  24. E. Yildirim, M. Yurtsever, E. Yurtsever and I. Yilgör, J. Inorg. Organomet. Polym. Mater., 2011, 22, 604–616 CrossRef PubMed.
  25. D. Tyagi, J. E. McGrath and G. L. Wilkes, Polym. Eng. Sci., 1986, 26, 1371–1398 CAS.
  26. D. Tyagi, L. Garth, I. Yilgör and J. E. McGrath, Polym. Bull., 1982, 550, 543–550 Search PubMed.
  27. D. Tyagi, I. Yilgör, J. E. McGrath and G. L. Wilkes, Polymer, 1984, 25, 1807–1816 CrossRef CAS.
  28. E. Burgaz, E. Yurtsever and I. Yilgör, Polymer, 2000, 41, 849–857 CrossRef.
  29. I. Yilgör, G. Ekin Atilla, A. Ekin and P. Kurt, Polymer, 2003, 44, 7787–7793 CrossRef PubMed.
  30. J. P. Sheth, A. Aneja, G. L. Wilkes, I. Yilgör, G. E. Atilla and F. L. Beyer, Polymer, 2004, 45, 6919–6932 CrossRef CAS PubMed.
  31. I. Yilgör, T. Eynur and G. L. Wilkes, Polymer, 2009, 50, 4432–4437 CrossRef PubMed.
  32. I. Yilgör, T. Eynur, S. Bilgin and G. L. Wilkes, Polymer, 2011, 52, 266–274 CrossRef PubMed.
  33. J. Heiner, B. Stenberg and M. Persson, Polym. Test., 2003, 22, 253–257 CrossRef CAS.
  34. Q. W. Yuan and J. E. Mark, Macromol. Chem. Phys., 1999, 22, 206–220 CrossRef.
  35. M. M. Demir, Y. Z. Menceloglu and B. Erman, Macromol. Chem. Phys., 2006, 207, 1515–1524 CrossRef CAS PubMed.
  36. I. Yilgör, Prog. Polym. Sci., 2013, 39, 1165–1195 CrossRef PubMed.
  37. I. Yilgör, Polymer, 1999, 40, 5575–5581 CrossRef.
  38. I. Yilgör, Polymer, 2001, 42, 7953–7959 CrossRef.
  39. L. Brunsveld, B. J. Folmer, E. W. Meijer and R. P. Sijbesma, Chem. Rev., 2001, 101, 4071–4098 CrossRef CAS PubMed.
  40. M. M. Rahman, H.-H. Chun and H. Park, J. Coat. Technol. Res., 2010, 8, 389–399 CrossRef.
  41. B. Meissner, J. Appl. Polym. Sci., 1974, 18, 2483–2491 CrossRef CAS PubMed.
  42. D. E. Hanson, Polymer, 2004, 45, 1055–1062 CrossRef CAS PubMed.
  43. A. Camenzind, T. Schweizer, M. Sztucki and S. E. Pratsinis, Polymer, 2010, 51, 1796–1804 CrossRef CAS PubMed.
  44. H. Cochrane and C. S. Lin, Rubber Chem. Technol., 1993, 66, 48–60 CrossRef CAS.
  45. M. Hawley, D. a. Wrobleski, E. B. Orler, R. Houlton, K. Chitanvis, G. W. Brown and D. E. Hanson, in Symposium Q – Mechanical Properties of Nanostructured Materials and Nanocomposites, 2003, vol. 791 Search PubMed.
  46. A. Pouchelon and P. Vondracek, Rubber Chem. Technol., 1989, 62, 788–799 CrossRef CAS.
  47. Q. W. Yuan and J. E. Mark, Macromol. Chem. Phys., 1999, 200, 206–220 CrossRef CAS.
  48. A. I. Medalia, Rubber Chem. Technol., 1972, 45, 1171–1194 CrossRef CAS.
  49. J. A. Osaheni, K. E. Truby and S. Norberto, Macromol. Symp., 2001, 261–268 CrossRef CAS.
  50. M. T. Maxson and C. L. Lee, Rubber Chem. Technol., 1982, 55, 233–244 CrossRef CAS.
  51. A. R. Payne, in Reinforcement of Elastomers, ed. G. Kraus, Wiley Interscience, New York, 1965 Search PubMed.
  52. M.-J. Wang, Rubber Chem. Technol., 1998, 71, 520–589 CrossRef CAS.
  53. F. Clément, Study of reinforcing mechanisms in silica-filled PDMS networks, Ph. D. thesis, Université de Paris IV, 1999.
  54. L. Chazeau, J. D. Brown and L. C. Yany, Polym. Compos., 2000, 21, 202–222 CrossRef CAS PubMed.
  55. L. Mullins, Rubber Chem. Technol., 1969, 42, 339–362 CrossRef CAS.
  56. A. F. Blanchard and D. Parkinson, Ind. Eng. Chem., 1952, 44, 799–812 CrossRef CAS.
  57. A. M. Bueche, J. Appl. Polym. Sci., 1960, 4, 107–114 CrossRef PubMed.
  58. R. Houwink, Rubber Chem. Technol., 1956, 29, 888–893 CrossRef.
  59. Y. Fukahori, J. Appl. Polym. Sci., 2005, 95, 60–67 CrossRef CAS PubMed.
  60. J. Diani, B. Fayolle and P. Gilormini, Eur. Polym. J., 2009, 45, 601–612 CrossRef CAS PubMed.
  61. J. J. Fitzgerald, A. C. Martellock, P. L. Nielsen and R. V. Schillace, Polym. Eng. Sci., 1992, 32, 1350–1357 CAS.
  62. D. E. Hanson, M. Hawley, R. Houlton, K. Chitanvis, P. Rae, E. B. Orler and D. a. Wrobleski, Polymer, 2005, 46, 10989–10995 CrossRef CAS PubMed.
  63. G. Marckmann, E. Verron, L. Gornet and G. Chagnon, J. Mech. Phys. Solids, 2011, 50, 2011–2028 CrossRef.
  64. L. Meunier, G. Chagnon, D. Favier, L. Orgeas and P. Vacher, Polym. Test., 2008, 27, 765–777 CrossRef CAS PubMed.
  65. J. Diani, M. Brieu and J. M. Vacherand, Eur. J. Mech. A/Solids, 2006, 25, 483–496 CrossRef PubMed.
  66. G. Chagnon, E. Verron, L. Gornet, G. Marckmann and P. Charrier, J. Mech. Phys. Solids, 2004, 52, 1627–1650 CrossRef CAS PubMed.
  67. M. a. Llorente, A. L. Andrady and J. E. Mark, J. Polym. Sci., Polym. Phys. Ed., 1981, 19, 621–630 CrossRef CAS PubMed.
  68. J. E. Mark and M.-Y. Tang, J. Polym. Sci., Polym. Phys. Ed., 1984, 22, 1849–1855 CrossRef CAS PubMed.
  69. M. a. Llorente, A. L. Andrady and J. E. Mark, J. Polym. Sci., Polym. Phys. Ed., 1981, 19, 621–630 CrossRef CAS PubMed.
  70. G. D. Genesky and C. Cohen, Polymer, 2010, 51, 4152–4159 CrossRef CAS PubMed.
  71. J. E. Mark, Macromol. Symp., 2003, 191, 121–130 CrossRef CAS PubMed.
  72. B. M. Aguilera-Mercado, G. D. Genesky, T. M. Duncan, C. Cohen and F. a. Escobedo, Macromolecules, 2010, 43, 7173–7184 CrossRef CAS.
  73. G. J. Lake, Rubber Chem. Technol., 1995, 68, 435–460 CrossRef CAS.
  74. J. Ramier, L. Chazeau, C. Gauthier, L. Stelandre, L. Guy and E. Peuvrel-Disdier, J. Mater. Sci., 2007, 42, 8130–8138 CrossRef CAS PubMed.
  75. A. Bhowmick, Polym. Rev., 1988, 28, 339–370 Search PubMed.
  76. C. Kumudinie and J. E. Mark, Mater. Sci. Eng., C, 2000, 11, 61–66 CrossRef.
  77. M. W. Simon, K. T. Stafford and D. L. Ou, J. Inorg. Organomet. Polym. Mater., 2008, 18, 364–373 CrossRef CAS.
  78. B.V. Lebedev, N. N. Mukhina and T. G. Kulayina, Polym. Sci. U.S.S.R., 1979, 20, 1458–1466 CrossRef.
  79. E. D. Lykissa, S. V. Kala, J. B. Hurley and R. M. Lebovitz, Anal. Chem., 1997, 69, 4912–4916 CrossRef CAS.
  80. P. J. Flory and J. Rehner, J. Chem. Phys., 1943, 11, 521 CrossRef CAS PubMed.
  81. M. Mooney, J. Appl. Phys., 1940, 11, 582–592 CrossRef PubMed.
  82. L. R. G. Treloar, The physics of rubber elasticity, Oxford University Press, 1975 Search PubMed.
  83. E. Guth, J. Appl. Phys., 1945, 16, 20–25 CrossRef CAS PubMed.
  84. J. Stein, L. N. Lewis, Y. Gao and R. A. Scott, J. Am. Chem. Soc., 1999, 121, 3693–3703 CrossRef CAS.
  85. M. Andriot, R. Meeks, J. Meeks, E. Gerlach, M. Jungk, A. T. Wolf, S. Cray, T. Easton, A. Mountney, S. Leadley, S. H. Chao, A. Colas, F. de Buyl, A. Dupont, J. L. Gauraud, F. Gubbles, J. P. Lecomte, B. Lenoble, S. Stassen, C. Stevens, X. Thomas and G. Shearer, Silicones in Industrial Applications, in Inorganic Polymers, ed. R. De Jaeger and M. Gleria, Nova, 2007, ch. 2, pp. 61–161 Search PubMed.
  86. J. G. Curro, D. S. Pearson and E. Helfand, Macromolecules, 1985, 18, 1157–1162 CrossRef CAS.
  87. J. G. Curro and P. Pincus, Macromolecules, 1983, 16, 559–562 CrossRef CAS.
  88. S. K. Patel, S. Malone, C. Cohen, J. R. Gillmor and R. H. Colby, Macromolecules, 1992, 25, 5241–5251 CrossRef CAS.
  89. C. Joubert, A. Michel, L. Choplin and P. Cassagnau, J. Polym. Sci., Part B: Polym. Phys., 2003, 41, 1779–1790 CrossRef CAS PubMed.
  90. G. Martin, C. Barrès, P. Cassagnau, P. Sonntag and N. Garois, Polymer, 2008, 49, 1892–1901 CrossRef CAS PubMed.
  91. E. Delebecq, N. Hermeline, A. Flers and F. Ganachaud, ACS Appl. Mater. Interfaces, 2012, 4, 3353–3363 CAS.
  92. D. Bordeaux and J. P. Cohen-Addad, Polymer, 1990, 31, 743–748 CrossRef CAS.
  93. C. M. Roland and C. A. Aronson, Polym. Bull., 2000, 45, 439–445 CrossRef CAS.
  94. E. Delebecq, S. Hamdani-Devarennes, J. Raeke, J.-M. Lopez Cuesta and F. Ganachaud, ACS Appl. Mater. Interfaces, 2011, 3, 869–880 CAS.
  95. G. Heinrich and M. Klüppel, Adv. Polym. Sci., 2002, 160, 1–44 CAS.
  96. J. Ramier, C. Gauthier, L. Chazeau, L. Stelandre and L. Guy, J. Polym. Sci., Part B: Polym. Phys., 2007, 45, 286–298 CrossRef CAS PubMed.
  97. J. Oberdisse, Macromolecules, 2002, 35, 9441–9450 CrossRef CAS.
  98. P. Adriaensens, A. Pollaris, D. Vanderzande, J. Gelan, J. L. White and M. Kelchtermans, Macromolecules, 2000, 33, 7116–7121 CrossRef CAS.
  99. D. a. Polignone and C. O. Morgan, Int. J. Solids Struct., 1993, 30, 3381–3416 CrossRef.
  100. J.-B. Le Cam, B. Huneau, E. Verron and L. Gornet, Macromolecules, 2004, 37, 5011–5017 CrossRef CAS.
  101. I. Yilgör and J. E. McGrath, Adv. Polym. Sci., 1988, 86, 1–86 Search PubMed.

Footnote

Electronic supplementary information (ESI) available. See DOI: 10.1039/c5ra06965c

This journal is © The Royal Society of Chemistry 2015
Click here to see how this site uses Cookies. View our privacy policy here.