Improved magnetic damping in CoFeB|MgO with an N-doped Ta underlayer investigated using the Brillouin light scattering technique

Jaivardhan Sinhaa, Chandrima Banerjeea, Avinash Kumar Chaurasiyaa, Masamitsu Hayashib and Anjan Barman*a
aThematic Unit of Excellence on Nanodevice Technology, Department of Condensed Matter Physics and Material Sciences, S. N. Bose National Centre for Basic Sciences, Block JD, Sector III, Salt Lake, Kolkata 700 098, India. E-mail: abarman@bose.res.in; Fax: +91-33-23353477; Tel: +91-33-23355706-8 ext. 201
bNational Institute for Materials Science, Tsukuba 305-0047, Japan

Received 17th April 2015 , Accepted 19th June 2015

First published on 22nd June 2015


Abstract

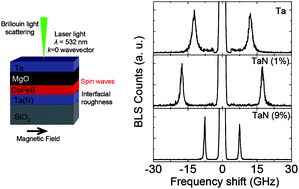
Understanding the role of interfacial roughness on magnetic damping is important for developing advanced spintronic based devices. Using Brillouin light scattering (BLS), here we investigate the interfacial roughness contributing to magnetic inhomogeneity in the technologically important ultrathin CoFeB|MgO heterostructures with Ta and N-doped Ta underlayers. The spin wave frequencies corresponding to uniform precession modes in the BLS spectra for perpendicularly magnetized as well as in-plane magnetized films are investigated. The linewidth shows pronounced dependence on the N-doping in the underlayer. The analysis of linewidth suggests that the magnetic inhomogeneity and the damping reduce significantly by N-doping in the underlayer.


Introduction

With the growing need to achieve Perpendicular Magnetic Anisotropy (PMA)1 in ultrathin films for spintronics based devices, it is important to develop a solid understanding of magnetic inhomogeneity2,3 and damping4,5 in them. A high degree of magnetic uniformity over a large length scale in an ultrathin film is beneficial for device applications where interface magnetic properties play key role. Perpendicularly magnetized Ta|CoFeB|MgO heterostructure6 are attracting much attention recently as they constitute the heart of magnetic tunnel junctions and the recently discovered three terminal devices.7 It is known that in Ta|CoFeB|MgO heterostructure the PMA arises owing to electronic effect at CoFeB|MgO interface.6 The choice of underlayer is also known to control the strength of magnetic anisotropy in these heterostructures.8 It has been found recently that the PMA of Ta|CoFeB|MgO film can be tuned by changing the N-flow rate during Ta underlayer deposition.9 Specifically, CoFeB|MgO films grown on optimally N-doped Ta underlayer has larger interface anisotropy than the film deposited on Ta underlayer. Due to complicated sample preparation for the direct structural characterization when the CoFeB thickness is ∼1 nm (required in achieving PMA)10 it is quite difficult to investigate the structural inhomogeneity which in turn leads to magnetic inhomogeneity.3,11–15 One of the main contributors of magnetic damping in the thin film is magnetic inhomogeneity whose precise control and understanding is worth to address. A reliable and non-destructive method to investigate magnetic inhomogeneity is the investigation of spin wave. Brillouin Light Scattering (BLS) is a powerful technique to study spin wave frequencies in magnetic thin films and multilayers.16–20 Earlier in giant magnetoresistive (GMR) structures spin wave spectra studies using BLS allowed deep understanding of interlayer exchange coupling.21 In a typical BLS measurements the laser is focused onto a sample, and the photons are inelastically back-scattered by the spin waves.18 Due to momentum and energy conservation, the events comprising of annihilation of magnons propagating towards the incoming laser beam (the anti-Stokes process), and creation of magnons propagating in the opposite direction (the Stokes process) take place. The linewidth of the BLS spectrum contains the information of magnetic inhomogeneity11,14,15 and in turn the magnon lifetime.2,3 Earlier, the linewidth of the spin wave spectrum in perpendicularly magnetized ultrathin films has been used to explain magnetic inhomogeneity both qualitatively and quantitatively.11,15,22

Using BLS technique here we investigate thermal spin waves in Ta(N)|CoFeB|MgO films. Peak frequency corresponding to uniform precession mode for zero wave vector is detected. The peak frequency varies with external applied field consistent with earlier reported results of perpendicularly magnetized and in-plane magnetized thin films. The magnetic inhomogeneity in these films is investigated by analyzing the linewidth of the BLS spectrum. Furthermore, it is shown that the use N-doped Ta underlayer in CoFeB|MgO heterostructure results in improved magnetic uniformity.

Experimental details

Thin films were grown by dc/rf magnetron sputtering in ultra high vacuum (base pressure ∼2 × 10⁻⁷ Pa) onto thermally oxidized Si [100] substrates (SiO2 thickness is 100 nm). Ta and Co20Fe60B20 layers were grown using dc power while MgO was deposited using rf power in Ar atmosphere. Nitrogen doping in the Ta underlayer was performed by mixing N2 with Ar during Ta deposition. Based on the flow rate of N2 and Ar during sputter deposition of Ta, we define a quantity Q = SN2/SAr + SN2. Q was varied up to 9% with Q = 0 corresponding to pure Ta underlayer. The film stacks investigated in the present study are Sub|1Ta|1CoFeB|2MgO|1Ta, Sub|4TaN (Q ∼ 1%)|1CoFeB|2MgO|1Ta and Sub|4TaN (Q ∼ 9%)|1CoFeB|2MgO|1Ta (digits represent thickness in nm). The films were subsequently annealed at 300 °C for one hour with no magnetic field applied during the process. The static magnetic properties of these films were measured using Vibrating Sample Magnetometer (VSM). The detailed film characteristics (magnetic dead layer thickness and interface anisotropy) have been described elsewhere.9 As the aim of this work is to understand the magnetic inhomogeneity of ferromagnetic layer originating mainly due to underlayer/CoFeB interface, so we fix the CoFeB layer thickness to 1 nm. The magnetic dead layer thickness, if any, present in the stack will not be important for investigating magnetic inhomogeneity. Backscattered geometry was selected for performing BLS study of thermal spin waves. The main constituent of the set up is a Sandercock-type six-pass tandem Fabry–Perot interferometer.23 A laser beam of wavelength 532 nm (from solid state laser) is focused on to the sample and the inelastically scattered light from the sample due to interaction between incident photons and magnons is analyzed to determine spin wave frequency. Here the frequency shift of the scattered beam from the incident laser frequency corresponds to thermally excited magnon frequency. An in-plane magnetic field H up to 3.1 kOe (maximum in-plane magnetic field that can be applied in our BLS setup, which remains stable over the measurement period of each BLS spectrum, which is typically several hours) is applied parallel to the sample surface and perpendicular to the plane of incidence of light. For all these samples the BLS spectra is measured for k = 0 wave vector. Further details of BLS set up may be found in ref. 24.

Results and discussions

Fig. 1(a)–(c) show the hysteresis loops measured using VSM for in-plane and out-of-plane directions for three different Q values. The nominal CoFeB film thickness was fixed to 1 nm for all the measurement shown here. The saturation magnetization was calculated by dividing the measured moment value by volume of the ferromagnetic film considering its nominal thickness. Effective anisotropy for the film was estimated by taking the areal difference between the in-plane and out-of-plane hysteresis loops. The positive Keff corresponds to out-of-plane easy axis for M whereas the negative Keff corresponds to in-plane easy axis. In Fig. 1(d) we plot the saturation magnetization (left axis) and Keff (right axis) as a function of Q. With increase in Q the Ms increases monotonically. The Keff increases for Q ∼ 1%, however it reduces to negative value corresponding to in-plane easy axis for Q ∼ 9%. In Fig. 1(e) we show the relative change in Ms when the temperature is lowered to 100 K for Q ∼ 1% and Q ∼ 9% films. We observe 38% and 42% increase in Ms for Q ∼ 1% and Q ∼ 9% films respectively at 100 K. Earlier for Q ∼ 0%, 32% increase in Ms has been reported.25 From these studies we understand that these films are thermally robust within the temperature cycling between 300 K to 100 K.
image file: c5ra06925d-f1.tif
Fig. 1 (a)–(c) In-plane and out-of-plane magnetic hysteresis loops plotted in same panel for Q ∼ 0, 1 and 9%. Inset in each panel shows the schematic diagram of the stack. Digits in the schematic correspond to thickness in nm. (d) Saturation magnetization (left axis, square) and effective anisotropy (right axis, circle) plotted as a function of N-doping in the underlayer. (e) Relative change in the saturation magnetization plotted as a function of temperature for Q ∼ 1% and Q ∼ 9%.

In Fig. 2(a) we show the measurement schematic for BLS experiment. The laser light impinges at 90° on the sample (parallel to sample normal) thus enabling the measurement for k = 0 wave vector. An in-plane magnetic field H up to 3.1 kOe was applied parallel to the sample surface and orthogonal to incident laser beam. In Fig. 2(b) we show the Lorentzian fit to a typical elastic peak of the BLS spectra to get an estimate of instrumental linewidth broadening.26 From the fit we obtain the value of linewidth broadening ∼0.4 GHz which gives the measure of lower limit of the linewidth in our BLS spectra. The typical BLS spectra obtained for the film stack are shown in Fig. 2(c)–(e). Note that we see the peaks corresponding to the uniform precession mode in all cases due to magnon creation (Stokes) and magnon annihilation (anti-Stokes) resulting from spin wave excitation.


image file: c5ra06925d-f2.tif
Fig. 2 (a) Schematic for BLS measurement geometry. (b) Lorentzian fit to a typical elastic peak in the BLS spectra. (c)–(e) BLS spectra of the Ta(N)|CoFeB|MgO films at different applied fields for Q ∼ 0, 1% and 9% underlayer. Field values are mentioned for corresponding spectra.

Negligibly small difference is found in the intensity, peak frequency and linewidth between Stokes and anti-Stokes peaks at any applied field. The magnitude of the observed frequency is related to the effective magnetization (Meff).27 For out-of-plane magnetized films the 4πMeff is estimated using eqn (1):27

 
image file: c5ra06925d-t1.tif(1)
We use the Ms and Keff values extracted from the VSM measurement. For Ta and TaN (1%) underlayer films we obtain 4πMeff of −5.5 kOe and −6.5 kOe, respectively from eqn (1). The larger peak frequency observed in the case of TaN (1%) is due to larger effective anisotropy and Meff of this film. The BLS peaks as shown in Fig. 2(c)–(e) are fitted using Lorentzian function and the peak frequency and the linewidth (full width at half maximum, FWHM) are obtained. In Fig. 3(a) and (b) the peak frequency and the linewidth obtained from the anti-Stokes peaks as a function of the applied in-plane magnetic field are shown for all three films.


image file: c5ra06925d-f3.tif
Fig. 3 Variation of peak frequency (a) and linewidth (b) with applied magnetic field for all three film stacks.

From Fig. 3(a) we notice that the films with Ta and TaN (1%) underlayers show a decrease in frequency with the increase in applied magnetic field. For the PMA film, it is known that on increasing the strength of applied in-plane magnetic field the peak frequency first decreases and reaches a minimum at critical field followed by a subsequent increase. The angle between the magnetization and the film plane is determined by the competition between the perpendicular anisotropy and the applied in-plane field.27 The critical field corresponds to the field at which the magnetization is oriented along the film plane at particular applied field. In contrary, the film with TaN (9%) underlayer shows an increase in the frequency with the increase in applied field, a signature of in-plane magnetized ferromagnetic thin film.

To further understand the dependence of the peak frequency on applied in-plane magnetic field in perpendicularly magnetized films (Ta and TaN (Q ∼ 1%)) the data is fitted using eqn (2).28

 
image file: c5ra06925d-t2.tif(2)
where N is the demagnetization factor, γ = γeg/2 is the gyro magnetic ratio, γe = 1.759 × 10⁷ Hz Oe−1 is the value for free electron, g is the spectroscopic splitting factor and Hc is the critical field.28 Considering the film to be isotropic within the film plane we can assume NNxxNyy. As the demagnetization factors satisfy Nxx + Nyy + Nzz = 1 and the films have thickness ∼1 nm, we may assume Nzz = 1 and N ≈ 0. The fits using eqn (2) for Ta and TaN (1%) underlayer cases are shown using red solid curves in Fig. 4(a) and (b). The intercept on x-axis made by the red curve represents the critical field at which the peak frequency takes minima. The critical field obtained using the fit nearly matches the saturation field for the hard axis loop estimated using VSM. From the fit we obtain Hc ≈ 4.8 kOe for Ta and Hc ≈ 6.6 kOe for TaN (1%) underlayer films.


image file: c5ra06925d-f4.tif
Fig. 4 (a) and (b) Peak frequency dependence on field fitted using standard expression for Ta and TaN (1%) underlayer samples with PMA. The red curve shows the fit using eqn (2). (c) Plot of frequency dependence on field for TaN (9%) underlayer film. The red curve shows the fit using standard Kittel eqn (3).

In Fig. 4(c) we show the dependence of frequency on applied field for the in-plane magnetized TaN (9%) underlayer film. The increase in frequency with the increase in bias field is fitted using standard Kittel eqn (3)28 as shown by the red solid curve in Fig. 4(c):

 
image file: c5ra06925d-t3.tif(3)
Here K is the in-plane anisotropy. Here, we use g = 1.9 and K = 0 and determine 4πMeff as fitting parameter. The obtained value of 4πMeff from the fit is 2.2 kOe. From above fits in Fig. 4(a)–(c) we infer that peak frequency dependence on applied magnetic field for Ta, TaN (1%) is consistent with out-of-plane case27 and TaN (9%) is consistent with in-plane case of previously reported literatures.28 For PMA films in our experiment to precisely estimate the minimum frequency in the vicinity of critical field similar to ref. 27 is quite challenging. It is primarily due to the fact that the maximum magnetic field achievable in our set-up is well below the critical field. We hope to address this issue in future.

We now discuss below the linewidth of the BLS spectra and its dependence on Q as well as the applied magnetic-field (peak frequency). The linewidth shows a drastic reduction with the increase in Q over the whole range of the applied magnetic field (Fig. 3(b)), indicating a significant reduction in the damping parameter with Q. In addition, within the investigated field range (upto 3.1 kOe), the linewidth of the film with Ta underlayer increases by nearly a factor of two with applied magnetic field whereas the linewidth of films with TaN (1%) and TaN (9%) underlayer show negligibly small increase with applied field (Fig. 3(b)). The behavior of linewidth in a PMA film across the critical field has been earlier investigated for Co/Au film and extremely large linewidth at critical field has been reported.15 Due to diverging nature of the linewidth when the critical field (4.8 kOe) is approached we observe the significant increase of linewidth for Ta underlayer. For the case of TaN (1%), since the applied in-plane field is well below the critical field (6.6 kOe), we do not observe remarkable increase in the linewidth. In order to get more insight into these results, the linewidth of the BLS spectra for all three films are plotted as a function of the peak frequency in Fig. 5(a) to (c). The sharp decrease in linewidth with increasing frequency for film with Ta underlayer indicates extrinsic contribution (interfacial roughness14 or structural inhomogeneity12,13) to the magnetic inhomogeneity in this film. In contrary, a nearly constant linewidth for TaN (1%) and TaN (9%) underlayers indicate that the extrinsic factors contributing to magnetic inhomogeneity are suppressed by doping N into the underlayer. It is worth mentioning here that the linewidth data shown in Fig. 3 and 5 are not deconvoluted to remove the contribution for instrumental broadening.26 Note that in the linewidth data contribution due to the spectrometer broadening will be uniformly present in the BLS signal for all three films and thus it will not change our interpretation. Despite of presence of instrumental linewidth broadening in the BLS spectra, we are able to extract crucial information of reduction of interfacial roughness in these ultra-thin films. An important point to note here, using other characterization techniques e.g., transmission electron microscopy or grazing angle X-ray diffraction to study the interfacial roughness is quite challenging.


image file: c5ra06925d-f5.tif
Fig. 5 Variation of the linewidth (FWHM) of the BLS spectra with peak frequency for the samples with (a) Q = 0%, (b) Q = 1% and (c) Q = 9%.

It may also be possible that the improved structure related magnetic uniformity in TaN (1%) film assists to some extent in achieving larger PMA in this film as observed earlier.9 A detailed study of linewidth for large field range for both in-plane and out-of-plane directions and for different k vectors will be useful for the detailed quantitative understanding of magnetic inhomogeneity in these films. Nevertheless, the observation of large enough perpendicular magnetic anisotropy (∼6.5 kOe) and reduced spin wave linewidth (damping29) by a factor of 2, that is nearly independent of applied field (spin wave frequency) for the film with Q ∼ 1% (N-doped Ta underlayer) is important for application in spin transfer torque magneto-resistive random access memory (STT-MRAM) devices due to the larger thermal stability and smaller write current. In addition, the in-plane magnetized sample (Q = 9%) showed the smallest linewidth (estimated damping of ∼0.006 using ref. 29), which would be useful for magnonic devices where a long propagation length of the spin waves is required.

Conclusion

In summary, we have investigated spin wave spectra in Ta(N)|CoFeB|MgO films using BLS technique. Frequencies corresponding to uniform precession modes in the BLS spectra of perpendicularly as well as in-plane magnetized film are found. For out-of-plane magnetized sample the spin wave frequency takes a minimum value at a critical field which corresponds to the anisotropy field. The linewidth decreases by nearly a factor of 2, which suggests that the magnetic inhomogeneity reduces with enhanced N-doping in the Ta underlayer. The reduced inhomogeneity in these films by modifying underlayer|CoFeB interface indicates in a large reduction in the value of magnetic damping, which is important for applications in both spintronic and magnonic devices.

Acknowledgements

We thank Arabinda Haldar for useful discussions. We acknowledge the financial assistance from Department of Science and Technology Govt. of India under grant no. SR/NM/NS-09/2011 and S. N. Bose National Centre for Basic Sciences under project no. SNB/AB/12-13/96.

References

  1. M. T. Johnson, P. J. H. Bloemen, F. J. A. denBroeder and J. J. deVries, Rep. Prog. Phys., 1996, 59, 1409–1458 CrossRef CAS.
  2. B. Hillebrands, in Modern Techniques for Characterizing Magnetic Materials, ed. Y. Zhu, Kluwer Academic, Boston, 2005 Search PubMed.
  3. R. L. Stamps, R. E. Camley, B. Hillebrands and G. Guntherodt, Phys. Rev. B: Condens. Matter Mater. Phys., 1993, 47, 5072–5076 CrossRef CAS.
  4. J. M. Shaw, H. T. Nembach and T. J. Silva, Appl. Phys. Lett., 2014, 105, 062406 CrossRef PubMed.
  5. R. D. McMichael, D. J. Twisselmann and A. Kunz, Phys. Rev. Lett., 2003, 90, 227601 CrossRef CAS.
  6. S. Ikeda, K. Miura, H. Yamamoto, K. Mizunuma, H. D. Gan, M. Endo, S. Kanai, J. Hayakawa, F. Matsukura and H. Ohno, Nat. Mater., 2010, 9, 721–724 CrossRef CAS PubMed.
  7. L. Liu, C.-F. Pai, Y. Li, H. W. Tseng, D. C. Ralph and R. A. Buhrman, Science, 2012, 336, 555–558 CrossRef CAS PubMed.
  8. D. C. Worledge, G. Hu, D. W. Abraham, J. Z. Sun, P. L. Trouilloud, J. Nowak, S. Brown, M. C. Gaidis, E. J. O'Sullivan and R. P. Robertazzi, Appl. Phys. Lett., 2011, 98, 022501 CrossRef PubMed.
  9. J. Sinha, M. Hayashi, A. J. Kellock, S. Fukami, M. Yamanouchi, H. Sato, S. Ikeda, S. Mitani, S.-H. Yang, S. S. P. Parkin and H. Ohno, Appl. Phys. Lett., 2013, 102, 242405 CrossRef PubMed.
  10. J. Sinha, M. Gruber, M. Kodzuka, T. Ohkubo, S. Mitani, K. Hono and M. Hayashi, J. Appl. Phys., 2015, 117, 043913 CrossRef PubMed.
  11. K. Hyomi, A. Murayama, J. Eickmann and C. M. Falco, J. Magn. Magn. Mater., 1999, 198–99, 528–530 CrossRef.
  12. J. M. Shaw, H. T. Nembach and T. J. Silva, J. Appl. Phys., 2010, 108, 093922 CrossRef PubMed.
  13. M. L. Schneider, T. Gerrits, A. B. Kos and T. J. Silva, J. Appl. Phys., 2007, 102, 053910 CrossRef PubMed.
  14. A. Murayama, K. Hyomi, J. Eickmann and C. M. Falco, J. Appl. Phys., 1997, 82, 6186–6192 CrossRef CAS PubMed.
  15. A. Murayama, K. Hyomi, J. Eickmann and C. M. Falco, Phys. Rev. B: Condens. Matter Mater. Phys., 1998, 58, 8596–8604 CrossRef CAS.
  16. B. Hillebrands, Phys. Rev. B: Condens. Matter Mater. Phys., 1990, 41, 530–540 CrossRef.
  17. B. Hillebrands, P. Baumgart and G. Guntherodt, Phys. Rev. B: Condens. Matter Mater. Phys., 1987, 36, 2450–2453 CrossRef CAS.
  18. P. Grunberg, Top. Appl. Phys., 1989, 66, 303–335 CrossRef.
  19. M. Vohl, J. Barnas and P. Grunberg, Phys. Rev. B: Condens. Matter Mater. Phys., 1989, 39, 12003–12012 CrossRef CAS.
  20. J. Barnas and P. Grunberg, J. Magn. Magn. Mater., 1989, 82, 186–198 CrossRef.
  21. F. Saurenbach, J. Barnas, G. Binasch, M. Vohl, P. Grunberg and W. Zinn, Thin Solid Films, 1989, 175, 317–324 CrossRef CAS.
  22. A. Murayama, K. Hyomi, J. Eickmann and C. M. Falco, Phys. Rev. B: Condens. Matter Mater. Phys., 2000, 61, 8984–8992 CrossRef CAS.
  23. R. Mock, B. Hillebrands and R. Sandercock, J. Phys. E: Sci. Instrum., 1987, 20, 656–659 CrossRef CAS.
  24. A. Haldar, C. Banerjee, P. Laha and A. Barman, J. Appl. Phys., 2014, 115, 133901 CrossRef PubMed.
  25. J. Kim, J. Sinha, S. Mitani, M. Hayashi, S. Takahashi, S. Maekawa, M. Yamanouchi and H. Ohno, Phys. Rev. B: Condens. Matter Mater. Phys., 2014, 89, 174424 CrossRef.
  26. W. F. Oliver, C. A. Herbst, S. M. Lindsay and G. H. Wolf, Rev. Sci. Instrum., 1992, 63, 1884–1895 CrossRef CAS PubMed.
  27. J. R. Dutcher, J. F. Cochran, I. Jacob and W. F. Egelhoff, Phys. Rev. B: Condens. Matter Mater. Phys., 1989, 39, 10430–10432 CrossRef CAS.
  28. G. Gubbiotti, G. Carlotti, S. Tacchi, M. Madami, T. Ono, T. Koyama, D. Chiba, F. Casoli and M. G. Pini, Phys. Rev. B: Condens. Matter Mater. Phys., 2012, 86, 014401 CrossRef.
  29. V. E. Demidov, S. Urazhdin, E. R. J. Edwards and S. O. Demokritov, Appl. Phys. Lett., 2011, 99, 172501 CrossRef PubMed.

This journal is © The Royal Society of Chemistry 2015
Click here to see how this site uses Cookies. View our privacy policy here.