
A core–shell CdTe quantum dots molecularly imprinted polymer for recognizing and detecting p-nitrophenol based on computer simulation†
Yingchun Wanga,
Ningwei Wangd,
Xiaoni Nib,
Qianqian Jianga,
Wenming Yangc,
Weihong Huanga and
Wanzhen Xu*a
aSchool of the Environment and Safety Engineering, Jiangsu University, Zhenjiang 212013, China. E-mail: xwz09@ujs.edu.cn; Fax: +86 511 88791947; Tel: +86 511 88791919
bZhenjiang Institute for Drug Control of Jiangsu Province, Zhenjiang 212003, China
cSchool of Material Science and Engineering, Jiangsu University, Zhenjiang 212013, China
dZhenjiang Entry-Exit Inspection Quarantine Bureau, Zhenjiang 212003, P. R. China
First published on 19th August 2015
Abstract
In this study, molecularly imprinted technology, combined with fluorescence measurement and computer simulation, was used to detect contaminant p-nitrophenol. Seven molecular dynamics simulations of molecular imprinting prepolymerization systems were performed to optimize the imprinting shell. Results indicated that the system with a p-nitrophenol (4-NP): 3-aminopropyltriethoxysilane (APTES): tetraethylorthosilicate (TEOS) mole ratio of 8![[thin space (1/6-em)]](https://www.rsc.org/images/entities/char_2009.gif) :8:12 led to the best stable template–functional monomer clusters and the hybrid SiO2 layer with CdS-like clusters on the surface of CdTe was synthesized by a simple reflux procedure. The prepared imprinted materials (CdTe@SiO2-MIPs) on the surface of silica contained CdTe nanoparticles (CdTe@SiO2) by surface imprinting and Stöber method polymerization were characterized by transmission electron microscopy, fluorescence spectroscopy, Fourier-transform infrared spectroscopy, ultraviolet–visible analysis and X-ray diffraction. A linear relationship between relative fluorescence intensity and the concentration of 4-NP was obtained with a limit of detection of 0.08 μmol L−1 and the imprinting factor (IF) was 2.23 which indicated that special binding sites with binding property to p-nitrophenol were created on the surface of the CdTe@SiO2-MIPs materials. Ultimately, the feasibility of the fluorescent materials was successfully evaluated through the analysis of 4-NP in tap water and lake water. The recoveries were above 97.3%.
:8:12 led to the best stable template–functional monomer clusters and the hybrid SiO2 layer with CdS-like clusters on the surface of CdTe was synthesized by a simple reflux procedure. The prepared imprinted materials (CdTe@SiO2-MIPs) on the surface of silica contained CdTe nanoparticles (CdTe@SiO2) by surface imprinting and Stöber method polymerization were characterized by transmission electron microscopy, fluorescence spectroscopy, Fourier-transform infrared spectroscopy, ultraviolet–visible analysis and X-ray diffraction. A linear relationship between relative fluorescence intensity and the concentration of 4-NP was obtained with a limit of detection of 0.08 μmol L−1 and the imprinting factor (IF) was 2.23 which indicated that special binding sites with binding property to p-nitrophenol were created on the surface of the CdTe@SiO2-MIPs materials. Ultimately, the feasibility of the fluorescent materials was successfully evaluated through the analysis of 4-NP in tap water and lake water. The recoveries were above 97.3%.
1. Introduction
Nitrophenols are classified as priority and persistent contaminants due to their relatively high toxicity, even at trace level concentrations in aqueous matrices. Among the mono-nitrophenols, p-nitrophenol (4-NP) which is regarded as an intermediate1 has been widely used to synthesize drugs for medicine, organic pesticides, fuels, etc. After use, these compounds are released into the environment and food chain through the effluents of various industries. Due to its genotoxicity and carcinogenesis,2 it is a typical pollutant, and listed as one of 68 priority control pollutants in China,3 and one of the 129 key pollutants by the Environmental Protection Agency.4 It is toxic by inhalation or swallowing, contacting with skin that could result in dangerous cumulative effects and is highly toxic to aquatic organisms. It can cause many different diseases such as dermatitis, methemoglobinemia and asthma, an even lead to cancer and aggravate tumor growth. Considering its harmful nature its accurate determination and re-concentration are very necessary. The conventional methods for 4-NP detection involve chemical oxidation, colorimetry or solvent extraction.5–7 In the present work, we have synthesized fluorescent molecularly imprinted polymers (CdTe@SiO2-MIPs) via imprinting technology, which combined with fluorescence sensing and computer modeling was applied to recognize and detect 4-NP. Template 4-NP immobilizing was performed using 3-aminopropyltriethoxysilane (APTES) and tetraethoxysilane (TEOS) to associate the target analyte on the surface of the fluorescent substrate CdTe QDs. According to molecularly dynamics simulation, the suitable ratio of monomer/template was chosen. Then this ratio was applied to synthesize the imprinting shell by imprinting technology.Molecular imprinting is a process whereby functional monomers and cross-linking agents are copolymerized in the presence of the target analytes which act as molecular templates.8–12 The target analytes or derivatives are employed as templates to form complexes with functional monomers via covalent or non-covalent interactions, such as hydrogen bonds, ionic and/or hydrophobic interactions, around which cross-linking monomers are arranged and co-polymerized to form a rigid polymer. The target analytes are regarded as the template species to offer specific binding sites in the process of forming molecularly imprinted polymers. After removal of the template, these tailor-made polymer materials possess special shape and size of binding sites, which will exhibit a great affinity for the template molecules.13 In recent years, owing to many remarkable advantages such as high selectivity, physiochemical stability, low cost, specific recognition against the imprinted molecules14 and easy preparation, molecularly imprinted polymers (MIPs) have been widely used to many fields such as chromatographic separation, antibody mimetics, artificial receptors and in catalysis.15–19 However, many challenges still remain to be addressed. One is the low yield of high affinity sites in the process of formation of the molecularly imprinted layer.20,21 There are many studies aimed at improving the yield of high affinity binding sites including stoichiometric imprinting strategy,21,22 covalent imprinting mechanisms,23 functional monomer dimerization20 and site-selective chemical modification of molecularly imprinted polymers by covalent imprinting mechanisms.24 As a result, excess functional monomers, which offer more background sites, are often added to ensure the formation of the most stable template–functional monomer clusters so that they can increase the affinity and selectivity for the guest molecules. Empirical optimization via additional synthetic steps is a common approach to synthesize better MIPs. However, such methods are not rigorous and are time-consuming. Computational chemistry, which can be used to design the prepolymerization systems to choose the most suitable ratio of templates and functional monomers, has been introduced in MIPs to avoid functional monomer overloading and reduce preparation time.25
To further improve the selectivity and sensitivity of MIPs, fluorescence is a meaningful signalling element because of its simplicity and low detection limit. Quantum dots (QDs), have received much attention due to their unique optical properties such as high quantum yield, narrow and symmetrical spectra, broad excitation spectra and photostability.26,27 Recently, owing their special traits, QDs have been used as novel probes and combined with molecular imprinting techniques. Many researchers have produced several kinds of fluorescence probes such as ZnS:Mn2+ quantum dots,28 CdSe,29 CdZnTe alloyed quantum dots.30 Nevertheless high stability is necessary for highly sensitive detection applications. There have been some reports on coating SiO2 layers on the surface of semiconductor materials.37,38 For example, QDs which are introduced in various bio-applications are coated with a thin shell.36 However, such SiO2 shells dramatically reduces the fluorescence intensity.39 In reference work,40,41 CdTe@SiO2 was prepared using the Stöber method by adding TEOS directly into the mixture of NaHTe, Cd2+, mercaptopropionic acid, with a silica shell being formed on the surface. This method is not conducive to form good core–shell structure and can cause problems or difficulties for FL detection. In this study, a modified sol–gel method with a certain time of refluxing successfully led to QDs covered with a thin hybrid SiO2 shell.43 The hybrid SiO2-coated CdTe showed good core–shell structure and the thinness of the shell led to reduced fluorescence decrease. High FL efficiency was retained and the stability was increased as the CdS-like clusters were embedded in the SiO2 shell on the surface of QDs (hybrid SiO2-coated CdTe). Also, with the protection of the hybrid SiO2 shell, their fluorescence lifetime was longer than that of the initial CdTe materials. Thus QDs coated with a hybrid SiO2 shell should be good candidates for supersensitive applications due to their extremely high FL efficiency and good stability in solution.
The hybrid SiO2-coated QDs and computer simulation as auxiliary means in molecular imprinting technique were applied to detect 4-NP. The thioglycolic acid (TGA) functionalized CdTe QDs were synthesized in aqueous phase, and the modified sol–gel method with a simple reflux process was used to coat with a thin hybrid shell CdS-like clusters on the surface of CdTe QDs. Molecular dynamics simulations were employed to optimize the imprinting shell of the fluorescent sensor and employment of the hybrid SiO2-coated CdTe with increasing FL efficiency. Simulation of molecular structure was applied to depict the three dimensional structure to help us more fully understand the molecular interactions. The prepolymerization systems constituting of 4-NP, APTES, TEOS and ethanol were modelled through computer simulation and the binding energies between various groups were calculated. Then according to the data concerning the intermolecular forces between molecules, the optimal molar ratio of the template/monomer was selected to synthesize MIPs. Furthermore, compared with other methods, this procedure only requires the calculation of binding forces between molecules, and is therefore rapid, simple, convenient and low cost.
2. Results and discussion
2.1 The characterizations of CdTe QDs and CdTe@SiO2
To investigate the effects of refluxing time on the optical properties of CdTe QDs, fluorescence spectra of the CdTe QDs were monitored during the experiments. We could alter the refluxing time to obtain different wavelength QDs and results are presented in Fig. 1A and B. Another variable on the fluorescent properties of the QDs was the pH of the reaction solution before adding the precursor. In our experiments we investigated pH = 11.5, 12.0, 12.5 and 12.7 solutions. According to the results of Fig. 1A and B, these mixtures were refluxed for 3 h, and the fluorescence (FL) intensity results are presented in Fig. 1C. Further factors which affect the QDs would include temperature, refluxing time, pH, the quantity of the stabilizer.32 In this study, however, we concentrated on reluxing time and pH, as these cause relatively obvious changes of the QDs. | ||
| Fig. 1 (A–C) FL spectra of thiol-capped CdTe QDs synthesized at 105 °C. (A) pH = 12.0 for different reflux times with PMT 500 and (B) pH = 12.5 for different reflux times with PMT 550. (C) the same reaction time but different pH with PMT 700. (D) UV-vis absorption spectrum of 4-NP. | ||
Fig. 1 shows the FL emission behaviors of CdTe QDs capped by TGA. As shown in Fig. 1A and B, increasing the refluxing time leads to a gradual increase in wavelength within the whole wavelength range of CdTe QDs and progressive red shifts at the wavelength onset. Accompanying these variations in wavelength, fluorescence intensity is enhanced as a function of the refluxing time up to five hours. As the fluorescence intensity and wavelength increase only slightly after three hours, the CdTe QDs obtained after 3 h of refluxing were chosen for the subsequent preparation of the CdTe@SiO2 composite particles. In Fig. 1C, increasing fluorescence followed by a decrease is observed with pH, and pH 12.0 was found to be optimal. As a consequence, 3 h refluxing time and pH = 12.0 were chosen for the following experiments. Also, considering the ultraviolet absorption peak of 4-NP in Fig. 1D and so as to prevent the occurrence of multiple frequency peaks, the wavelength of QDs at 560 nm, observed at pH = 12.0 and 3 h refluxing time, was suitable.
As multicore or mononuclear CdTe@SiO2 particles were obtained upon the use of prepared CdTe QDs, a modified sol–gel method was used to synthesize hybrid SiO2-coated CdTe particles. The seed-growth method, which is modification of the sol–gel method, led to a red shift of the peak of the QDs and the FL intensity increased as shown in Fig. 2. During reflux, the CdS-like clusters nucleated and grew into a thin layer. The factor for the increased fluorescence efficiency should be the absence of an interface between the QDs and the generated clusters. The red shift is ascribed to a reduction of quantum size effect through the formation of CdS clusters in the vicinity of the QDs.
 | ||
| Fig. 2 FL spectra of the materials. | ||
In alkaline environment, the QDs were coated with a SiO2 layer because of partial hydrolysis of TEOS. Refluxing for 30 min led to a SiO2 shell on the QDs. A very thin silica layer was successfully integrated into the surface of the QDs in an alkaline CdTe colloidal solution with TGA and Cd2+. The crystal structure formation and corresponding core/shell heterostructures of CdTe quantum dots were characterized by X-ray investigation. Fig. 3 displays the XRD pattern of CdTe and corresponding CdTe@SiO2 nanoparticles. Fig. 3a shows that as-prepared TGA capped CdTe dots have a characteristic cubic zinc blende CdTe pattern with diffraction peaks at 23.7, 39.2 and 47.3°, which is also the dominant crystal phase of bulk CdTe, corresponding to (111), (220) and (311) planes of the reported CdTe peaks (JCPDS card no. 15-0770). Fig. 3b shows the hybrid SiO2 shell including CdS-like clusters on the surface of CdTe QDs. At 2θ value of 20.7°, there appeared a peak in CdTe@SiO2 particles, which can be indexed to SiO2 spheres. Further there are obvious shifts from CdTe to CdS structure and the three distinct diffraction peaks of CdTe QDs are weakened, due to the existence the thin silica layer CdS-like clusters.
 | ||
| Fig. 3 XRD patterns of CdTe QDs (a) and CdTe@SiO2 (b). | ||
2.2 Computer simulation the prepolymerization of the CdTe@SiO2-MIPs
The selectivity and sensitivity of the hybrid SiO2-coated CdTe fluorescent sensor is endowed by the molecular imprinting shell. Hence it is of great importance for analytical application of the fluorescent sensor that designing the imprinting shell should lead to optimal performance. The dummy computer molecular polymerization technology was used to prepare the MIPs.33 The ingredients of these prepolymerization systems are summarized in Table 1. Chemical structures and unique atom identifiers for molecules in molecular dynamics simulations are shown in Fig. 4. A comprehensive theoretical analysis of the interactions existing in the prepolymerization solution was undertaken, then results were applied to design the optimal quantitative relation of templates, functional monomers and cross-linking agents. The interactions between the amino (N1) of APTES and the hydroxyl (O1) and nitro (O2) of 4-NP were mainly analyzed. The radial distribution functions (RDFs) of these atoms which might form molecularly imprinted binding sites are shown in Fig. 5 and S1.† Comparing Fig. S1† and 5, we observe that their maximum peaks were all around 3.0 Å but the degree of concentration of their peaks showed visible difference, especially for the interaction between O2 and N1. According to Olsson,42 a bond cut off distance of 3.0 Å was used to analyze hydrogen-bonding interactions. Therefore, all RDFs were integrated between 0.0 and 3.0 Å to calculate the average number of O within a spherical radius of 3.0 Å around N1. Fig. 5 and S1† are RDFs showing the density of O around N during computer simulation. Larger radial shell number implies the greater density of O1 around N (O1–N1) and the density of O2 around N (O2–N1) which is regarded as the reference, is shown in the inset. Compared to O2–N1, a greater degree of N interaction with O1 is observed for all systems. So the focus of the following discussions lies in the interaction between O1 and N1.| Type | 4-NP | APTES | TEOS | Ethanol |
|---|---|---|---|---|
| APTES-MIP-1 | 8 | 10 | 32 | 100 |
| APTES-MIP-2 | 8 | 10 | 8 | 100 |
| APTES-MIP-3 | 8 | 10 | 16 | 100 |
| APTES-MIP-4 | 8 | 12 | 16 | 100 |
| APTES-MIP-5 | 8 | 8 | 10 | 100 |
| APTES-MIP-6 | 8 | 8 | 12 | 100 |
| APTES-MIP-7 | 8 | 8 | 16 | 100 |
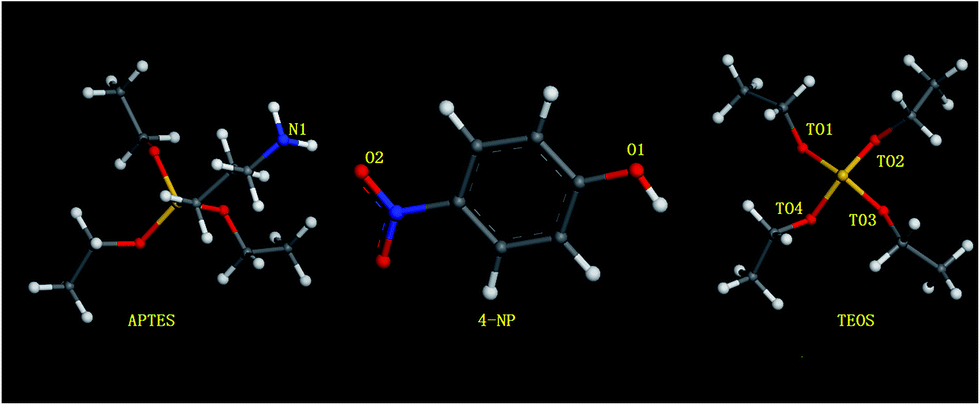 | ||
| Fig. 4 The structures of 4-NP, APTES, TEOS and some binding sites. | ||
 | ||
| Fig. 5 RDFs showing the densities of APTES at different separation distances from the 4-NP functional groups in the prepolymerization mixtures as a function of the ratios of 4-NP, APTES and TEOS: (A) APTES-MIP-3, (B) APTES-MIP-4, (C) APTES-MIP-6, (D) APTES-MIP-7. | ||
As a comparison, APTES-MIP-1, APTES-MIP-2 and APTES-MIP-3 were selected to investigate the effect of concentration of cross-linking agents on the templates and functional monomer complexation. RDFs in Fig. S1(A and B)† of APTES-MIP-1 and APTES-MIP-2 show a relatively poorer interaction between O1 and N1 than interaction of APTES-MIP-3 in Fig. 5A, most probably due to TEOS being at too high or low concentration, respectively. Too high a concentration would hinder APTES to move freely whereas too low a concentration would lead to lower 4-NP interaction with APTES. APTES-MIP-3 shows a more favorable radial distribution function and thus the prepolymerization mixture of APTES-MIP-3 is best. Based on this result, fixing the ratio of templates and cross linking agents, we further studied APTES-MIP-3, APTES-MIP-4 and APTES-MIP-7 as another group of mixtures to optimize the concentration of functional monomers. The RDFs in Fig. 5A, B and D show their interaction between O1 and N1. It is obvious that increasing the amount of APTES does not enhance the interaction between APTES and 4-NP but when the ratio of 4-NP and APTES was decreased to 8:8 as in APTES-MIP-7, an improvement is seen. A possibility was that the higher concentration of cross-linking agent trapped APTES by the influence of steric effects. Now setting the APTES level, in order to get the optimum proportion of these mixtures, we further compared APTES-MIP-5, APTES-MIP-6 and APTES-MIP-7. When the ratio of 4-NP and APTES was 8:8, the acting force of the binding sites was little affected by varying the TEOS level. What caused this phenomenon might be the self-assembly of APTES under the lower concentration cross-linker, and a mass of cross-linking agent TEOS may be self-assembly to form a rigid structure, then hinder the function between monomer PATES and template 4-NP. The RDFs of APTES-MIP-5 (6 and 7) in Fig. S1C† and 5C and D show that the interaction between O1 and N1 of APTES-MIP-6 is an optimal uniform distribution around 3.0 Å with the best result obtained when the ratio of 4-NP, APTES and TEOS was 8:8:12 as shown in Fig. 5C for APTES-MIP-6. The interactions between O1 and N1, with sharp and high peaks are around 2.85 Å, indicate formation of a strong hydrogen bond. However, in order to prove the correctness of the results, we chose four prepolymerization mixtures corresponding to APTES-MIP-3, APTES-MIP-4, APTES-MIP-6, APTES-MIP-7 as contrast experiments to synthesize CdTe@SiO2-MIPs by the same method but with different ratios.
2.3 Experimental verification of the simulation results
In order to ensure the reliability of the information, we performed ultraviolet absorption experiments by changing the proportion of mixtures according to the prepolymerization systems in Table 1. Based on the RFDs of these mixtures in Fig. 5 and S1,† we chose five groups as a comparison. The reaction conditions were kept the same with the synthesis of the CdTe@SiO2-MIPs. It should be noticed that the hybrid SiO2-coated CdTe QDs should not be added in these reactions. The results are shown in Fig. 6. The absorption peaks of 4-NP at 315 and 405 nm change dramatically in Fig. 6 verifying the interaction between 4-NP and APTES and indicating that suitable concentrations of these substances were very important. APTES-MIP-6 was found to exhibit the most marked changes which was consistent with the molecular dynamics simulations. | ||
| Fig. 6 Ultraviolet-visible spectra of different prepolymerization systems. | ||
For further validation, CdTe@SiO2-MIPs were synthesized by Stöber method. The structures and morphological characteristics of the resulting MIP materials were investigated by transmission electron microscopy (TEM) as shown in Fig. 7. The products are core–shell particles but hybrid SiO2-coated CdTe cores and imprinting layers on the particles was always clearly observed, Fig. 7A and B show relatively poorly characterised particles for APTES-MIP-3 and APTES-MIP-4, corresponding to RDFs in Fig. 5A and B. By contrast Fig. 7C and D show relatively good images of APTES-MIP-6 that is synthesized with the optimum ratio corresponding to the RDF in Fig. 5C. The shape of the APTES-MIP-6 was close to spherical with size in the range of 50.0 ± 3.0 nm after coating with silica and the obtained hybrid SiO2-coated CdTe core is about 5.0 nm in size. The hybrid SiO2-coated CdTe core and imprinting layer on each particle can be clearly observed. Fig. 7E and F, corresponding to APTES-MIP-7 show better images for APTES-MIP-3 and APTES-MIP-4, but worse than for APTES-MIP-6. The dispersity of APTES-MIP-6 in the solvent and the dispersion degree of quantum dots in the imprinted layer was clearly optimal. This result again certifies the correctness of the molecular dynamics simulations.
 | ||
| Fig. 7 TEM images of APTES-MIP-3 (A), APTES-MIP-4 (B), APTES-MIP-6 (C and D) and APTES-MIP-7 (E and F). | ||
Both TEM images and the ultraviolet absorption experiments pointed to APTES-MIP-6 as the optimal mixture. Therefore all following experiments were performed with the ratio of APTES-MIP-6 to synthesize CdTe@SiO2-MIPs. CdTe@SiO2-NIPs were synthesized by the same method but without 4-NP templates.
2.4 Characterization of CdTe@SiO2-MIPs and CdTe@SiO2-NIPs
Fig. 2c and d are the FL spectra of CdTe@SiO2-NIPs and CdTe@SiO2-MIPs. The FL intensity of CdTe@SiO2-MIPs and CdTe@SiO2-NIPs are slightly lower than that of hybrid SiO2-coated CdTe. In comparison with the FL spectrum of CdTe@SiO2, the PL peak of CdTe@SiO2-MIPs is little red shifted, which arise from thickness of the imprinted silica layer and the large electric field. Another may due to energy loss of the CdTe QDs when synthesizing the MIPs might have little duty for this phenomenon.
To ensure the successfully compound CdTe@SiO2-MIPs on the surface of the CdTe@SiO2, the FT-IR spectra of CdTe@SiO2-MIPs, CdTe@SiO2-NIPs and CdTe@SiO2-4-NP are detected with the KBr disks and are compared in Fig. 8. The broad and strong peaks appeared at 1103 cm−1 and 791 cm−1 are the Si–O–Si and Si-O in Fig. 8, respectively. According to a ref. 33 peak of N–H is around 1500 to 1900 cm−1 when the bending vibration took place. The peaks of 1589 and 1556 cm−1 in Fig. 8a–c are the N–H of 4-NP and N–H of APTES, respectively. But compared with CdTe@SiO2-4-NP (a), the peaks are absent or are only little in CdTe@SiO2-MIPs (b). The N–H band around 1556 cm−1 in Fig. 8(a and b), resulting from APTES, proved successful synthesis CdTe@SiO2-MIPs and CdTe@SiO2-NIPs on the surface of the CdTe@SiO2. The peaks at 1495 cm−1, 1390 cm−1, 856 cm−1 and 642 cm−1 were the bands C![[double bond, length as m-dash]](https://www.rsc.org/images/entities/char_e001.gif) C, ONO, C–N and C–H of CdTe@SiO2-4-NP. These peaks missed in CdTe@SiO2-MIPs to prove the imprinted sites existing. And the other aspects that the spectra of CdTe@SiO2-MIPs and CdTe@SiO2-NIPs were same also can prove the successful synthesis.
C, ONO, C–N and C–H of CdTe@SiO2-4-NP. These peaks missed in CdTe@SiO2-MIPs to prove the imprinted sites existing. And the other aspects that the spectra of CdTe@SiO2-MIPs and CdTe@SiO2-NIPs were same also can prove the successful synthesis.
 | ||
| Fig. 8 FT-IR spectra of CdTe@SiO2-4-NP (a), CdTe@SiO2-NIPs (b) and CdTe@SiO2-MIPs (c). | ||
 | ||
| Fig. 9 The stability of CdTe@SiO2-MIPs at room temperature. | ||
2.5 Characterization of analytical performance
| F0/F = 1 + KSV[Q] |
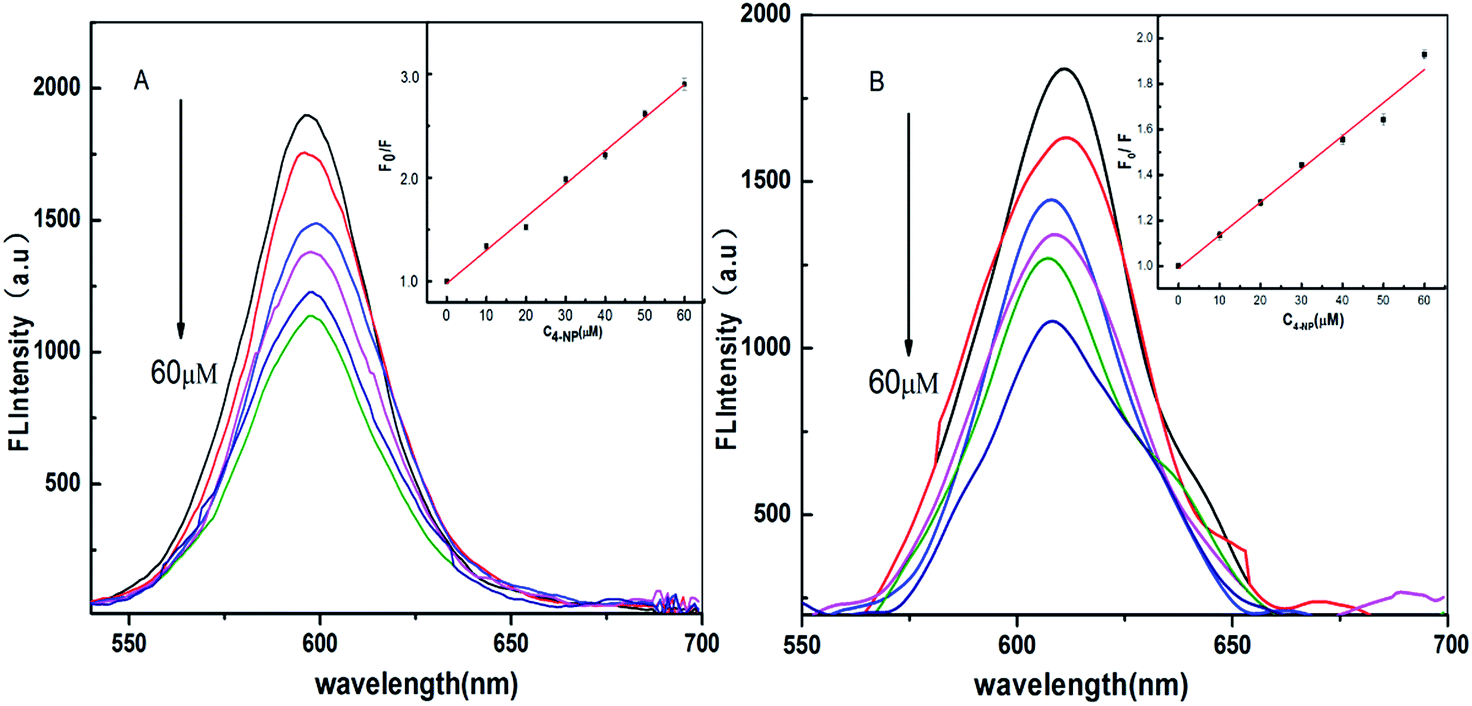 | ||
| Fig. 10 Fluorescence emission spectra of CdTe@SiO2-MIPs (A) and CdTe@SiO2-NIPs (B) at different concentrations of 4-NP in aqueous solution and the corresponding Stern–Volmer curve (insets). | ||
In the quenching kinetics equation F0 and F are the FL intensities of the CdTe@SiO2-MIPs before and after adding the template, respectively. KSV is the Stern–Volmer constant, and [Q] is the concentration of quencher. In Fig. 10A, in the concentration range of 10–60 μmol L−1, the fitting equation has a linear relationship with a correlation coefficient of 0.99734 for CdTe@SiO2-MIPs, which verifies that the synthesized imprinted materials has good recognition for the template 4-NP through the quenching degree of the fluorescence intensity. The linear regression equation of CdTe@SiO2-MIPs is F0/F = 0.99055 + 0.031189C4-NP. The lower limit of quantitation is calculated by 3σ/K, and corresponds to 0.08 μmol L−1. Compared with the fluorescence sensor based on Mn-doped ZnS quantum dots,35 the present fluorescence sensor provides a wide linear range and high selectivity. The binding sites on the surface of the CdTe@SiO2-MIPs are efficient for the template to reunite with the CdTe@SiO2-MIPs. CdTe@SiO2-NIPs materials showed the same quenching phenomenon with a correlation coefficient of 0.99115. The imprinting factor (IF) was 2.23 and the peak positions of CdTe@SiO2-MIPs and CdTe@SiO2-NIPs materials were little affected on addition of various amounts of 4-NP. The non-covalent interactions between the specified atoms through electron transfer should be responsible for the quenching phenomenon.
The results indicated when the template was added into the CdTe@SiO2-MIPs materials, the FL intensity of the materials decreased more dramatically than for CdTe@SiO2-NIPs, so that the MIPs showed better detection.
 | ||
| Fig. 11 The selectivity of CdTe@SiO2-MIPs and CdTe@SiO2-NIPs. | ||
| Sample | Spiked/μM | Found/μM | Recovery (%) | RSD (%) |
|---|---|---|---|---|
| Tap water | 0.0 | 0.0 | ||
| Tap water | 7.5 | 7.4 | 98.7 | 4.8 |
| Tap water | 25.0 | 25.2 | 100.8 | 2.4 |
| Tap water | 50.0 | 50.1 | 100.2 | 1.6 |
| Lake water | 0.0 | 0.0 | ||
| Lake water | 7.5 | 7.3 | 97.3 | 6.4 |
| Lake water | 25.0 | 25.8 | 103.2 | 5.1 |
| Lake water | 50.0 | 51.1 | 102.2 | 2.1 |
The recovery rates are between 97.3 and 103.2%, and the RSDs are relatively low. Thus the fluorescence sensor prepared in this work could be used to accurately measure 4-NP in the water environment.
3. Experimental section
3.1 Materials and reagents
Tellurium powder (Te), sodium borohydride (NaBH4) and thioglycolic acid (TGA) were obtained from Aladdin. Cadmium chloride (CdCl2·2.5H2O), p-nitrophenol (4-NP), methylnitrobenzene (3-NT), nitrophenylamine (3-NA), phenol, bisphenol A (BPA), sodium hydroxide (NaOH) and aqueous ammonia (NH3·H2O) were obtained from Shanghai Chemical Reagent Company (Shanghai, China). 3-Aminopropyltriethoxysilane (APTES), and tetraethoxysilane (TEOS) were obtained from Alfa Aesar. All chemicals in our experiments were analytical grade. The aqueous solutions were prepared using deionized water.3.2 Characterization
Fluorescence (FL) measurements and UV-vis spectra (200–800 nm) were recorded on a UV-2450 spectrophotometer (Shimadzu). Infrared spectra (4000–400 cm−1) were recorded using Nicolet NEXUS-470 FT-IR apparatus (USA) as KBr pellets. Transmission electron microscopy (TEM) was conducted using a JEOL, JEM-2100 set-up and X-ray powder diffraction spectra were recorded using a D8 Advance instrument.In the experiments, all fluorescence detections were performed under the same conditions: the excitation wavelength was set at 365 nm. The slit widths (5 nm) were kept constant within each data set. The PMT voltage was allowed to vary: 500, 550 V for Fig. 1A and B, respectively; 700 V for the other measurements.
3.3 Synthesis of hydrosulfuryl modified CdTe QDs
CdTe QDs were synthesized in aqueous solution as described31 with little modification. We mixed aqueous CdTe QDs with thioglycolic acid as stabilizer prior to adding freshly prepared precursor sodium hydrogen telluride (NaHTe).The freshly prepared precursor NaHTe was synthesized with 125.0 mg tellurium powder (Te), 200.0 mg sodium borohydride (NaBH4) and 10.0 mL deionized water. Te and NaBH4 were added into a 15.0 mL vitreous bottle and 10.0 mL of deionized water was added. The mixture was put into ice-bath and allowed to stir to give a milky dispersion.
Separately, we added 553.0 mg cadmium chloride (CdCl2·2.5H2O) and 284.0 mg thioglycolic acid (TGA) into 175.0 mL deionized water and adjusted the mixture to pH = 12.0 with 1 M NaOH, and strongly stirred under the protection of nitrogen for 30 min. Then 6.0 mL of the fresh solution of NaHTe was added to this mixture quickly, and reacted at 100 °C with stirring and refluxing for several hours. A stable aqueous solution of thioglycolic acid capped CdTe QDs were obtained, which was used in the next step after 7 days.
3.4 Preparation of CdTe@SiO2
We used the seed-growth method in which the “seed” was the pure QDs which was prepared by the hydrothermal method above. 150.0 mL of a mixed aqueous solution of 114.0 mg CdCl2·2.5H2O and 138.0 mg TGA was added to 250 mL flask and this mixture was adjusted to pH = 10.5 with 1 M NaOH. Subsequently 15.0 mL of the aged CdTe was added into this flask, and then 7.5 mL NH3·H2O (6.25 wt%) and 2.0 mL TEOS were also added, and allowed to react for 3 h at room temperature in the absence of light. Then the mixture solution was refluxed for 30 minutes to generate CdS-like clusters in the SiO2 shell at 100 °C.3.5 Molecular dynamics simulations
The monomers that are extensively used in MIP studies include 4-vinylpyridine (4-VP), acrylamide (AM), methyl acrylic acid (MAA). etc., the choice depending on the acid–base properties and functional groups of these monomers. At the same time, the cross-linking also affects the characteristics of recognition of MIPs. In this study we used APTES as monomer and TEOS as the cross-linking agent because they are eco-friendly and they can not affect the surface stability of the CdTe QDs which was synthesized under alkaline conditions. The molecular structures of the template, APTES and TEOS are shown in Fig. 1.First using molecular dynamics, the molecular structures and the energy of the template 4-NP, APTES and TEOS were optimized before molecular simulation of the prepolymerization, using Material Studio 7.0 Windows (Accelrys Inc., San Diego, CA92121, USA) software in the model with all the optimized systems and the simulation procedures using the COMPASS force field. Then the systems of prepolymerization were built and optimized with the construction order of the amorphous cell. In all optimizations the temperature was kept at 298 K and the density was stipulated at 1.3 g mL−1. The seven group prepolymerization mixtures were optimized with the method as for the molecules. The primary procedures we used were the SMART MINIMIZER in the Discover Tools, the iterations were set at 20000. These seven kinds of prepolymerization systems were built with different mole ratios of the materials as shown in Table 1.
Through the optimized procedure, these mixtures might become unstable. In order to avoid this we finished the molecular dynamics simulation procedures of these prepolymerization systems using SMART MINIMIZER. The simulation procedure not only could ensure the prepolymerization systems to be optimized, but also could make these systems balance relatively in the energy state. In the first place, we used the Dynamics order of the Discover module to adopt the NVT molecular dynamics system, the COMPASS force field in the opened Dynamics taskbar, to make the prepolymerization system balance after 200 ps at 298 K. The VDW and coulombic non-bonding interactions used the atom-based and Ewald methods to calculate sums, respectively. These summation methods were made over 200000 steps. The Radial Distribution Function (RDF) was used to analyze the monomer distribution around the template with the change of the cross-linking.
3.6 Preparation of CdTe@SiO2-MIPs and CdTe@SiO2-NIPs
CdTe@SiO2-MIPs were synthesized by the Stöber method using APTES-MIP-3, APTES-MIP-4, APTES-MIP-6, APTES-MIP-7 mixtures in Table 1. APTES-MIP-6 was synthesized as follows. First 30.0 mg 4-NP was dissolved in 20.0 mL ethanol and 15.0 mL CdTe@SiO2 and 40.0 μL APTES were added to the mixture with vigorous stirring. After 30 min 70.0 μL TEOS as the cross-linking agent was mixed in the solution, and in order to increase the rate of reaction 100.0 μL NH3·H2O (6.25 wt%) was added, then the reaction performed for 8 h at room temperature. Then the product was washed with ethanol several times, the supernatant was discarded, the nanoparticles were centrifuged at 6000 rpm for 10 min, and this repeated several times until the template disappeared (absence of yellow coloration). Then the materials were dried at 35 °C for 24 hours under vacuum for further use.As a comparison, the non-imprinted polymer materials (CdTe@SiO2-NIPs) were synthesized with the same method but in the absence of template molecules.
3.7 FT-IR measurements
The samples which were used were dry and KBr were used as the auxiliary material. The materials measured included CdTe@SiO2, CdTe@SiO2-MIPs, CdTe@SiO2-NIPs and the CdTe@SiO2-MIPs with some template (CdTe@SiO2-4-NP).3.8 Fluorescence detection
All fluorescence detection was carried out under the same condition with an emission wavelength at 365 nm and the examination area was 400–700 nm.10.0 mg of pre-prepared CdTe@SiO2-MIPs, CdTe@SiO2@-NIPs and also CdTe@SiO2-MIPs without washing the template 4-NP were dissolved in 100.0 mL deionized water and then sonicated until the solid disappeared. Then we scanned these substances at room temperature. For 4-NP detection we measured fluorescence at different concentrations (10.0, 20.0, 30.0, 40.0, 50.0, 60.0 μmol L−1) in the presence of 5.0 mg CdTe@SiO2-MIPs in 10.0 mL 4-NP solution with stirring until the nanoparticles dissolved. The fluorescence intensity was then detected.
3.9 Selectivity and recognition
In order to test the selectivity of the CdTe@SiO2-MIPs to 4-NP, we chose 3-NT, 3-NA, phenol and BPA as analogues. To make different concentrations of 4-NP, 3-NT, 3-NA, phenol and BPA solutions, we added the same amount of CdTe@SiO2-MIPs, CdTe@SiO2-NIPs into each solution, and measured the fluorescence, with excitation wavelength at 315 nm. The fluorescence intensity at 605 nm was recorded at room temperature.3.10 Analysis of tap water and lake water
Water samples pretreatment was according to Qiu.34 Typically, lake water was gathered from the Yudai River in Jiangsu University, and tap water was collected from the water in the lab. This experiment adopted the method of standard addition recovery, and prepared 7.5, 25.0, 50.0 μmol L−1 solutions of the template, respectively.4. Conclusions
A novel route to obtain fluorescent molecularly imprinted polymer materials CdTe@SiO2-MIPs, combined with computer simulation, has been presented in this work. First, the fluorescent CdTe QDs were successfully coated with a layer of hybrid SiO2 to increase the stability and FL intensity of hydrosulfuryl modified CdTe QDs. Then by a series of comprehensive molecular dynamics studies, the optimal proportion 8:8:12 of 4-NP, APTES and TEOS was chosen and the result was verified by ultraviolet absorption experiments and TEM studies. The characteristic analysis of CdTe@SiO2-MIPs indicated that the dispersion of CdTe quantum dots in CdTe@SiO2-MIPs showed a good selectivity and sensitivity towards 4-NP.
Acknowledgements
This work was financially supported by the Jiangsu Natural Science Foundation of China (No. BK20141287). This work was partly financially supported by the Senior Talent Foundation of Jiangsu University (No. 14JDG057), Postdoctoral Science Foundation of China (No. 2014M560405, 2015T80515), Postdoctoral Science Foundation of Jiangsu Province (No. 1401012A), Zhenjiang Social Development Fund of Jiangsu Province (No. SH2014020), the Scientific Research Foundation of Jiangsu University (No. 13A581).References
- H. Hmitt, R. Altenburger, B. Jastorff and G. Schuurmann, Chem. Res. Toxicol., 2000, 13, 441 CrossRef PubMed.
- G. Eichenbaum, M. Johnson, D. Kirkland, P. O’Neill, S. Stellar, J. Bielawne, R. deWire, D. Areia, S. Bryant, S. Weiner, D. Desai-Krieger, P. Guzzie-Peck, D. C. Evans and A. Tonelli, Regul. Toxicol. Pharmacol., 2009, 55, 33 CrossRef CAS PubMed.
- W. M. Zhou, D. Q. Fu and Z. G. Sun, Environ. Monit. China, 1990, 6, 1 Search PubMed.
- USEPA (United States Environmental Protection Agency), Health and Ecological Criteria Division, Washington, 1991.
- L. L. Wang, H. Yang, L. Zhang and X. H. Lu, Ind. Water Treat., 2003, 23, 23 CAS.
- J. F. Pang, L. S. Wang, X. N. Fei and J. H. Zhang, Urban Environ. Urban Ecol., 2003, 16, 34 CAS.
- X. C. Zeng and L. X. Li, Environ. Eng., 1990, 8, 1 Search PubMed.
- Q. Huamin, X. Li, L. Li, S. Min and L. Chuannan, Carbohydr. Polym., 2013, 92, 394 CrossRef PubMed.
- Y. F. Du, X. H. Fang and W. J. Sun, J. Anhui Agric. Sci., 2012, 34, 16507 Search PubMed.
- O. Ramström and J. A. Richard, Chirality, 1998, 10, 195 CrossRef.
- Z. Y. Jiang, Y. X. Yu and H. Wu, Membr. Sci. Technol., 2006, 1, 78 Search PubMed.
- L. X. Chen, S. F. Xu and J. H. Li, Chem. Soc. Rev., 2011, 40, 2922 RSC.
- X. L. Qi, Y. Q. Wang, S. Y. Zhang, S. Wei and A. P. Wei, Chem. Res. Appl., 2009, 4, 441 Search PubMed.
- F. Lanza and B. Sellergren, Chromatographia, 2001, 53, 599 CAS.
- P. Spégel, L. Schweitz and S. Nilsson, Anal. Bioanal. Chem., 2002, 372, 37 CrossRef PubMed.
- J. Q. Liu and S. C. Shen, J. Funct. Polym., 1998, 4, 561 Search PubMed.
- K. Haupt and K. Mosbach, Chem. Rev., 2000, 100, 2495 CrossRef CAS PubMed.
- S. Farzaneh, E. Asadi, M. Abdouss, A. Barghi-Lish, S. Azodi-Deilami, H. A. Khonakdar and M. Gharghabi, RSC Adv., 2015, 5, 9154 RSC.
- A. P. M. Tavares, F. T. C. Moreira and M. G. F. Sales, RSC Adv., 2013, 3, 26210 RSC.
- L. Ye and K. Haupt, Anal. Bioanal. Chem., 2004, 378, 1887 CrossRef CAS PubMed.
- P. Manesiotis, A. G. Hall, M. Emgenbroich, M. Quaglia, E. D. Lorenzo and B. Sellergren, Chem. Commun., 2004, 2278 RSC.
- A. J. Hall, P. Manesiotis, M. Emgenbroich, M. Quaglia, E. D. Lorenzi and P. J. Sellergren, J. Org. Chem., 2005, 70, 1732 CrossRef CAS PubMed.
- R. J. Umpleby, M. Bode and K. D. Shimizu, Analyst, 2000, 125, 1261 RSC.
- R. J. Unpleby, G. T. Rushton, R. N. Shah, A. M. Rampey, J. C. Bradshaw, J. K. Berch and K. D. Shimizu, Macromolecules, 2001, 34, 8446 CrossRef.
- L. K. Liu, Y. Cao, P. F. Ma, C. X. Qiu, W. Z. Xu, H. Liu and W. H. Huang, RSC Adv., 2014, 4, 605 RSC.
- M. Bruchez, M. Moronne Jr, P. Gin, S. Weiss and A. P. Alivisatos, Science, 1998, 281, 2013 CrossRef CAS.
- Z. Y. Tang, N. A. Kotov and M. Giersig, Science, 2002, 297, 237 CrossRef CAS PubMed.
- L. Tan, C. C. Kang, S. Y. Xu and Y. W. Tang, Biosens. Bioelectron., 2013, 48, 216 CrossRef CAS PubMed.
- Y. Zhu, Z. Li, M. Chen, H. M. Cooper, G. Q. Lu and Z. P. Xu, J. Colloid Interface Sci., 2013, 390, 3 CrossRef CAS PubMed.
- J. W. Cheng, D. M. Li, T. Cheng, B. Ren, G. Wang and J. Li, J. Alloys Compd., 2014, 589, 539 CrossRef CAS PubMed.
- L. Zhou, C. Gao, X. Z. Hu and W. J. Xu, ACS Appl. Mater. Interfaces, 2010, 2, 1211 CAS.
- X. M. Liu, J. T. Tian, J. H. Dai and X. Wang, Phys. E., 2014, 57, 56 CrossRef CAS PubMed.
- L. Z. Meng, S. L. Gong and Y. B. He, Organic spectroscopic analysis, Wuhan University Press, 1997 Search PubMed.
- C. X. Qiu, Y. H. Xing, W. M. Yang, Z. P. Zhou, Y. C. Wang, H. Liu and W. Z. Xu, Appl. Surf. Sci., 2015, 345, 405 CrossRef CAS PubMed.
- H. F. Wang, Y. He, T. R. Ji and X. P. Yan, Anal. Chem., 2009, 81, 1615 CrossRef CAS PubMed.
- A. Wolcott, D. Gerion, M. Visconte, J. Sun, A. Schwartzberg, S. Chen and J. Z. Zhang, J. Phys. Chem. B, 2006, 110, 5779 CrossRef CAS PubMed.
- T. Nann and P. Mulvaney, Angew. Chem., 2004, 116, 5511 CrossRef PubMed.
- V. Salgueiriño-Maceira, M. A. Correa-Duarte, M. Spasova, L. M. Liz-Marzán and M. Farle, Adv. Funct. Mater., 2006, 16, 509 CrossRef PubMed.
- Y. Chan, J. P. Zimmer, M. Stroh, J. S. Steckel, R. K. Jain and M. G. Bawendi, Adv. Mater., 2004, 16, 2092 CrossRef CAS PubMed.
- Y. Zhu, Z. Li, M. Chen, H. M. Cooper, G. Q. Lu and Z. P. Xu, J. Colloid Interface Sci., 2013, 390, 3 CrossRef CAS PubMed.
- L. Zhou, C. Gao, X. Z. Hu and W. J. Xu, ACS Appl. Mater. Interfaces, 2010, 2, 1211 CAS.
- G. D. Olsson, B. C. G. Karlsson, E. Schillinger, B. Sellergren and I. A. Nicholls, Ind. Eng. Chem. Res., 2013, 52, 13965 CrossRef CAS.
- H. B. Bao, Y. J. Gong, Z. Li and M. Y. Gao, Chem. Mater., 2004, 16, 3853 CrossRef CAS.
Footnote |
| † Electronic supplementary information (ESI) available. See DOI: 10.1039/c5ra06889d |
| This journal is © The Royal Society of Chemistry 2015 |