Synthesis of manganese dioxide/iron oxide/graphene oxide magnetic nanocomposites for hexavalent chromium removal†
Yan
Liu
a,
Chao
Luo
ab,
Guijia
Cui
a and
Shiqiang
Yan
*a
aCollege of Chemistry and Chemical Engineering, Lanzhou University, Lanzhou 730000, PR China. E-mail: yansq@lzu.edu.cn; Fax: +86 931 8912582; Tel: +86 931 8912582
bCNOOC Tianjin Chemical Research & Design Institute, Tianjin 30000, PR China
First published on 15th June 2015
Abstract
Effective removal of heavy metal ions from wastewater is one of the important environment issues. Here, manganese dioxide/iron oxide/graphene-based magnetic nanocomposites (MnO2/Fe3O4/graphene oxide and MnO2/Fe3O4/graphene) were prepared by an easy and effective two-step reaction and investigated for the removal of hexavalent chromium ion from water. The materials were characterized by transmission electron microscopy, Fourier-transform infrared spectroscopy, X-ray diffraction, vibrating sample magnetometry, and Brunauer–Emmett–Teller surface area measurement. MnO2/Fe3O4/graphene oxide (MnO2/Fe3O4/GO) synthesized at pH 5.0 was the most effective adsorption material among other samples synthesized under different conditions. The Langmuir isotherm model was consistent with the experimental data at different pH values. MnO2/Fe3O4/GO showed excellent adsorption capacities both at pH 5.0 (qmax = 175.4 mg g−1) and pH 2.0 (qmax = 193.1 mg g−1). Hexavalent chromium adsorption by MnO2/Fe3O4/GO was pH dependent. The adsorption kinetic data were best described by a pseudo-second-order model. MnO2/Fe3O4/GO was stable and easily recovered. These experimental results suggested that MnO2/Fe3O4/GO had great potential as an economic and efficient adsorbent of heavy metals from wastewater.
1. Introduction
The continuously increasing heavy-metal pollution is gaining considerable attention. Among such metals, chromium is highly toxic to the environment.1,2 Chromium exists in the environment mainly in two states: trivalent chromium (Cr3+) and hexavalent chromium (Cr6+). Cr3+ is an essential element in humans and is much less toxic, whereas Cr6+ is one of the extremely toxic heavy metals found in various industrial waters that can cause health problems, such as liver damage, pulmonary congestion, vomiting, and severe diarrhea.3 Therefore, the amount of chromium in effluents must be reduced to an acceptable level before releasing them into streams and rivers to protect human health and the environment. There are numerous methods in removing Cr6+, such as ion exchange, cyanide treatment, reverse osmosis, electrochemical precipitation, and adsorption.4 Adsorption is one of the most promising technologies because it is cost-effective, has little by product, and is simple to operate.5,6 However, conventional adsorbents, such as biosorbents, activated carbon, and carbon nanotubes, often cause potential secondary pollution under acidic conditions, are not easily separated and are not sufficiently effective. On the other hand, most of the materials used for enhanced hexavalent chromium removal only exhibit high removal efficiency whenever pH is very low.3,7,8 In the application of practical chemical engineering, a strong acidic system is dangerous to equipment, human, and environment. Thus, developing new materials with simple synthesis, easy separation, good stability under acidic conditions, and high adsorption capacity whenever pH is low or high is highly recommended.9As an emerging carbon material with a unique two-dimensional conjugated chemical structure, graphene has attracted a great deal of attention in recent years owing to its better conductivity, more superior chemical stability, and much higher specific surface area10–12 compared with carbon nanotubes, as well as its potential applications in dye sensitized solar cells,13 supercapacitors,14 and catalysts.15 However, the study of graphene-based adsorbent for wastewater treatment is still an emerging field. Unfortunately, graphene is hydrophobic and usually suffers from irreversible agglomeration in water because of the strong van der Waals interactions between neighboring sheets, which significantly reduces the surface area and is consequently not beneficial to the adsorption of contaminants. To prevent the restacking of graphene nanosheets, numerous studies focused on the intercalation of inorganic nanoparticles.10 Graphene oxide (GO) which usually was derived from exfoliation of graphite oxide has abundant functional groups on the surface, such as epoxy, hydroxyl, and carboxyl groups, making it useful for environmental applications. Therefore, features like large surface area and presence of surface functional groups make GO and their composites an attractive adsorbent candidate for water purification.
Recently, our group prepared a manganese dioxide/iron oxide/acid oxidized multi-walled carbon nanotube (MnO2/Fe3O4/o-MWCNTs) magnetic nanocomposite. It exhibited a high Cr6+ removal efficiency whenever pH was lower than 6,16 and the idea of MnO2 and Fe3O4 coated with GO may be utilized in synthesizing new nanocomposite materials which would have better performances in metal ions adsorption applications. The reusability and performance of a material like adsorption capacity, under both acidic and near neutral conditions, can be further enhanced by using a more advanced synthesis method.
In this study, MnO2/Fe3O4/graphene-based magnetic nanocomposites were prepared using a very simple two-step reaction with one main reactant every step. The combination of the advantages of MnO2 and Fe3O4 for the adsorption and magnetic properties of magnetic nanocomposites was developed. Magnetic nanocomposites were characterized using transmission electron microscopy (TEM), Fourier-transform infrared spectroscopy (FTIR) analysis, X-ray diffraction (XRD), Brunauer, Emmett, and Teller surface area measurement (BET) analyses, and vibrating sample magnetometry (VSM). The adsorption capacities of GO, Fe3O4/graphene oxide (Fe3O4/GO), Fe3O4/reduced graphene oxide (Fe3O4/RGO), MnO2/Fe3O4/graphene oxide (MnO2/Fe3O4/GO), and MnO2/Fe3O4/reduced graphene oxide (MnO2/Fe3O4/RGO), which were synthesized under different conditions, were compared to determine the most effective adsorbent material. To evaluate the abovementioned adsorption behaviors further, the adsorption isotherms, solution pH, kinetics, and reusability of the material were examined. The effects of contact time at different temperatures and pH values were also studied to investigate the adsorption capacities of adsorbents at the pH ranging from 2.0 to 5.0.
2. Materials and methods
2.1. Synthesis of graphite oxide (GO)
GO was prepared by modified Hummers method from natural flake graphite.17 Using concentrated H2SO4, H3PO4, and KMnO4 for oxidation, and at the aid of ultrasonication, the graphite layers were exfoliated from each other. Then 30% H2O2 was added to the suspension to eliminate the excess KMnO4. The desired products were rinsed with deionized water.2.2. Synthesis of graphene-based magnetic nanocomposites
Graphene-based magnetic nanocomposites (Fe3O4/reduced graphene oxide and Fe3O4/graphene oxide) were prepared with the use of a easy and an effective one-pot solvothermal method.18 Dispersed in 45 mL of ethylene glycol (EG) were 50 mg of graphite oxide and 500 mg of iron acetylacetonate (Fe(acac)3) that underwent ultrasonication for 30 min, and 30 μL of hydrazine hydrate was slowly added to the mixture while being stirred. Subsequently, the mixture was placed in an autoclave and heated at 180 °C for 16 h. The as-synthesized product was isolated by centrifugation, then washed three times with water and ethanol, and finally dried in a vacuum oven at 60 °C. These materials were denoted as “Fe3O4/RGO”. The synthesis of Fe3O4/graphene oxide nanocomposites (Fe3O4/GO) was carried out in the absence of hydrazine hydrate under the same conditions as the Fe3O4/GO.2.3. Synthesis of manganese dioxide/iron oxide/graphene-based magnetic nanocomposites
MnO2 was coated with Fe3O4/RGO or Fe3O4/GO by simple immersion into a KMnO4 aqueous solution, which is similar with MnO2 coated on carbon nanotubes.19,20 First, 150 mL of 0.1 M KMnO4 solution was heated at 80 °C using a circulator. Then, 0.1 g of Fe3O4/RGO or Fe3O4/GO was added to the solution with different pH values. The pH of the solution was controlled by HCl. During the synthesis, the temperature of the solution was maintained at 80 °C for 3 h using a circulator. The suspension was filtered and washed several times using deionized water and ethanol absolute, and then dried at 60 °C for 12 h. These materials were denoted as “MnO2/Fe3O4/RGO” or “MnO2/Fe3O4/GO”.2.4. Characterization of different materials
The morphology of Fe3O4/GO and MnO2/Fe3O4/GO was examined under transmission electron microscopy (TEM, TecnaiG2F30). The inorganic phases of the graphite, GO, Fe3O4/GO, and MnO2/Fe3O4/GO, were examined using an X-ray diffraction (XRD; XRD-6000, Shimadzu, Japan). The functional groups of GO, Fe3O4/GO, and MnO2/Fe3O4/GO were examined using a NEXUS 670 FTIR spectrometer (Nicolet Instrument Corporation, USA). Magnetic properties were determined by a vibrating sample magnetometry (VSM, LAKESHORE-7304) at room temperature. The BET surface areas were determined using nitrogen adsorption at liquid nitrogen temperatures under the relative pressures P/P0 ranging between 0 and 1 (Sorptomatic 1990, Thermo, USA). The materials were dried fully in a vacuum oven at 60 °C for 12 h to make sure that water contained in the materials was completely removed before measuring the nitrogen adsorption isotherms at 77 K.2.5. Adsorption experiments
Analytical grade potassium dichromate was used to prepare a 1000 mg L−1 stock solution, which was further diluted to the required concentration before use. To determine the adsorption capacities of the different materials, GO, Fe3O4/RGO, Fe3O4/GO, and MnO2/Fe3O4/GO were synthesized at an initial solution pH of 5 (denoted as “MnO2/Fe3O4/GO (pH 5)”), and “MnO2/Fe3O4/RGO” was synthesized at different initial solution pH values (pH 7, 5, and 1) (denoted as “MnO2/Fe3O4/RGO (pH 7)”, “MnO2/Fe3O4/RGO (pH 5)”, and “MnO2/Fe3O4/RGO (pH 1)”, respectively) as adsorbents for Cr6+ removal. The different adsorbents were added to a 100 mL solution with initial Cr6+ concentrations from 50 mg L−1 to 300 mg L−1 (50 mg L−1 intervals) at a pH of about 5.0, and stirred for 120 min at a temperature of 298 K. The two phases were separated by filtration using a 0.45 μm microporous membrane filter. The concentration of Cr6+ was analyzed by spectrophotometric method at a wavelength of 540 nm, using 1,5-diphenylcarbohydrazide as chromogenic reagent and H2SO4 and H3PO4 as buffering agent.16 The most effective material with the maximum adsorption capacity was chosen as the adsorbent in the following experiments and was kept constant. The pH values of 2, 4, and 5 with initial concentrations from 50 mg L−1 to 300 mg L−1 were chosen to evaluate the effect of pH on the Cr6+ adsorption process. Adsorption kinetic data were generated by adding the adsorbent to a 2000 mL solution (pH 2 and 5) with a Cr6+ concentration of 200 mg L−1 at 275 K, 295 K, and 315 K. At predetermined time intervals, samples were collected using a 0.45 μm membrane filter. For the regeneration, after adsorption, desorption was carried out by washing the adsorbents with distilled water several times, and then the Cr6+-adsorbed adsorbent were immersed in 100 mL of 0.1 M NaOH for 120 min. Before the second adsorption, the adsorbent was treated with 0.1 M HCl solution for 120 min. The solid and liquid phases were separated by a magnet. This adsorption–desorption cycle was repeated five times using the same affinity adsorbents.The equilibrium metal adsorption capacity was calculated for each Cr6+ sample using the following expression:
 | (1) |
3. Results and discussion
3.1. Characterization of different materials
The TEM images of Fe3O4/GO and MnO2/Fe3O4/GO nanocomposite samples are shown in Fig. 1. Fig. 1(a) and (b) show the images of the Fe3O4/GO nanoparticles under different magnifications. It can be seen that the 150 nm Fe3O4 nanoparticles were well distributed on graphene oxide sheets, which were nearly flat and had a large area of up to several square micrometers. Some nanoparticles were slightly aggregated due to the loading degree close to saturation. Fig. 1(c) and (d) show the morphology of MnO2/Fe3O4/GO under different magnifications. Fe3O4/GO was fully coated with a lot of very small, uniform, and continuous MnO2, which was like a layer of MnO2, had almost no gaps. These characteristics may be beneficial to the adsorption process.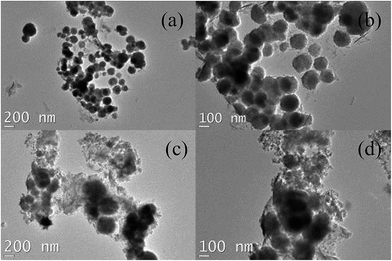 | ||
| Fig. 1 Representative TEM images of Fe3O4/GO and MnO2/Fe3O4/GO under different magnifications: (a and b) Fe3O4/GO, and (c and d) MnO2/Fe3O4/GO. | ||
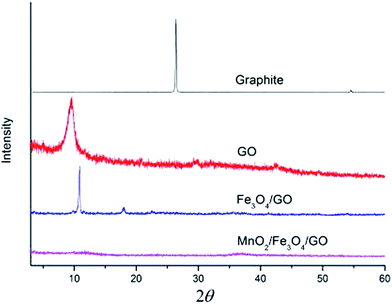
The XRD of the graphite, GO, Fe3O4/GO, and MnO2/Fe3O4/GO, are presented in Fig. 2. The diffraction peak of natural graphite occurred near the 2θ = 26.34° location. It can be seen from the pattern that the peak is sharp and high, which shows high crystallinity and degree of order. In the spectrogram of GO, the diffraction peak (002) of graphite crystal disappeared, indicating that the graphite had been completely oxidized. In its place, the diffraction peak (002) of GO occurred. The characteristic XRD peak of GO appeared at 2θ = 10.54°.21 The XRD of Fe3O4/GO exhibited a new peak at 2θ = 22.53°, which belonged to the Fe3O4 (111),18 and the diffraction peak at 2θ = 10.92° was assigned to the (002) plane of GO. For MnO2/Fe3O4/GO, the diffraction intensity almost disappeared, implying the high oxidation extent of the carbon atoms in the framework by MnO2. It should be noted that the XRD of MnO2/Fe3O4/GO was difficult to identify because of the poor crystallinity of MnO2. The same results were also found in ref. 22, which synthesized graphene nanoplate-MnO2 composites by KMnO4 solution.
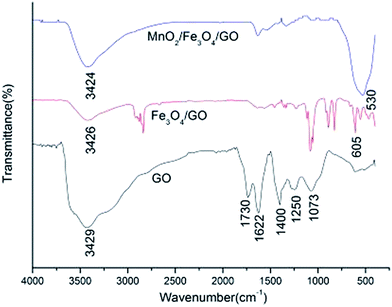
The FTIR spectra of GO, Fe3O4/GO, and MnO2/Fe3O4/GO are shown in Fig. 3. Adsorption peaks appearing at 1622, 1400, 1250, and 1073 cm−1 in the FTIR spectra of pure GO are attributed to aromatic C![[double bond, length as m-dash]](https://www.rsc.org/images/entities/char_e001.gif) C, carboxyl O
C, carboxyl O![[double bond, length as m-dash]](https://www.rsc.org/images/entities/char_e001.gif) C–O, epoxy C–O, and alkoxy C–O stretching vibrations, respectively, whereas the peaks located at 1730 cm−1 and 3429 cm−1 correspond to the C
C–O, epoxy C–O, and alkoxy C–O stretching vibrations, respectively, whereas the peaks located at 1730 cm−1 and 3429 cm−1 correspond to the C![[double bond, length as m-dash]](https://www.rsc.org/images/entities/char_e001.gif) O stretching vibrations of the –COOH groups, and –OH stretching vibration, respectively.9,23 All these bands related with the oxygen-containing functional groups almost remained in the FTIR spectra of Fe3O4/GO and MnO2/Fe3O4/GO. The additional peak at 605 cm−1 in Fig. 3 can be ascribed to the lattice adsorption characteristic of Fe3O4.18 For MnO2/Fe3O4/GO, a broad band was observed in the composite at the low-frequency region, at around 530 cm−1. The presence of this band is attributed to the Mn–O, Mn–O–Mn, and Fe–O–Fe vibrations.16,24
O stretching vibrations of the –COOH groups, and –OH stretching vibration, respectively.9,23 All these bands related with the oxygen-containing functional groups almost remained in the FTIR spectra of Fe3O4/GO and MnO2/Fe3O4/GO. The additional peak at 605 cm−1 in Fig. 3 can be ascribed to the lattice adsorption characteristic of Fe3O4.18 For MnO2/Fe3O4/GO, a broad band was observed in the composite at the low-frequency region, at around 530 cm−1. The presence of this band is attributed to the Mn–O, Mn–O–Mn, and Fe–O–Fe vibrations.16,24
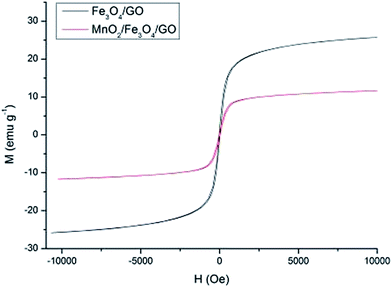
The magnetic properties of the Fe3O4/GO and MnO2/Fe3O4/GO nanocomposites are depicted in Fig. 4. Their saturation magnetization is 26.04 emu g−1 and 11.86 emu g−1, respectively. The saturation magnetization value of MnO2/Fe3O4/GO is 11.86 emu g−1, which is lower than that of the Fe3O4/GO. The decrease in the saturation magnetization can be mainly attributed to the existence of MnO2. However, its maximum saturation magnetization (11.86 emu g−1) is enough to maintain their magnetic recovery performance. Fig. 5 shows that MnO2/Fe3O4/GO is attracted quickly toward an external magnetic field.
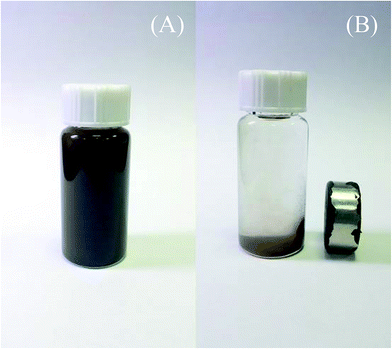 | ||
| Fig. 5 The photograph demonstrates that MnO2/Fe3O4/GO can be dispersed in ethanol (A) and separated from ethanol using a magnet (B). | ||
The surface area, pore volume and pore size of MnO2/Fe3O4/GO (60.1 m2 g−1, 0.18 cm3 g−1 and 12.2 nm) are evidently much lower than those of Fe3O4/GO (119.5 m2 g−1, 0.41 cm3 g−1 and 13.2 nm). Compared with the unsupported single Fe3O4 and MnO2 particles, the larger surface areas of MnO2/Fe3O4/GO nanocomposites are due to the large surface area of GO.25,26 The formation of MnO2 blocks the pore entrances, thereby decreasing the surface area. Nevertheless, MnO2 introduced on the surface of Fe3O4/GO provides numerous sorption sites, thereby increasing the sorption capacities of MnO2/Fe3O4/GO. It is well known that the adsorption properties not only depend on the high specific surface area of the adsorbent, but also depend on the pore properties of the adsorbent. Generally speaking, the higher surface area and pore size are, the higher the adsorption capacity is. However, the adsorption capacities of different materials mainly depend on the amount and kinds of functional groups on the adsorbent surface. In this work, MnO2/Fe3O4/GO is the most effective removal materials compared with the others materials because MnO2/Fe3O4/GO provides more binding sites. Therefore, the adsorption capacities of different materials not only depend on the surface area and pore properties, but also depend on the functional groups on the adsorbent surface.
3.2. Adsorption capacity of different materials
The preparation of MnO2/Fe3O4/RGO or MnO2/Fe3O4/GO nanocomposites was carried out by a very simple two-step reaction, with one main reactant every step (Fe(acac)3, step one; KMnO4, step two). This simple method provides a good technique in the preparation of MnO2/Fe3O4/RGO or MnO2/Fe3O4/GO. It should be pointed out that the initial solution pH is evidently important during the synthesis process. In this study, the weight of MnO2/Fe3O4/RGO or MnO2/Fe3O4/GO increased as the initial synthesis solution pH decreased, and the color of MnO2/Fe3O4/RGO or MnO2/Fe3O4/GO became deeper as the initial synthesis solution pH decreased (Fig. S2†). The color of the solution after the reaction became shallower as the initial synthesis solution pH decreased, as shown in Fig. S3.† It means that the loading level of MnO2 on Fe3O4/RGO or Fe3O4/GO was affected by the initial synthesis solution pH and this result is identical with the previously presented result, wherein MnO2 coated on carbon nanotubes was also affected by the initial synthesis solution pH.27MnO2 was coated on Fe3O4/GO or Fe3O4/RGO through a direct redox reaction between the GO or RGO and MnO4−:19
| MnO4− + 4H+ + 3e− → MnO2 + 2H2O | (2) |
Another self-limiting reaction of aqueous permanganate with graphene that enabled deposition of birnessite-type MnO2 in between the graphene sheets must have occurred. The reaction between carbon and KMnO4 can be described as follows:28
| 4MnO4− + 3C + H2O ⇔ 4MnO2 + CO32− + 2HCO3− | (3) |
The organic functional groups on GO can improve the adsorption capacity of the adsorbent. In this study, the organic functional groups on GO also influenced the synthesis process; the Mn7+ ions in the solution were adsorbed onto the surface of GO by carboxyl groups through electrostatic attraction, and these ions are in situ deoxidized to MnO2. The reaction can be written as follows:29
| 4MnO4− + 4H+ → 4MnO2 + 2H2O + 3O2↑ | (4) |
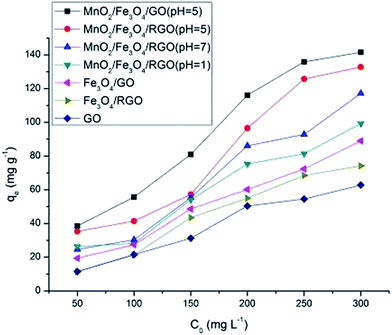
The adsorption capacities of different materials were investigated, and the results are presented in Fig. 6. The adsorption capacity of Fe3O4/GO or Fe3O4/RGO and MnO2/Fe3O4/RGO or MnO2/Fe3O4/GO were much higher than that of GO because the MnO2 and Fe3O4 were good adsorbents for Cr6+.16,30 The adsorption capacity of Fe3O4/GO was higher than Fe3O4/RGO, and MnO2/Fe3O4/GO (pH 5) was higher than MnO2/Fe3O4/RGO (pH 5), suggesting that organic functional groups on GO, such as hydroxyl, carboxyl, and carbonyl groups, were expected to be the active centers for Cr6+.9 The low loading level of MnO2 (at an initial synthesis solution pH 7.0) led to the worsening of the adsorption capacities of MnO2/Fe3O4/RGO compared with those at pH 5.0. However, the excess MnO2 load hindered the adsorption of organic functional groups, GO and Fe3O4, by effectively decreasing the volume; this is the reason why the adsorption capacity of MnO2/Fe3O4/RGO (pH 5) was greater than MnO2/Fe3O4/RGO (pH 1). Therefore, the adsorption capacities of different materials mainly depend on the functional groups and loading level of MnO2 on the adsorbent surface. In this study, the most effective removal of Cr6+ occurred with MnO2/Fe3O4/GO at an initial synthesis solution of pH 5.0.
In this work, a very important adsorption group is MnO2 because the adsorption capacity of MnO2/Fe3O4/GO is much better than that of Fe3O4/GO. The surface groups of MnO2 are amphoteric and can function as an acid or a base. The oxide surface can undergo protonation and deprotonation in response to changes in solution pH. When the solution pH is low, MnO2 would be protonated to form ![[triple bond, length as m-dash]](https://www.rsc.org/images/entities/char_e002.gif) MnOH. Given that Cr6+ mainly exists in the form of negatively charged HCrO4− in the acidic solution, it could be adsorbed by positively charged MnO2/Fe3O4/GO through electrostatic attraction. Meanwhile, the positively charged MnO2 possibly involves an exchange reaction of Cr3+ (Cr6+) with
MnOH. Given that Cr6+ mainly exists in the form of negatively charged HCrO4− in the acidic solution, it could be adsorbed by positively charged MnO2/Fe3O4/GO through electrostatic attraction. Meanwhile, the positively charged MnO2 possibly involves an exchange reaction of Cr3+ (Cr6+) with ![[triple bond, length as m-dash]](https://www.rsc.org/images/entities/char_e002.gif) MnOH, and the lone pair electrons of manganese oxide may induce surface complexation reactions with Cr3+ (Cr6+).
MnOH, and the lone pair electrons of manganese oxide may induce surface complexation reactions with Cr3+ (Cr6+).
3.3. Adsorption isotherms
Batch equilibrium adsorption experiments were used for adsorption assessment through plots of adsorption isotherms. The maximum adsorption capacity can be obtained from adsorption isotherms. The Langmuir and Freundlich isotherms are the most common isotherms used to describe solid–liquid adsorption.31Langmuir adsorption isotherms have been successfully applied to many other real adsorption processes. A basic assumption of Langmuir theory is that adsorption takes place at specific homogeneous sites within the adsorbent. It is assumed that once a molecule occupies a site, no further adsorption can occur at that site. Theoretically, a saturation value is reached and no further sorption can occur. A linear form of this expression is:32
 | (5) |
The efficiency of the adsorption can be expressed by the dimensionless equilibrium parameter RL, which is defined as follows:33,34
 | (6) |
The values of RL indicate the isotherm shapes, which can be unfavorable (RL ≥ 1) or favorable (0 ≤ RL ≤ 1).35
The Freundlich isotherm assumes that adsorption occurs on heterogeneous surfaces by multilayer adsorption, and the amount of adsorbate adsorbed increases infinitely with an increasing concentration, which is expressed as follows:36
 | (7) |
The results of adsorption isotherms are listed in Table 1. The RL values have been found to be in the 0 to 1 range (Fig. S5†), which indicates the suitability of MnO2/Fe3O4/GO as Cr6+ adsorbents. The adsorption data could be described well by the Langmuir model rather than Freundlich model, suggesting that the energies of the active sites on the surface of MnO2/Fe3O4/GO are similar, where no interaction has been observed between the adsorbed molecules and the surface of MnO2/Fe3O4/GO. It can be seen from the values of qm (mg g−1) in Table 1, that the maximum Cr6+ adsorption capacity increased from 175.4 mg g−1 to 193.1 mg g−1 as the pH decreased from 5.0 to 2.0. This phenomenon will be further discussed in Section 3.4. The qm value of Cr6+ adsorption onto MnO2/Fe3O4/GO in pH 5.0 is 175.4 mg g−1, which is close to the qm value of Cr6+ adsorption onto MnO2/Fe3O4/GO at pH 2.0 (193.1 mg g−1), and this maximum adsorption capacity is higher than many adsorbents. The most important result is that MnO2/Fe3O4/GO has an excellent adsorption capacity at the pH ranging from 2.0 to 5.0, which is significant in the application of practical chemical engineering.
| pH | Langmuir isotherm | Freundlich isotherm | |||||
|---|---|---|---|---|---|---|---|
| q m (mg g−1) | b | r 1 2 | R L | 1/n | K F | r 2 2 | |
| 5.0 | 175.4 | 0.0102 | 0.993 | 0.247–0.663 | 0.499 | 8.398 | 0.930 |
| 4.0 | 177.1 | 0.0128 | 0.988 | 0.206–0.609 | 0.384 | 16.401 | 0.913 |
| 2.0 | 193.1 | 0.0127 | 0.989 | 0.208–0.612 | 0.394 | 16.817 | 0.908 |
3.4. Effect of solution pH on the adsorption
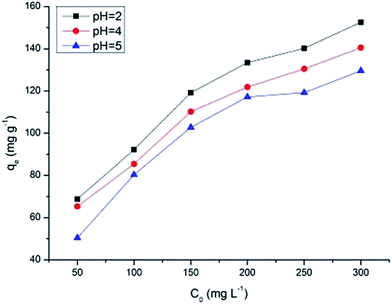
The solution pH has been identified as the most important variable governing metal adsorption onto the adsorbent. To investigate the adsorption capacity of MnO2/Fe3O4/GO under both acidic and near neutral conditions, pH values of 2.0, 4.0, and 5.0 at initial concentrations from 50 mg L−1 to 300 mg L−1 were chosen to evaluate the effect of pH on the Cr6+ adsorption process.Fig. 7 shows that the Cr6+ adsorption capacity increases as the pH increased from 2.0 to 5.0. At a lower pH, the adsorption effect is high because predominant Cr6+ species mainly exists in monovalent HCrO4− form, which is then gradually converted to divalent CrO42− and Cr2O72− as pH increases. The adsorption free energy of HCrO4− is lower than that of CrO42− and Cr2O72−; and consequently, HCrO4− is more favorably adsorbed than CrO42− and Cr2O72− at the same concentration.37 As the pH increases, the MnO2/Fe3O4/GO surface becomes increasingly deprotonated so that the amount of positive surface charges is significantly decreased, leading to a reduction in the adsorption capacity of Cr6+. Thus, the adsorption quantities of Cr6+ at a lower pH are larger than that of at higher pH.
However, the Cr6+ adsorption capacity of MnO2/Fe3O4/GO at pH 5.0 is close to the Cr6+ adsorption capacity of MnO2/Fe3O4/GO at pH 2.0 and pH 4.0. Compared with the Cr6+ adsorption capacity of MnO2/Fe3O4/GO at pH 2.0, the Cr6+ adsorption capacity of MnO2/Fe3O4/GO at pH 5.0 still possessed more than 85% of the adsorption capacities. It should be pointed out that the pH values of the Cr6+ solution with the initial concentrations from 50 mg L−1 to 300 mg L−1 were about 5.0 ± 0.2 without any added acid or alkali. It means that MnO2/Fe3O4/GO has a high adsorption capacity at the pH ranging from 2.0 to 5.0. It is known that Cr6+ is reduced to Cr3+ in the acidic medium, and the reaction is shown as follows:37
| HCrO4− + 7H+ + 3e− ↔ Cr3+ + 4H2O | (8) |
| Cr2O72− + 6e− + 3H+ ↔ 2Cr3+ + 7H2O | (9) |
The reason why many adsorbents have high adsorption capacities for Cr6+ is that these reactions3,8 often occur at a low pH, and rarely occur when pH is higher than 3.0, leading to a decreased adsorption capacity of adsorbents. We measured the total Cr concentration in a solution and found that Cr3+ exists at pH 2.0, and the amounts of total Cr and Cr6+ concentration at pH 5.0 are more or less the same, which may indicate that the reduction of Cr6+ to Cr3+ ions occur rarely at a higher pH. This finding explains why the MnO2/Fe3O4/GO has a higher adsorption capacity in the acidic medium. These results are similar with the previous studies.37,38
3.5. Adsorption kinetics
Adsorption kinetics, demonstrating the solute uptake rate, is one of the most important factors which represent the adsorption efficiency of the MnO2/Fe3O4/GO and therefore, determines their potential applications. The effect of the contact time of MnO2/Fe3O4/GO on the adsorption capacity of Cr6+ at different temperatures with pH 5.0 and 2.0 is shown in Fig. 8. Increasing the contact time obviously increases the Cr6+ adsorption. At pH 5.0, the equilibrium capacity is 108.4 mg g−1 at 275 K, 111.5 mg g−1 at 295 K, and 122.4 mg g−1 at 315 K, and at pH 2.0, the equilibrium capacity is 131.2 mg g−1 at 275 K, 135.7 mg g−1 at 295 K, and 144.8 mg g−1 at 315 K. As shown in Fig. 8, the results indicate that the equilibrium time exhibited differences as the temperature increased from 275 K to 315 K, and the pH decreased from 5.0 to 2.0. At pH 5.0, the adsorption equilibrium in 275 K was observed at 120 min, however, the adsorption in 295 K and 315 K almost reached the equilibrium at 90 min. At pH 2.0, the equilibrium of the adsorption process in 275 K, 295 K, and 315 K were all observed at 90 min. The contact was set to 120 min in each experiment to ensure that each adsorption process reached equilibrium. The adsorption process was faster at a lower pH, possibly because more HCrO4− exists in a solution at pH 2.0, and the adsorption free energy of HCrO4− is more favorably adsorbed than CrO42− and Cr2O72− at the same concentration (Section 3.4), leading to the adsorption reaching equilibrium faster at pH 2.0. The adsorbent showed a good performance in adsorption during the 120 min. Quantifying the changes in adsorption with time requires an appropriate kinetic model. The pseudo-first-order equation, the second-order rate equation, and the pseudo-second-order rate equation, are expressed as follows:39–41 | (10) |
 | (11) |
 | (12) |
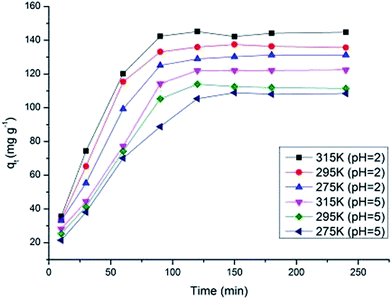 | ||
| Fig. 8 Effect of contact time on chromium ions adsorbed onto MnO2/Fe3O4/GO at different temperatures and pH values. | ||
The straight line plots of log(qe − qt) versus t are 1/(qe − qt) versus t and t/qtversus t for the three kinetic models. The pseudo-second-order rate constants were used to calculate the initial adsorption rate h (mg g−1 min−1) as follows:39
| h = k3qe2 | (13) |
The kinetic parameters and correlation coefficients of Cr6+ at different temperatures (pH 5.0 and 2.0, respectively) are presented in Table 2. The qe is the theoretical value, which is calculated using the kinetic models. From the value of r3 (pseudo-second-order kinetic model), the experimental data fitted the pseudo-second-order kinetic model (≥0.981) better than the pseudo-first-order kinetic model and second-order rate kinetic model. The qe calculated from the pseudo-second-order kinetic model increased correspondingly with the temperature and pH (pH 5.0: 143.4 mg g−1 at 275 K, 144.1 mg g−1 at 295 K, 157.7 mg g−1 at 315 K; pH 2.0: 158.0 mg g−1 at 275 K, 159.2 mg g−1 at 295 K, 167.5 mg g−1 at 315 K). The qe calculated from the pseudo-first-order kinetic model and second-order rate kinetic model were much higher or much lower than the experimental qe,exp values, and the adsorption capacities calculated from the pseudo-first-order kinetic model and second-order rate kinetic model did not always increase with increasing temperature and decreasing pH, which were different from the experimental data. These results indicate that the adsorption process could be optimized under the pseudo-second-order kinetic model. The initial adsorption rate increased correspondingly with the temperature and pH within a given adsorption system because of the higher temperature and lower pH, which were beneficial to the initial adsorption process. The adsorbent system can be well described by the pseudo-second-order kinetic model, suggesting that the adsorption may be the rate-limiting step involving valence forces through the sharing or exchange of electrons between the adsorbent and adsorbate.9
| pH | T (K) | q e,exp | Pseudo-first-order kinetic model | Second-order kinetic model | ||||
|---|---|---|---|---|---|---|---|---|
| k 1 | q e | r 1 | k 2 (×10−3) | q e | r 2 | |||
| 5.0 | 275 | 108.4 | 0.0202 | 65.2 | 0.843 | 8.81 | 2.4 | 0.918 |
| 295 | 111.5 | 0.0251 | 131.2 | 0.975 | 2.86 | 22.5 | 0.737 | |
| 315 | 122.4 | 0.0445 | 285.1 | 0.933 | 3.84 | 0.7 | 0.889 | |
| 2.0 | 275 | 131.2 | 0.0353 | 182.3 | 0.989 | 6.45 | 4.6 | 0.860 |
| 295 | 135.7 | 0.0244 | 97.1 | 0.949 | 3.67 | 30.5 | 0.783 | |
| 315 | 144.8 | 0.0194 | 98.7 | 0.901 | 9.32 | 2.4 | 0.847 | |
| pH | T (K) | Pseudo-second-order kinetic model | |||
|---|---|---|---|---|---|
| k 3 (×10−4) | q e | h | r 3 | ||
| 5.0 | 275 | 1.148 | 143.4 | 2.363 | 0.983 |
| 295 | 1.357 | 144.1 | 2.777 | 0.982 | |
| 315 | 1.173 | 157.7 | 2.918 | 0.981 | |
| 2.0 | 275 | 1.706 | 158.0 | 4.258 | 0.991 |
| 295 | 2.119 | 159.2 | 5.373 | 0.986 | |
| 315 | 2.128 | 167.5 | 5.971 | 0.993 | |
3.6. Regeneration of saturated adsorbents
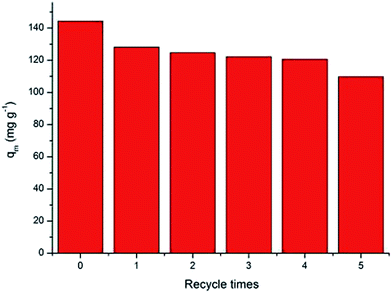
For practical application, recycling and regeneration of the adsorbent is indispensable because the better repeated availability of advanced adsorbents may reduce the overall cost of the adsorbent. Given that the adsorption of Cr6+ ions on the MnO2/Fe3O4/GO is pH-dependent, and that the lower pH is beneficial for the Cr6+ adsorption, the desorption of Cr6+ ions from the adsorbent can be achieved by increasing the system pH values. Therefore, for the reusability study, experiments were conducted at an alkaline condition.42 It can be seen that the MnO2/Fe3O4/GO still possessed more than 84% of the adsorption capacities for Cr6+ after four cycles of reuse, which slightly decreased to 76% at the fifth cycle, reflecting the high adsorption and stability of MnO2/Fe3O4/GO (Fig. 9).3.7. Comparison of adsorbent performance with literature data
The qmax values of the MnO2/Fe3O4/GO were compared with the Cr6+ adsorption capacities reported in the literature for other adsorption (Table 3). MnO2/Fe3O4/GO has an excellent maximum adsorption capacity among all the absorbents, not only at pH 2.0 but also at pH 5.0. The chromium removal capacities of other adsorbents at pH 1.0 or 2.0, such as cetyltrimethylammonium bromide modified graphene, sawdust, activated carbon modified with nitric acid, activated carbon derived from rubber wood saw dust, Fe3O4/polypyrrole composite, graphene/MgAl-layered double hydroxides nanocomposite, and MnO2/Fe3O4/carbon nanotubes were lower than that of MnO2/Fe3O4/GO at pH 2.0,10,16,38,42–44 suggesting that MnO2/Fe3O4/GO has an excellent maximum adsorption capacity in a strong acidic system. It should be pointed that the maximum adsorption capacity of MnO2/Fe3O4/GO at pH 5.0 is still higher than the maximum adsorption capacity of most Cr6+ absorbents at pH 1.0, 2.0, and 5.0. It means that the MnO2/Fe3O4/GO has an excellent adsorption capacity at the pH ranging from 2.0 to 5.0, and it is significant in the application of practical chemical engineering because a strong acidic system is dangerous for equipment, human and environment. Thus, the comparison suggests that MnO2/Fe3O4/GO has a great potential as heavy metal ion adsorbent in wastewater treatment.| Adsorbates | Adsorbents | q max (mg g−1) | pH | Reference |
|---|---|---|---|---|
| Cr6+ | Cetyltrimethylammonium bromide modified graphene | 21.6 | 2.0 | 40 |
| Sawdust | 41.5 | 1.0 | 35 | |
| Activated carbon modified with nitric acid | 16.1 | 2.0 | 41 | |
| Activated carbon derived from rubber wood saw dust | 65.0 | 2.0 | ||
| Activated carbon derived from acrylonitrile–divinylbenzene | 101.2 | 2.0 | ||
| Fe3O4/polypyrrole composite | 91.6 | 2.0 | 39 | |
| Graphene/MgAl-layered double hydroxides nanocomposite | 172.6 | 2.0 | 8 | |
| MnO2/Fe3O4/carbon nanotubes | 186.9 | 2.0 | 14 | |
| Polyacrylonitrile/FeCl2 composite | 11.7 | 5.0 | 39 | |
| Wood sawdust coated by polypyrrole | 1.3 | 5.0 | ||
| MnO2/Fe3O4/GO | 175.4 | 5.0 | Present work | |
| MnO2/Fe3O4/GO | 193.1 | 2.0 | Present work |
4. Conclusions
Manganese dioxide/iron oxide/graphene oxide magnetic nanocomposites (MnO2/Fe3O4/GO) was successfully prepared by a straightforward method. The MnO2/Fe3O4/GO, which was synthesized at pH 2.0, was the most effective material for removing Cr6+ ions compared with other materials. This adsorbent has a unique property that combined the high adsorption capacity of MnO2, the high surface area of GO, and magnetic features of Fe3O4. As far as we know, this study is the first to use MnO2/Fe3O4/GO as an adsorbent for chromium removal. The initial solution pH has an apparent effect on the adsorption capacity, which increased as the pH decreased. The kinetic data of the adsorption fitted well with the pseudo-second-order kinetic model. The maximum adsorption capacity calculated from the Langmuir isotherm model of the MnO2/Fe3O4/GO was 193.1 mg g−1 at pH 2.0 and 175.4 mg g−1 at pH 5.0. This finding indicated that MnO2/Fe3O4/GO had excellent maximum adsorption capacity under acidic and near neutral conditions. Desorption results showed that the adsorption capacity can remain up to 76% after five times of usage. Therefore, MnO2/Fe3O4/GO nanocomposite was a promising adsorbent for hexavalent chromium and had great potential as an economical and efficient adsorbent of heavy metal from wastewater.References
- Y. Sun, Q. Yue, Y. Mao, B. Gao, Y. Gao and L. Huang, J. Hazard. Mater., 2014, 265, 191–200 CrossRef CAS PubMed.
- K. K. Krishnani, S. Srinives, B. C. Mohapatraa, V. M. Boddu, J. Haof, X. Mengf and A. Mulchandani, J. Hazard. Mater., 2013, 252–253, 99–106 CrossRef CAS PubMed.
- J. Hu, C. Chen, X. Zhu and X. Wang, J. Hazard. Mater., 2009, 162, 1542–1550 CrossRef CAS PubMed.
- A. B. Albadarin, C. Mangwandia, A. a. H. Al-Muhtaseb, G. M. Walkera, S. J. Allen and M. N. M. Ahmad, Chem. Eng. J., 2012, 179, 193–202 CrossRef CAS.
- Y. Liu, C. Luo, J. Sun, H. Li, Z. Sun and S. Yan, J. Mater. Chem. A, 2015, 3, 5674–5682 CAS.
- Y. Liu, G. Cui, C. Luo, L. Zhang, Y. Guo and S. Yan, RSC Adv., 2014, 4, 55162–55172 RSC.
- E. Malkoc, Y. Nuhoglu and M. Dundar, J. Hazard. Mater., 2006, 138, 142–151 CrossRef CAS PubMed.
- X.-j. Hu, J.-s. Wang, Y.-g. Liu, X. Li, G.-m. Zeng, Z.-l. Bao, X.-x. Zeng, A.-w. Chen and F. Long, J. Hazard. Mater., 2011, 185, 306–314 CrossRef CAS PubMed.
- L. Fan, C. Luo, M. Sun and H. Qiu, J. Mater. Chem., 2012, 22, 24577–24583 RSC.
- X. Yuan, Y. Wang, J. Wang, C. Zhou, Q. Tang and X. Rao, Chem. Eng. J., 2013, 221, 204–213 CrossRef CAS.
- C. Houa, Q. Zhang, Y. Li and H. Wang, J. Hazard. Mater., 2012, 205–206, 229–235 CrossRef PubMed.
- A. Dimiev, D. V. Kosynkin, A. Sinitskii, A. Slesarev, Z. Sun and J. M. Tour, Science, 2011, 331, 1168–1172 CrossRef CAS PubMed.
- H.-K. Seo, M. Song, S. Ameen, M. S. Akhtar and H. S. Shin, Chem. Eng. J., 2013, 222, 464–471 CrossRef CAS.
- J. Li, H. Xie and Y. Li, J. Power Sources, 2013, 241, 388–395 CrossRef CAS.
- S. Li, S. Guo, H. Yang, G. Gou, R. Ren, J. Li, Z. Dong, J. Jin and J. Ma, J. Hazard. Mater., 2014, 270, 11–17 CrossRef CAS PubMed.
- C. Luo, Z. Tian, B. Yang, L. Zhang and S. Yan, Chem. Eng. J., 2013, 234, 256–265 CrossRef CAS.
- D. C. Marcano, D. V. Kosynkin, J. M. Berlin, A. Sinitskii, Z. Sun, A. Slesarev, L. B. Alemany, W. Lu and J. M. Tour, ACS Nano, 2010, 4, 4806–4814 CrossRef CAS PubMed.
- X. Shen, J. Wu, S. Bai and H. Zhou, J. Alloys Compd., 2010, 506, 136–140 CrossRef CAS.
- S. B. Ma, K. Y. Ahn, E. S. Lee, K. H. Oh and K. B. Kim, Carbon, 2007, 45, 375–382 CrossRef CAS.
- J. Wei, Y. Liu, Y. Ding, C. Luo, X. Du and J. Lin, Chem. Commun., 2014, 50, 11938–11941 RSC.
- N. A. Travlou, G. Z. Kyzas, N. K. Lazaridis and E. A. Deliyanni, Chem. Eng. J., 2013, 217, 256–265 CrossRef CAS.
- H. Huang and X. Wang, Nanoscale, 2011, 3, 3185–3191 RSC.
- R. D. Martínez-Orozcoa, H. C. Rosu, S.-W. Lee and V. Rodríguez-González, J. Hazard. Mater., 2013, 263, 52–60 CrossRef PubMed.
- B. Yang, Q. Gong, L. Zhao, H. Sun, N. Ren, J. Qin, J. Xu and H. Yang, Desalination, 2011, 278, 65–69 CrossRef CAS.
- X. Luo, C. Wang, S. Luo, R. Dong, X. Tu and G. Zeng, Chem. Eng. J., 2012, 187, 45–52 CrossRef CAS.
- P. I. Girginova, A. L. Daniel-da-Silva, C. B. Lopes, P. Figueira, M. Otero, V. S. Amaral, E. Pereira and T. Trindade, J. Colloid Interface Sci., 2010, 345, 234–240 CrossRef CAS PubMed.
- C. Luo, R. Wei, D. Guo, S. Zhang and S. Yan, Chem. Eng. J., 2013, 225, 406–415 CrossRef CAS.
- Z. Fan, J. Yan, T. Wei, L. Zhi, G. Ning, T. Li and F. Wei, Adv. Funct. Mater., 2011, 21, 2366–2375 CrossRef CAS.
- X. Huang, C. Pan and X. Huang, Mater. Lett., 2007, 61, 934–936 CrossRef CAS.
- S. R. Chowdhury, E. K. Yanful and A. R. Pratt, J. Hazard. Mater., 2012, 235–236, 246–256 CrossRef CAS PubMed.
- A. Mittal, L. Kurup and J. Mittal, J. Hazard. Mater., 2007, 146, 243–248 CrossRef CAS PubMed.
- Y. Yu, J. G. Shapter, R. Popelka-Filcoff, J. W. Bennett and A. V. Ellis, J. Hazard. Mater., 2014, 273, 174–182 CrossRef CAS PubMed.
- D. Suna, X. Zhang, Y. Wu and X. Liu, J. Hazard. Mater., 2010, 181, 335–342 CrossRef PubMed.
- N. Azouaoua, Z. Sadaoui, A. Djaafri and H. Mokaddem, J. Hazard. Mater., 2010, 184, 126–134 CrossRef PubMed.
- L. Zhang, T. Xu, X. Liu, Y. Zhang and H. Jin, J. Hazard. Mater., 2011, 197, 389–396 CrossRef CAS PubMed.
- S. Zhang, C. Liu, Z. Luan, X. Peng, H. Ren and J. Wang, J. Hazard. Mater., 2008, 152, 486–492 CrossRef CAS PubMed.
- S. Chen, Q. Yue, B. Gao and X. Xu, J. Colloid Interface Sci., 2010, 349, 256–264 CrossRef CAS PubMed.
- S. Gupta and B. V. Babu, Chem. Eng. J., 2009, 150, 352–365 CrossRef CAS.
- Y.-S. Ho, J. Hazard. Mater., 2006, 136, 681–689 CrossRef CAS PubMed.
- Y. S. Ho and G. McKay, Chem. Eng. J., 1998, 70, 115–124 CrossRef CAS.
- Q. Wen, Z. Chen, J. Lian, Y. Feng and N. Ren, J. Hazard. Mater., 2012, 209–210, 226–232 CrossRef CAS PubMed.
- X. Feng, Z. Yan, N. Chen, Y. Zhang, Y. Ma, X. Liu, Q. Fan, L. Wang and W. Huang, J. Mater. Chem. A, 2013, 1, 12818–12825 CAS.
- Y. Wu, H. Luo, H. Wang, C. Wang, J. Zhang and Z. Zhang, J. Colloid Interface Sci., 2013, 394, 183–191 CrossRef CAS PubMed.
- G. Huang, J. X. Shi and T. A. G. Langrish, Chem. Eng. J., 2009, 152, 434–439 CrossRef CAS.
Footnote |
| † Electronic supplementary information (ESI) available. See DOI: 10.1039/c5ra06455d |
| This journal is © The Royal Society of Chemistry 2015 |

