DOI:
10.1039/C5RA06452J
(Paper)
RSC Adv., 2015,
5, 45258-45265
Enantiomeric 3-arylcoumarins and 2-arylcoumarones from the roots of Glycyrrhiza uralensis as protein tyrosine phosphatase 1B (PTP1B) inhibitors†
Received
10th April 2015
, Accepted 12th May 2015
First published on 12th May 2015
Abstract
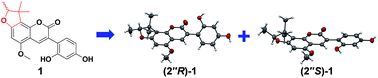
Glycyfuranocoumarin A–C (1–3), three 3-arylcoumarins, and glycyfuranocoumarone A (4), one 2-arylcoumarone, were isolated in the racemic form from the roots of Glycyrrhiza uralensis. Their structures were elucidated by NMR, 2D NMR and HRESIMS data analyses. All the structures contain a 2,3-dihydro-2,3,3-trimethylbenzofuran ring. Chiral HPLC was used to obtain the optically pure enantiomers, (2′′R)-1 and (2′′S)-1. Their absolute configurations were determined by X-ray crystallography. This is the first unambiguous determination of the absolute configuration of 2,3-dihydro-2,3,3-trimethylbenzofurans. (2′′R)-1 and (2′′S)-1, as well as 2–4, exhibited significant inhibitory activities against protein tyrosine phosphatase 1B (PTP1B). Among them, 4 showed an IC50 of 2.2 μM.
Introduction
Diabetes mellitus is a major metabolic syndrome affecting human health. It could lead to a series of complications like blindness, renal diseases, and cardiovascular diseases.1 Protein tyrosine phosphatase 1B (PTP1B) plays a critical role in the negative regulation of insulin and leptin signaling pathways.2,3 Thus, PTP1B inhibition has been considered as a potential therapeutic approach against type 2 diabetes.4 Although a number of PTP1B inhibitors have been reported, the majority of them suffer from poor pharmacokinetic properties and low enzyme selectivity. Therefore, to discover new potent PTP1B inhibitors is still of great significance.5
Glycyrrhiza uralensis Fisch. is the major source for licorice (Gan-Cao in Chinese), one of the most popular herbal medicines worldwide. It is recorded in the pharmacopoeia of China, Japan, Europe, and the United States.6,7 G. uralensis has been reported to exhibit significant anti-diabetic activities, and flavonoids and coumarins are considered be the major bioactive constituents.8–11 In this work, we report four new PTP1B inhibitors isolated from G. uralensis, namely glycyfuranocoumarin A–C (1–3) and glycyfuranocoumarone A (4). Furthermore, the racemic mixture of 1 was separated by chiral HPLC, and the absolute configurations of the 2,3-dihydro-2,3,3-trimethylbenzofuran ring for the enantiomers were established by X-ray crystallography. The cytotoxic activities of 1–4 against human cancer cell lines (SW480, HepG2, and A549) were also evaluated.
Results and discussion
The dried roots of Glycyrrhiza uralensis (35 kg) were extracted with 95% and 70% EtOH, and the combined extract was successively extracted with EtOAc and n-BuOH. The EtOAc extract was separated by silica gel, ODS C18, Sephadex LH-20 and semi-preparative RP-HPLC to afford glycyfuranocoumarin A–C (1–3) and glycyfuranocoumarone A (4) (Fig. 1). Their structures were identified on the basis of extensive NMR and MS data analyses.
 |
| Fig. 1 Structures of 1, (2′′R)-1, (2′′S)-1 and 2–4. | |
The molecular formula of compound 1 was established as C21H20O6 by its HRESIMS spectrum ([M − H]− m/z 367.1166, calcd for C21H19O6, 367.1176). The UV spectrum with maximal absorptions at 267 nm and 359 nm was typical for a 3-arylcoumarin skeleton,12 and the 1H NMR spectrum (Table 1) showed a characteristic singlet at δH 7.86 (1H, s) corresponding to H-4.12 The remaining proton signals indicated the presence of an aromatic ABX system [δH 7.05 (1H, d, J = 8.4 Hz), 6.25 (1H, dd, J = 2.0, 8.4 Hz) and 6.35 (1H, d, J = 2.0 Hz)], an aromatic singlet at δH 6.49 (1H, s), a methoxyl group at δH 3.85 (3H, s), two phenolic hydroxyl groups at δH 9.37 (1H, s) and 9.33 (1H, s), and a 2,3-dihydro-2,3,3-trimethylbenzofuran ring [δH 1.21 (3H, s), 1.47 (3H, s), 1.35 (3H, d, J = 6.8 Hz) and 4.52 (1H, q, J = 6.8 Hz)].13 The 13C NMR spectrum of 1 exhibited 21 carbon signals corresponding to five aromatic methines at δC 136.6, 131.4, 106.2, 102.6 and 90.5, nine aromatic quaternary carbons at δC 162.0, 158.3, 156.8, 155.9, 150.7, 119.1, 113.6, 113.3 and 103.6, a lactone carbonyl group at δC 159.6, a methoxyl group at δC 56.4, and the 2,3-dihydro-2,3,3-trimethylbenzofuran ring [δC 21.1 (CH3), 25.3 (CH3), 14.1 (CH3), 90.0 (CH) and 43.2 (C)].
Table 1 1H (400 MHz) and 13C (100 MHz) NMR data for 1–4 in DMSO-d6
C |
1 |
2 |
3a |
4 |
δC, type |
δH (J in Hz) |
δC, type |
δH (J in Hz) |
δC, type |
δH (J in Hz) |
δC, type |
δH (J in Hz) |
Data were recorded at 600 MHz for 1H NMR and 150 MHz for 13C NMR. The assignments are interchangeable. |
2 |
159.6, C |
|
159.6, C |
|
159.3, C |
|
150.2, C |
|
3 |
119.1, C |
|
119.2, C |
|
101.2, C |
|
100.1, CH |
7.03, s |
4 |
136.6, CH |
7.86, s |
136.6, CH |
7.86, s |
157.1, C |
|
152.3, C |
|
5 |
156.8, C |
|
156.8, C |
|
156.9, C |
|
89.1, CH |
6.31, s |
6 |
90.5, CH |
6.49, s |
90.5, CH |
6.50, s |
91.4, CH |
6.67, s |
156.7, C |
|
7 |
162.0, C |
|
162.0, C |
|
162.3, C |
|
110.8, C |
|
8 |
113.3, C |
|
113.3, C |
|
114.6, C |
|
149.1, C |
|
9 |
150.7, C |
|
150.5, C |
|
150.5, C |
|
113.4, C |
|
10 |
103.6, C |
|
103.7, C |
|
96.9, C |
|
|
|
1′ |
113.6, C |
|
113.6, C |
|
114.0, C |
|
109.0, C |
|
2′ |
155.9, C |
|
156.0, C |
|
155.7, C |
|
155.4, C |
|
3′ |
102.6, CH |
6.35, d (2.0) |
102.7, CH |
6.35, d (2.4) |
98.5, CH |
7.12, d (2.4) |
102.9, CH |
6.45, d (2.0) |
4′ |
158.3, C |
|
158.3, C |
|
156.8, C |
|
158.1, C |
|
5′ |
106.2, CH |
6.25, dd (2.0, 8.4) |
106.2, CH |
6.25, dd (2.4, 8.4) |
114.2, CH |
6.94, dd (2.4, 8.4) |
107.1, CH |
6.37, dd (2.0, 8.4) |
6′ |
131.4, CH |
7.05, d (8.4) |
131.4, CH |
7.05, d (8.4) |
120.3, CH |
7.70, d (8.4) |
126.4, CH |
7.58, d (8.4) |
2′′ |
90.0, CH |
4.52, q (6.8) |
93.9, CH |
4.39, dd (4.8, 6.8) |
90.2, CH |
4.57, q (6.6) |
89.0, CH |
4.45, q (6.8) |
3′′ |
43.2, C |
|
42.7, C |
|
43.7, C |
|
43.1, C |
|
4′′ |
14.1, CH3 |
1.35, d (6.8) |
59.6, CH2 |
3.75, m |
14.1, CH3 |
1.37, d (6.6) |
14.2, CH3 |
1.34, d (6.8) |
b5′′ |
25.3, CH3 |
1.21, s |
26.5, CH3 |
1.29, s |
25.2, CH3 |
1.23, s |
25.8, CH3 |
1.21, s |
b6′′ |
21.1, CH3 |
1.47, s |
20.8, CH3 |
1.54, s |
21.0, CH3 |
1.51, s |
21.7, CH3 |
1.51, s |
OCH3 |
56.4, CH3 |
3.85, s |
56.4, CH3 |
3.86, s |
56.8, CH3 |
3.98, s |
55.6, CH3 |
3.82, s |
OH |
|
9.37, s |
|
9.39, br s |
|
9.99, s |
|
10.51, br s |
|
9.33, s |
|
9.39, br s |
|
|
|
9.54, br s |
|
|
|
4.99, br s |
|
|
|
|
The aromatic ABX system was assigned to ring B due to the HMBC correlation between H-6′ (δH 7.05) and C-3 (δC 119.1) (Fig. 2). The two hydroxyl groups at C-2′ and C-4′ were determined by the HMBC correlations of 2′-OH (δH 9.33)/C-1′ (δC 113.6), C-2′ (δC 155.9), C-3′ (δC 102.6), and 4′-OH (δH 9.37)/C-3′, C-4′ (δC 158.3), C-5′ (δC 106.2), respectively. The HMBC correlations of H-5′′ (δH 1.21), H-6′′ (δH 1.47)/C-8 (δC 113.3), H-2′′ (δH 4.52)/C-7 (δC 162.0), and H-4 (δH 7.86), H-6 (δH 6.49)/C-5 (δC 156.8) indicated that the 2,3-dihydro-2,3,3-trimethylfuran ring was connected to C-7 and C-8 of the 3-arylcoumarin skeleton. Location of the methoxyl group was determined by its HMBC correlation with C-5 (δC 156.8). Thus, the planar structure of 1 was established as shown in Fig. 1, and was named as glycyfuranocoumarin A.
 |
| Fig. 2 Key HMBC and NOE correlations for 1 and 4. | |
Initially, we intended to determine the absolute configuration of the 2,3-dihydro-2,3,3-trimethylfuran ring in 1 by comparing the experimental and calculated electronic circular dichroism (ECD) spectra.14 The calculated ECD spectra of (2′′R)-1 and (2′′S)-1 were obtained by time-dependent density functional theory (TDDFT) at the B3LYP/6-31G* level in the MeCN solution with the IEFPCM model.15 They showed remarkably opposite Cotton effects. However, the experimental ECD spectrum of 1 showed a nearly straight line, which indicated that 1 might be a raceme (Fig. 3). After repeated attempts, we obtained its single crystals from the MeOH–H2O (80
:
20, v/v) solution. The X-ray diffraction experiment (Cu Kα) confirmed that 1 was a raceme with the co-crystallization of (2′′R)-1 and (2′′S)-1 (Fig. 4).
 |
| Fig. 3 Comparison of the calculated ECD spectra for (2′′R)-1 and (2′′S)-1 with the experimental ECD spectra for racemic 1, (2′′R)-1 and (2′′S)-1. | |
 |
| Fig. 4 X-ray structures of racemic 1, (2′′R)-1 and (2′′S)-1. | |
In order to obtain the optically pure enantiomers, we initially tried to separate the racemic 1 by analytical supercritical fluid chromatography (SFC), which was a rapid and efficient approach for chiral resolution.16 As expected (Fig. 5), (2′′R)-1 and (2′′S)-1 could be separated on a Chiralcel IC-3 column (2.1 × 150 mm, 3 μm, Daicel) eluted with 25–30% MeOH (0–10 min) in CO2 at 2 mL min−1. However, the low resolution made it difficult to obtain the pure enantiomers. We further tested chiral HPLC,17 and found that the normal-phase Chiralcel OZ-H column (4.6 × 250 mm, 5 μm, Daicel) could efficiently separate (2′′R)-1 (tR = 12.9 min) and (2′′S)-1 (tR = 9.2 min), eluted with n-hexane-isopropanol (75
:
25, v/v) at 1 mL min−1 (Fig. 6). Therefore, a 14 min analytical-scale method was established to obtain 2.5 mg of (2′′R)-1 and 4.5 mg of (2′′S)-1. They showed opposite optical activities of [α]25D +0.3 (c 0.01, MeOH) and [α]25D −0.4 (c 0.01, MeOH), respectively. To fully establish the absolute configuration of the two enantiomers, we obtained their respective single crystals from MeOH–H2O solution (80
:
20 for (2′′R)-1, and 90
:
10 for (2′′S)-1, v/v) through a series of attempts. The X-ray diffraction experiments (Cu Kα) unambiguously determined the stereochemistry of (2′′R)-1 and (2′′S)-1 (Fig. 4). On the other hand, we also recorded their ECD spectra separately. As shown in Fig. 3, the calculated ECD spectra for (2′′R)-1 and (2′′S)-1 agreed well with their respective experimental spectra. This result indicated that ECD calculations could be an efficient approach to establish the absolute configuration of the 2,3-dihydro-2,3,3-trimethylbenzofuran ring.
 |
| Fig. 5 Chiral separation of racemic 1–4 by SFC. | |
 |
| Fig. 6 Chiral separation of racemic 1 and purity analysis of (2′′R)-1 and (2′′S)-1 by normal-phase HPLC. | |
The molecular formula of compound 2 was determined to be C21H20O7 on the basis of its HRESIMS spectrum ([M − H]− m/z 383.1123, calcd for C21H19O7, 383.1125). Its 1D and 2D NMR spectra were very similar to those of 1, and the main differences were in the 2,3-dihydro-2,3,3-trimethylbenzofuran ring. The methyl group for C-4′′ (δC 14.1) of 1 disappeared, and an oxygenated methylene at δC 59.6 appeared in 2. In accordance, the signal for H-4′′ shifted downfield from δH 1.35 (3H, d, J = 6.8 Hz) in 1 to δH 3.75 (2H, m) in 2. Furthermore, a hydroxyl group at δH 4.99 (1H, br s) appeared in the 1H NMR spectrum of 2. These signals indicated that the methyl group in 1 was replaced by a hydroxymethyl group in 2, which was confirmed by the HMBC correlations of H-4′′ (δH 3.75)/C-2′′ (δC 93.9) and C-3′′ (δC 42.7). Therefore, the planar structure of 2 was identified as shown in Fig. 1, and was named as glycyfuranocoumarin B.
Compound 3 exhibited a pseudomolecular ion in the HRESIMS spectrum at m/z 365.1009 ([M − H]−, calcd for C21H17O6, 365.1019), corresponding to the molecular formula of C21H18O6, two fewer protons than 1. The 1D and 2D NMR spectra of 3 were also very similar to those of 1, and the main differences were in C-4. The olefinic carbon for C-4 (δC 136.6) in 1 disappeared, and an oxygenated olefinic carbon at δC 157.1 appeared in 3. In accordance, the H-4 signal at δH 7.86 for 1 also disappeared. These evidences indicated that a hydroxyl group was introduced to C-4 in 3. However, the molecular formula of 3 was calculated to be C21H20O7, which had one more molecule of H2O than the measured result (C21H18O6). By careful analysis, we observed only one hydroxyl group (δH 9.99) in the 1H NMR spectrum of 3, one fewer than that of 1. Based on the above evidences, it could be deduced that 4-OH and 2′-OH formed an ether linkage. Thus, the planar structure of 3 was identified as shown in Fig. 1, and was named as glycyfuranocoumarin C.
Compound 4 had a molecular formula of C20H20O5 according to its HRESIMS spectrum ([M − H]− m/z 339.1217, calcd for C20H19O5, 339.1227). Its UV spectrum showed maximum absorptions at 252 nm and 321 nm, corresponding to a 2-arylcoumarone skeleton. The 1H NMR spectrum showed a characteristic singlet at δH 7.03 (1H, s) corresponding to H-3.18 The remaining proton signals included an aromatic ABX system [δH 7.58 (1H, d, J = 8.4 Hz), 6.37 (1H, dd, J = 2.0, 8.4 Hz) and 6.45 (1H, d, J = 2.0 Hz)], a single aromatic proton at δH 6.31 (1H, s), a methoxyl group at δH 3.82 (3H, s), two phenolic hydroxyl groups at δH 10.15 (1H, br s) and 9.54 (1H, br s), and a 2,3-dihydro-2,3,3-trimethylbenzofuran ring [δH 1.21 (3H, s), 1.51 (3H, s), 1.34 (3H, d, J = 6.8 Hz) and 4.45 (1H, q, J = 6.8 Hz)]. The 1,2,4-substituted aromatic ABX system was determined to be at ring C because of the HMBC correlations of H-6′ (δH 7.58)/C-2 (δC 150.2), C-2′ (δC 155.4), C-4′ (δC 158.1) and H-5′ (δH 6.37)/C-1′ (δC 109.0), C-3′ (δC 102.9). The methoxyl group was connected to C-4 (δC 152.3), as evidenced by its HMBC correlation with C-4 and the HMBC correlation of H-3 (δH 7.03)/C-4. The single aromatic proton at δH 6.31 (1H, s) was assigned to H-5 based on its HMBC correlations with C-4 (δC 152.3), C-6 (δC 156.7), C-7 (δC 110.8) and C-9 (δC 113.4), which was confirmed by the NOE enhancement between H-5 (δH 6.31) and 4-OCH3 (δH 3.82) (Fig. 2). In addition, the HMBC correlations of H-5′′ (δH 1.21), H-6′′ (δH 1.51)/C-7 (δC 110.8), as well as H-2′′ (δH 4.45)/C-6 (δC 156.7), C-7 (δC 110.8) indicated that the 2,3-dihydro-2,3,3-trimethylbenzofuran ring was connected to C-6 and C-7 of the 2-arylcoumarone skeleton. These deductions established the planar structure of 4 as shown in Fig. 1. It was named as glycyfuranocoumarone A.
Because of the weak optical activities of compound 2 ([α]25D −0.004 (c 0.01, MeOH)), 3 ([α]25D −0.002 (c −0.01, MeOH)) and 4 ([α]25D +0.001 (c 0.01, MeOH)), as well as the common 2,3-dihydro-2,3,3-trimethylbenzofuran ring, we speculated that all of them were racemes. This was confirmed by SFC analyses. Through a series of attempts, the three pairs of enantiomers were successfully separated on different chiral columns within 20 min at different conditions (Fig. 5). Regretfully, it was difficult to prepare the optically pure enantiomers of 2–4 due to their very limited amounts.
To the best of our knowledge, only a few natural compounds with a 2,3-dihydro-2,3,3-trimethylbenzofuran ring have been reported, thus far.12,19 Moreover, the absolute configuration for the dihydrofuran ring has never been established. Enantiomers (2′′R)-1 and (2′′S)-1 represented the first pure optical forms of the 2,3-dihydro-2,3,3-trimethylbenzofuran ring with unambiguously established absolute configuration. They showed opposite optical activities and ECD spectra, which could be used to rapidly and efficiently determine the absolute configuration of similar compounds with a 2,3-dihydro-2,3,3-trimethylbenzofuran ring. According to the HPLC chromatograms shown in Fig. 5, the R/S ratio for all the four pairs of enantiomers was approximately 1
:
1. This result suggested the 2,3-dihydro-2,3,3-trimethylbenzofuran ring may occur in the form of raceme in the nature. On the other hand, compound 4 obtained in this study was the first 2-arylcoumarone skeleton with the 2,3-dihydro-2,3,3-trimethylbenzofuran ring.
The inhibitory activities of (2′′R)-1, (2′′S)-1 and 2–4 against protein tyrosine phosphatase 1B (PTP1B) were evaluated using p-nitrophenyl phosphate (pNPP) as the substrate according to previously described methods.3,4 The known PTP1B inhibitor, ursolic acid (IC50 = 6.2 μM), was used as the positive control.20 As shown in Table 2, (2′′R)-1, (2′′S)-1, 2 and 3 exhibited noticeable PTP1B inhibition with IC50 values ranging from 10.3 to 13.6 μM. Compound 4 showed significant inhibition with IC50 values of 2.2 μM, which was more potent than the positive control. In addition, (2′′R)-1 and (2′′S)-1 showed similar inhibitory activities with IC50 values of 12.1 μM and 13.6 μM, respectively, suggesting that the absolute configuration of C-2′′ hardly affected the inhibitory activity.
Table 2 PTP1B inhibitory and cytotoxicity data (IC50 values, μM) for (2′′R)-1, (2′′S)-1 and racemic 2–4
Compounds |
PTP1B |
SW480 |
HepG2 |
A549 |
Positive control. N.A., not available. |
(2′′R)-1 |
12.1 |
11.6 |
23.8 |
40.0 |
(2′′S)-1 |
13.6 |
>40 |
>40 |
>40 |
2 |
10.3 |
>40 |
>40 |
>40 |
3 |
13.5 |
>40 |
>40 |
>40 |
4 |
2.2 |
4.4 |
6.7 |
13.7 |
aUrsolic acid |
6.2 |
N.A. |
N.A. |
N.A. |
The cytotoxicities of these five compounds against three human cancer cell lines, namely human colorectal adenocarcinoma cell line (SW480), human hepatocellular liver carcinoma cell line (HepG2) and human alveolar adenocarcinoma cell line (A549) were also evaluated. As the same as PTP1B inhibitory activity, compound 4 showed the most potent cytotoxic activity with the IC50 values of 4.4 μM (SW480), 6.7 μM (HepG2) and 13.7 μM (A549). Interestingly, (2′′R)-1 exhibited remarkably higher cytotoxic activities than (2′′S)-1 (Table 2). For example, (2′′R)-1 could inhibit SW480 cell viability with an IC50 value of 11.6 μM, whereas (2′′S)-1 only showed an IC50 value of above 40 μM (Fig. S1†). Similarly, (2′′R)-1 exhibited stronger cytotoxic activities than (2′′S)-1 for HepG2 and A549 cells (Fig. S2 and S3†).
Conclusions
In conclusion, three 3-arylcoumarins (1–3) and one 2-arylcoumarone (4) were isolated from the roots of Glycyrrhiza uralensis in the racemic form. Their structures were elucidated by extensive spectroscopic analysis, and all of them contain a 2,3-dihydro-2,3,3-trimethylbenzofuran ring. Compound 1 was separated by chiral HPLC to yield (2′′R)-1 and (2′′S)-1, whose absolute configuration was unambiguously established by X-ray crystallography and ECD spectra. This is the first unambiguous determination of the absolute configuration of 2,3-dihydro-2,3,3-trimethylbenzofurans. All of (2′′R)-1, (2′′S)-1 and racemic 2–4 exhibited good inhibitory activities against PTP1B, especially 4 (IC50 = 2.2 μM). Interestingly, (2′′R)-1 showed remarkably higher cytotoxic activities than (2′′S)-1 against human cancer cell lines (SW480, HepG2, and A549).
Experimental section
General experimental procedures
Optical rotations were measured on a Rudolph Research Autopol III automatic polarimeter. IR spectra were recorded as KBr disks on a Nicolet NEXUS-470 FT-IR spectrometer. UV spectra were measured on a Cary 300 Bio UV-visible spectrophotometer. NMR spectra were recorded at 400 MHz for 1H and 100 MHz for 13C on a Bruker AVANCE III-400 spectrometer in DMSO-d6 with TMS as the reference. ECD spectra were recorded on a JASCO J-810 CD spectrometer. HRESIMS data were performed on a Bruker APEX IV FT-MS spectrometer. TLC was carried out on precoated silica gel GF254 plates (Qingdao Marine Chemical Inc., China). Spots were visualized under UV light (365 nm). Open column chromatography was performed using silica gel (200–300 mesh, Qingdao Marine Chemical Inc., China), ODS C18 (DAISO Company, Japan), and Sephadex LH-20 (GE Healthcare Bio-Science AB, USA). Semi-preparative HPLC was performed on an Agilent 1200 instrument equipped with a ZORBAX SB C18 column (250 mm × 9.4 mm, i.d. 5 μm, Agilent, USA). Chiral HPLC was performed on a Shimadzu LC-20A instrument equipped with a normal-phase Chiralcel OZ-H column (4.6 × 250 mm, i.d. 5 μm, Daicel Industries, Japan.)
Plant materials
Dried roots of G. uralensis Fisch. were collected in September 2012 in Chifeng City, Inner Mongolia Autonomous Region, China. The plant was identified by the authors. A voucher specimen (no. GC-201209) was deposited at the School of Pharmaceutical Sciences, Peking University, Beijing, China.
Extraction and isolation
The dried material (35 kg) was powdered and extracted with 95% (90 L × 2 h × 2) and 70% EtOH (90 L × 2 h × 1) under reflux. After concentration in vacuo, the extract (10 L) was dispersed in H2O and successively extracted with EtOAc and n-BuOH. The EtOAc extract (1280 g) was chromatographed over silica gel using petroleum ether–EtOAc (1
:
0 to 1
:
1, v/v) as the eluent to produce fractions A–H. Fraction E was chromatographed over silica gel using CHCl3–MeOH (1
:
0 to 2
:
1, v/v) as the eluent to produce fractions EA–EG. Fraction EC was further purified over Sephadex LH-20 (MeOH) and semi-preparative HPLC (75% MeCN–H2O) to yield compound 1 (9.5 mg). Compound 1 was separated into (2′′R)-1 (2.5 mg) and (2′′S)-1 (4.5 mg) by chiral HPLC with n-hexane–isopropanol (75
:
25, v/v, 1 mL min−1) as the eluent. Fraction EF was fractionated by silica gel eluted with CHCl3–MeOH (1
:
0 to 2
:
1, v/v), followed by Sephadex LH-20 (MeOH) and semi-preparative HPLC (79% MeCN–H2O) to yield 3 (2.1 mg) and 4 (1.9 mg). Fraction D were fractionated by an ODS C18 column eluted with MeOH–H2O (50–90%, v/v) to obtain fraction DB, which was further purified over semi-preparative HPLC (71% MeCN–H2O) to yield compound 2 (3.2 mg).
Glycyfuranocoumarin A (1). Pale yellow lamellar crystals (MeOH–H2O, 80
:
20, v/v); UV (MeOH) λmax (log
ε) 266 (3.78), 362 (4.54) nm; IR vmax = 2989, 1765, 1599, 1456, 1377, 1243, 1056 cm−1; for 1H and 13C NMR data, see Table 1; HRESIMS m/z 367.1166 [M − H]−, calcd for C21H19O6, 367.1176.
(2′′R)-1. Pale yellow lamellar crystals (MeOH–H2O, 80
:
20, v/v); mp 295–298 °C; [α]25D +0.3 (c 0.01, MeOH); ECD (MeCN) λmax (Δε) 200 (+8.96), 260 (+2.72) nm.
(2′′S)-1. Pale yellow lamellar crystals (MeOH–H2O, 90
:
10, v/v); mp 294–297 °C; [α]25D −0.4 (c 0.01, MeOH); ECD (MeCN) λmax (Δε) 212 (−7.39), 274 (−1.16) nm.
Crystal data for racemic 1. C21H20O6, M = 368.37, orthorhombic, a = 9.33933(18) Å, b = 19.7504(4) Å, c = 9.61969(17) Å, V = 1774.40(6) Å3, T = 180.01(10) K, space group P212121 (no. 19), Z = 4, μ(Cu Kα) = 0.840 mm−1, 29
236 reflections measured, 3570 unique (Rint = 0.0456) which were used in all calculations. The final wR2 was 0.1025 (all data). Flack parameter = 0.10 (6).
Crystal data for (2′′R)-1. C21H20O6, M = 368.37, orthorhombic, a = 9.3372(5) Å, b = 9.6286(3) Å, c = 19.5494(6) Å, U = 1757.57(12) Å3, T = 104.3, space group P212121 (no. 19), Z = 4, μ(Cu Kα) = 0.848, 5776 reflections measured, 3325 unique (Rint = 0.0209) which were used in all calculations. The final wR(F2) was 0.0879 (all data). Flack parameter = −0.03 (16).
Crystal data for (2′′S)-1. C21H20O6, M = 368.37, orthorhombic, a = 9.3355(3) Å, b = 9.6307(3) Å, c = 19.5386(3) Å, U = 1756.67(9) Å3, T = 100.8, space group P212121 (no. 19), Z = 4, μ(Cu Kα) = 0.848, 5784 reflections measured, 3321 unique (Rint = 0.0280) which were used in all calculations. The final wR(F2) was 0.0908 (all data). Flack parameter = −0.04 (16).†
Glycyfuranocoumarin B (2). Pale yellow powder; [α]25D −0.004 (c 0.01, MeOH); UV (MeOH) λmax (log
ε) 267 (3.89), 362 (4.21) nm; IR vmax = 3403, 2926, 1695, 1601, 1472, 1452, 1296, 1106 cm−1; for 1H and 13C NMR data, see Table 1; HRESIMS m/z 383.1123 [M − H]−, calcd for C21H19O7, 383.1125.
Glycyfuranocoumarin C (3). Pale yellow powder; [α]25D −0.002 (c 0.01, MeOH); UV (MeOH) λmax (log
ε) 252 (2.68), 347 (4.76) nm; IR vmax = 3433, 2923, 1703, 1616, 1439, 1376, 1162, 1084 cm−1; for 1H and 13C NMR data, see Table 1; HRESIMS m/z 365.1009 [M − H]−, calcd for C21H17O6, 365.1019.
Glycyfuranocoumarone A (4). Pale yellow powder; [α]25D +0.001 (c 0.01, MeOH); UV (MeOH) λmax (log
ε) 251 (2.41), 321 (3.68) nm; IR vmax = 3365, 2988, 1765, 1623, 1377, 1243, 1053 cm−1; for 1H and 13C NMR data, see Table 1; HRESIMS m/z 339.1217 [M − H]−, calcd for C20H19O5, 339.1227.
Analytical supercritical fluid chromatography (SFC)
SFC analysis was performed on an Agilent 1260 Infinity analytical SFC system consisting of an SFC Fusion™A5 module, a modified 1260 Infinity LC system, a degasser, an SFC binary pump, an SFC autosampler, a thermostated column compartment, and a diode array detector with a high pressure SFC flow cell. The following analytical columns were used: Chiralcel OJ-H (4.6 × 250 mm, 5 μm, Daicel Industries, Tokyo, Japan), Chiralpak IC-3 (2.1 × 150 mm, 3 μm, Daicel) and Chiralpak AD-H (4.6 × 250 mm, 5 μm, Daicel). The back pressure was maintained at 120 bar, and the column temperature was 40 °C. An aliquot of 5 μL sample was injected for analysis. Compound 1 was separated on Chiralpak IC-3 (0–10 min, 25–30% MeOH in CO2, v/v, 2 mL min−1). Compounds 2 and 3 were separated on Chiralcel OJ-H (0–15 min, 5–15%; 15–20 min, 15–20% MeOH in CO2, v/v, 3 mL min−1). Compound 4 was separated on Chiralpak AD-H (0–20 min, 10–30% MeOH in CO2, v/v, 2 mL min−1). Data were processed by Openlab CDS Chemstation C.01.03 software.
ECD calculations
A preliminary conformational search was performed in SYBYL-X 1.1 using the random search method with the MMFF94 force field.15 The conformers were successively optimized using the semi-empirical method at the AM1 level and the density functional theory (DFT) method at the B3LYP/6-31G* level. The stable conformers with populations greater than 1% and without imaginary frequencies were submitted to ECD calculation by the TDDFT [B3LYP/6-31G*] method. Considering solvent effects on the calculated ECD spectra, we took the IEFPCM model in MeCN. ECD spectra of different conformers were simulated using SpecDis with a half bandwidth of 0.4 eV.21 The final ECD spectra were generated according to the Boltzmann-calculated distribution of each conformer. The calculated ECD spectra were compared with the experimental data. All the calculations have been performed with the Gaussian 09 program package.22
Inhibitory effects of protein tyrosine phosphatase 1B (PTP1B)
The ability of all the isolated compounds to inhibit protein tyrosine phosphatase 1B (PTP1B) was studied by a previously described method.3,4 Recombinant human PTP1B was purchased from Sigma-Aldrich (MO, USA). For the inhibition assay, compounds at different concentrations (1 μL in DMSO) were added to a reaction mixture containing PTP1B enzyme (0.1 μg), 99 μL of reaction buffer [50 mM HEPES (pH 7.2), 1 mM EDTA and 5 mM dithiothreitol (DTT)] and 100 μL of 4 mM p-nitrophenyl phosphate (pNPP). The reaction mixture (200 μL) was incubated at 37 °C for 30 min and then quenched by adding 10 μL of 10 N NaOH. The hydrolysis of pNPP was determined by measuring the absorbance at 405 nm. The non-enzymatic hydrolysis of 2 mM pNPP was corrected by measuring the increase in absorbance at 405 nm obtained in the absence of PTP1B enzyme. Ursolic acid was used as the positive control. All the experiments were performed in three independent replicates.
Cytotoxic activity evaluation
The cytotoxicities of all the isolated compounds against human colorectal adenocarcinoma cell line (SW480), human hepatocellular liver carcinoma cell line (HepG2) and human alveolar adenocarcinoma cell line (A549) were determined using the MTS assay. Briefly, SW480 cells were cultured at 37 °C in a humidified 5% CO2 atmosphere in RPMI1640 medium (HepG2 cells in MEM medium and A549 in DMEM medium) supplemented with 10% fetal bovine serum and 1× penicillin–streptomycin solution. The cells were seeded at 5 × 10³ cells per well in 96-well plates and cultured overnight. Compounds at different concentrations were then added into the culture, and incubated for further 24 h. Cell viability was measured by MTS assay following the manufacturer's protocol (Promega, Madison, WI, USA). All the experiments were performed in three independent replicates.
Acknowledgements
This work was supported by National Natural Science Foundation of China (no. 81173644, no. 81222054), the Program for New Century Excellent Talents in University from Chinese Ministry of Education (no. NCET-11-0019), and the State Key Laboratory of Drug Research. We wish to thank Analytical Center of Beijing University of Chemical Technology for the kind help with crystal structure analysis. We also thank Dr Bing Yang (Daicel Beijing Office) for his technical help to purify the enantiomers, and Dr Rong An, Lang Li and Ying Meng (Agilent Technologies) for their technical help in SFC analyses.
References
-
(a) P. Zhang, X. Zhang, J. Brown, D. Vistisen, R. Sicree, J. Shaw and G. Nichols, Diabetes Res. Clin. Pract., 2010, 87, 293–301 CrossRef PubMed;
(b) K. Nicholas, FEBS Lett., 2003, 546, 140–148 CrossRef.
- T. O. Johnson, J. Ermolieff and M. R. Jirousek, Nat. Rev. Drug Discovery, 2002, 1, 696–709 CrossRef CAS PubMed.
- M. Elchebly, Science, 1999, 283, 1544–1548 CrossRef CAS.
- S. Zhang and Z. Y. Zhang, Drug Discovery Today, 2007, 12, 373–381 CrossRef CAS PubMed.
- A. P. Combs, J. Med. Chem., 2010, 53, 2333–2344 CrossRef CAS PubMed.
- Commission of Flora of China, Flora of China, Chinese Science Press, Beijing, 1998, vol. 42, p. 168 Search PubMed.
- Q. Y. Zhang and M. Ye, J. Chromatogr. A, 2009, 1216, 1954–1969 CrossRef CAS PubMed.
- R. Gaur, K. S. Yadav, R. K. Verma, N. P. Yadav and R. S. Bhakuni, Phytomedicine, 2014, 21, 415–422 CrossRef CAS PubMed.
- L. Feng, M. Zhu, M. Zhang, R. Wang, X. Tan, J. Song, S. Ding, X. Jia and S. Hu, J. Ethnopharmacol., 2013, 148, 27–36 CrossRef CAS PubMed.
- W. Li, S. Li, K. Higai, T. Sasaki, Y. Asada, S. Ohshima and K. Koike, Bioorg. Med. Chem. Lett., 2013, 23, 5836–5839 CrossRef CAS PubMed.
- G. Yoon, W. Lee, S. N. Kim and S. H. Cheon, Bioorg. Med. Chem. Lett., 2009, 19, 5155–5157 CrossRef CAS PubMed.
-
(a) J. Li, L. Pan, Y. Deng, U. Munoz-Acuna, C. Yuan, H. Lai, H. Chai, T. E. Chagwedera, N. R. Farnsworth, E. J. C. Blanco, C. Li, D. D. Soejarto and A. D. Kinghorn, J. Org. Chem., 2013, 78, 10166–10177 CrossRef CAS PubMed;
(b) X. Qiao, C. F. Liu, S. Ji, X. H. Lin, D. A. Guo and M. Ye, Planta Med., 2014, 80, 237–242 CrossRef CAS PubMed.
- M. M. Rahman, S. D. Sarker, M. Byres and A. I. Gray, J. Nat. Prod., 2004, 67, 402–406 CrossRef CAS PubMed.
-
(a) X. Lin, S. Ji, X. Qiao, H. Hu, N. Chen, Y. Dong, Y. Huang, D. Guo, P. Tu and M. Ye, J. Org. Chem., 2013, 78, 11835–11848 CrossRef CAS PubMed;
(b) A. León, J. A. Cogordán, O. Sterner and G. Delgado, J. Nat. Prod., 2012, 75, 859–864 CrossRef PubMed.
- Sybyl Software, version X 1.1, Tripos Associates Inc., St. Louis, MO, 2010 Search PubMed.
- X. Qiao, R. An, Y. Huang, S. Ji, L. Li, Y. Tzeng, D. A. Guo and M. Ye, J. Chromatogr. A, 2014, 1358, 252–260 CrossRef CAS PubMed.
-
(a) Y. Shi, Y. Liu, Y. Li, L. Li, J. Qu, S. Ma and S. Yu, Org. Lett., 2014, 16, 5406–5409 CrossRef CAS PubMed;
(b) J. F. Xu, H. J. Zhao, X. B. Wang, Z. R. Li, J. Luo, M. H. Yang, L. Yang, W. Y. Yu, H. Q. Yao, J. G. Luo and L. Y. Kong, Org. Lett., 2014, 17, 146–149 CrossRef PubMed.
- T. Fukai, Q. H. Wang, T. Kitagawa, K. Kusano, T. Nomura and Y. Iitaka, Heterocycles, 1989, 29, 1761–1772 CrossRef CAS.
-
(a) R. D. H. Murray and M. M. Ballantyne, Tetrahedron, 1970, 26, 4473–4479 CrossRef CAS;
(b) C. Ito, K. Fujiwara, M. Kajita, M. Ju-ichi, Y. Takemura, Y. Suzuki, K. Tanaka, M. Omura and H. Furukawa, Chem. Pharm. Bull., 1991, 39, 2509–2513 CrossRef CAS;
(c) N. Vera, A. Bardón, C. A. N. Catalán, T. E. Gedris and W. Herz, Planta Med., 2001, 67, 674–677 CrossRef CAS PubMed;
(d) W. C. Lai, Y. T. Tsui, A. N. B. Singab, M. El-Shazly, Y. C. Du, T. L. Hwang, C. C. Wu, M. H. Yen, C. K. Lee, M. F. Hou, Y. C. Wu and F. R. Chang, Int. J. Mol. Sci., 2013, 14, 15578–15594 CrossRef PubMed;
(e) H. Li, M. Yang, J. Miao and X. Ma, Magn. Reson. Chem., 2008, 46, 1203–1207 CrossRef CAS PubMed;
(f) Y. L. Huang, P. Y. Yeh, C. C. Shen and C. C. Chen, Phytochemistry, 2003, 64, 1277–1283 CrossRef CAS PubMed.
- G. Yoon, W. Lee, S. N. Kim and S. H. Cheon, Bioorg. Med. Chem. Lett., 2009, 19, 5155–5157 CrossRef CAS PubMed.
- T. Bruhn, Y. Hemberger, A. Schaumlöffel and G. Bringmann, SpecDis, version 1.51, University of Wuerzburg, Germany, 2011 Search PubMed.
- M. J. Frisch, G. W. Trucks, H. B. Schlegel, G. E. Scuseria, M. A. Robb, J. R. Cheeseman, G. Scalmani, V. Barone, B. Mennucci, G. A. Petersson, H. Nakatsuji, M. Caricato, X. Li, H. P. Hratchian, A. F. Izmaylov, J. Bloino, G. Zheng, J. L. Sonnenberg, M. Hada, M. Ehara, K. Toyota, R. Fukuda, J. Hasegawa, M. Ishida, T. Nakajima, Y. Honda, O. Kitao, H. Nakai, T. Vreven, J. A. Montgomery, J. E. Peralta, F. Ogliaro, M. Bearpark, J. J. Heyd, E. Brothers, K. N. Kudin, V. N. Staroverov, R. Kobayashi, J. Normand, K. Raghavachari, A. Rendell, J. C. Burant, S. S. Iyengar, J. Tomasi, M. Cossi, N. Rega, N. J. Millam, M. Klene, J. E. Knox, J. B. Cross, V. Bakken, C. Adamo, J. Jaramillo, R. Gomperts, R. E. Stratmann, O. Yazyev, A. J. Austin, R. Cammi, C. Pomelli, J. W. Ochterski, R. L. Martin, K. Morokuma, V. G. Zakrzewski, G. A. Voth, P. Salvador, J. J. Dannenberg, S. Dapprich, A. D. Daniels, O. Farkas, J. B. Foresman, J. V. Ortiz, J. Cioslowski and D. J. Fox, Gaussian 09, revision B.01, Gaussian Inc., Pittsburgh, PA, 2010 Search PubMed.
|
This journal is © The Royal Society of Chemistry 2015 |
Click here to see how this site uses Cookies. View our privacy policy here.