Stainless steel felt as diffusion backing for high-performance microbial fuel cell cathodes

Zhaozheng Qiu, Liling Wei*, Gang Wang, Min Su and Jianquan Shen*
Beijing National Laboratory for Molecular Sciences (BNLMS), Key Laboratory of Green Printing, Institute of Chemistry, Chinese Academy of Sciences, Zhongguancun North First Street 2, Beijing 100190, China. E-mail: weill@iccas.ac.cn; jqshen@iccas.ac.cn; Fax: +86 10 62559373; Tel: +86 10 61934539

Received 10th April 2015 , Accepted 15th May 2015

First published on 15th May 2015


Abstract

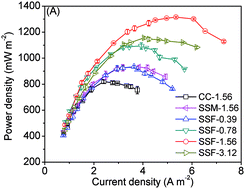
Novel three-dimensional (3D) macroporous cathodes for microbial fuel cells (MFCs) are constructed by using stainless steel felt (SSF) as the diffusion backing and the current collector, instead of two-dimensional (2D) materials such as a carbon cloth (CC) or stainless steel mesh (SSM), thereby resulting in an enlarged surface area for the oxygen reduction reaction (ORR). Different amounts of carbon black (CB) are applied in the base layers to optimize the performance of those SSF cathodes. The MFCs using the SSF cathodes with CB loading of 1.56 mg cm−2 (SSF-1.56) achieve a maximum power density of 1315 ± 6 mW m−2, which is 60% and 42% higher than those using the CC and SSM cathodes, respectively. The results show that the cathode of SSF-1.56 exhibits an excellent catalytic activity for ORR as well as a reduced total internal resistance, thanks to the improved three-phase interface (TPI) that not only facilitates the electron transfer, the proton transfer and the oxygen diffusion, but also offers a large surface for the ORR at the cathode. Our research also demonstrates that the SSF cathodes with an optimal CB loading will benefit the advancement of MFCs in practical application.


1. Introduction

Microbial fuel cells (MFCs), using electro-active micro-organisms as catalysts, directly convert the chemical energy of organic or inorganic matter into electrical energy.1 One of the potential applications of MFC technology is wastewater treatment, where electrical energy is simultaneously recovered as the wastewater is treated, which is the main advantage of this technology over other conventional methods in the field.2 Although such oxidants as ferricyanide,3 nitrate4 and permanganate5 have been adopted as electron acceptors at the cathodes in MFCs, oxygen, as a cost-effective, sustainable and environmentally friendly oxidant, is the most promising one for wastewater treatment applications.6 Owing to its simple structure, low cost and direct use of oxygen in ambient air, the air-cathode MFC is highly efficient and considered to be of the greatest potential for practical applications.7

At present time, the MFC performance of electricity generation still can't satisfy the needs of practical applications. The main challenges for the development of the MFC technology lie in how to further improve the power production and the electrons recovery from the substrate, while at the same time reduce costs of the materials for MFCs' commercialization.7 According to some previous researches, the cathodic performances and the cathode surface area have been proved to be the two most important factors that affect the performances of MFCs in the process of scaling-up.6,8–11 Meanwhile the expenses of cathode materials account for a large part in the total MFC costs.12 Therefore, exploiting cost-effective cathode materials and designing efficient cathodes to improve the performances of MFCs emerge as the main issues in the practical applications of MFCs.

Nowadays, most laboratories adopt carbon cloth (CC) as the backing of air-cathodes.13,14 But, due to its low mechanical strength and the large resistance as the reactor size increases, the CC cathodes seem impracticable for scaled-up MFCs. Stainless steel mesh (SSM), which is inexpensive, widely available, mechanically strong and relatively anticorrosive,15,16 is also adopted as the current collector and the backing for air-cathodes so that the electrode ohmic losses can be reduced. It has been reported that a maximum power density of 1610 ± 56 mW m−2 was obtained in a small lab-scale reactor by using SSM as the current collector and the backing.6 Further research has shown that the size of mesh openings exert a significant effect on the performances of cathodes, which were primarily limited by oxygen reduction kinetics rather than the mass transfer.16

However, because of their limited interfacial channels for oxygen and proton transport as well as the restricted surface area for oxygen reduction reaction (ORR), the cathodes using the two-dimensional (2D) CC and SSM prevent the power output from further increasing. The restricted reactive surface area and high activation energy barrier lead to the activated loss of electrodes, while the flat structure and the relatively lower porosity result in the diffusion limitation of these electrodes.17 One of the effective ways to eliminate those above-mentioned drawbacks is to employ porous three-dimensional (3D) electrodes, bearing such advantages as a large surface area for reaction, efficient interfacial transport, shortened diffusion paths and reduced activated and/or diffusion resistance. Stainless steel felt (SSF), a commercially available and inexpensive 3D porous filter material widely used for gas and liquid filtration, whose open 3D macroporous structure enables a large specific surface area, high anticorrosion, excellent mechanical strength and uniform aperture distribution,18 is considered to be an ideal backing and current collector for the air-cathode design in MFCs. A recent report has demonstrated that the MFC using a graphene modified SSF anode has produced a maximum power density of 2142 mW m−2, which was attributed to its large surface area for reaction, excellent interfacial transport and biocompatible interface for bacterial colonization.17 Guo et al.19 has put forward a simple method to make biocompatible SSF anodes by mere flame oxidation, proved to be rapid, energy-efficient and satisfactory for the large-scale anode fabrication. To our knowledge, up till now there has been no report on the application of the material in MFC cathodes, although SSF has been tested as the gas diffusion layer in proton exchange membrane fuel cells (PEMFCs)20 and as the cathode diffusion backing and the current collector for a micro direct methanol fuel cell.21

Carbon black (CB) is primarily used in Pt cathodes as the catalyst support and the base layer stuffing due to its high electrical conductivity. But, the optimal amount of CB in the base layer has not been determined, and it is important for us to have a clear idea of the impact of CB loading on cathode performance. As illustrated by one report, CB loadings significantly affect the performances of activated carbon cathodes,22 we have varied the loadings of CB particles in the base layer during the cathode fabrication in order to improve the performances of the SSF based cathodes. Therefore, the aims of this study are to fabricate air-cathodes by using open 3D macroporous SSF as the diffusion backing and the current collector and to determine the impact of CB loadings in the base layer on the cathode performances in both electrochemical and MFC tests.

2. Materials and methods

2.1. Cathode fabrication

The cathodes fabricated here are based on integrating the backing (SSF), the catalyst (Pt), and the diffusion layer (polytetrafluoroethylene PTFE) into one single cathode structure, among which SSF (316L-40, 0.7 mm thick) was purchased from Xi'an Filter Metal Materials Co., Ltd with the mean filter rating of 40.7 μm and the mean porosity of 78%. The fabrication procedure has been modified from Cheng's method.14 The SSF substrates were firstly soaked in acetone for 4 hours and then rinsed with deionized water before fabrication. The PTFE/CB base layer was prepared by applying a mixture of CB powder (Alfa Aesar, USA) and PTFE solution (31.2 μL 30 wt% PTFE per square centimeter) onto the air-facing side of the backing material, air-dried at room temperature for 2 hours, and subsequently heated at 370 °C for 30 minutes. The CB loading in the base layer was changed at weight per square centimeter: 0.39 mg, 0.78 mg, 1.56 mg and 3.12 mg. Multiple PTFE DLs containing PTFE solution (60 wt%) were coated on the top of the base layer (3 mg cm−2 of PTFE for every coating), followed by being air-dried at room temperature and then heated at 370 °C for 5 minutes. Four DLs of PTFE were applied on the base layer, producing the cathodes of SSF-0.39, SSF-0.78, SSF-1.56 and SSF-3.12, respectively. CC (HCP331N, Hesen, China) and SSM (type SUS-304 SS, 80 × 80 openings per square inch) were also tested as the cathode backing materials. These two kinds of cathodes, consisting four DLs of PTFE, were prepared following previously described method.14 The CB loading in those base layers was chosen to be 1.56 mg cm−2, and the cathodes are denoted here as CC-1.56 and SSM-1.56, respectively. When the fabrication of DLs has finished, Pt catalyst (0.2 mg cm−2, 40% Pt Hesen, China) was then applied to the water-facing side of the cathodes as previously described, using Nafion as a binder.23

2.2. MFC construction and operation

As previously reported, the Plexiglas cylindrical single-chamber MFCs consist of an anode and a cathode in an anode chamber 4 cm in length by 3 cm in diameter (empty bed volume of 28 mL).14 The anode electrodes were made of graphite felt (2 cm × 2 cm × 0.5 cm, Beijing Sanye Carbon Co., Ltd). After being soaked in acetone for 4 hours and rinsed with deionized water, the graphite felt was heated at 400 °C for 1 hour. Titanium wire was used to fix the anode and connect the circuit.

Each MFC reactor was inoculated using mixed cultures taken from the anode chamber of a two-chamber MFC for electricity generation, operating in batch mode.3 All anodes were originally pre-inoculated in a large single-chamber MFC during start-up to ensure that the biofilm on anodes could achieve the identical performance during acclimation. The medium (per liter) applied sucrose as the fuel (1000 mg), and a phosphate buffer solution (PBS) containing NH4HCO3, 500 mg; Na2CO3, 2000 mg; NaH2PO4·2H2O, 3978 mg; Na2HPO4·12H2O, 8771 mg; K2HPO4, 125 mg; MgCl2·6H2O, 100 mg; trace minerals (12.5 mL L−1) and vitamins (5 mL L−1).24 The minerals contains (per liter): nitrilotriacetic acid, 1.5 g; MgSO4·7H2O, 3.0 g; MnSO4·2H2O, 0.5 g; NaCl, 1.0 g; FeSO4·7H2O, 0.1 g; CaCl2·2H2O, 0.1 g; CoCl2, 0.1 g; ZnSO4, 0.10 g; CuSO4·5H2O, 0.01 g; AlK(SO4)2, 0.01 g; H3BO3, 0.01 g; Na2MoO4·2H2O, 0.01 g and adjust pH to 7.0 with KOH. The initial COD and pH of the anolyte were 1122 mg L−1 and 7.70, respectively. MFCs were operated in fed-batch mode at 35 °C.

2.3. Analytics and calculation

Voltage (E) across the external resistor (1000 Ω, except as noted) in the MFC circuit was continuously measured at 5 minute intervals using a data acquisition system (CT-3008-5V50mA-S4, Xinwei, China). Current (I) was calculated by I = E/Re, where Re represents the external resistance; power (P) was calculated according to P = IE as previously described.2 Polarization and power density curves were obtained by changing the external resistance from 1000 Ω to 50 Ω in decreasing order, with a time interval of 30 min for each external resistance to ensure a relatively stable voltage can be achieved. The Coulombic efficiency (CE) was calculated as CE(%) = Cp/Ct × 100%, where Cp is produced coulombs that calculated by integrating the current over time, and Ct is the theoretical amount of coulombs based on COD removal.2

Electrochemical properties and impedance behaviors of the cathodes were studied by linear sweep voltammetry (LSV) and electrochemical impedance spectroscopy (EIS) using an electrochemical workstation (CHI 604E, ChenHua Instruments Co., Ltd., Shanghai, China). LSV tests were conducted in the absence of bacteria and substrate, using a three-electrode assembly which consists of a working electrode (cathode with 7 cm2 projected surface area), a counter electrode (Pt wire) and an Ag/AgCl reference electrode (218, Shanghai REX Instrument Factory). Potential was scanned from 0.4 V to −0.3 V (vs. Ag/AgCl electrode) with the scan rate of −1 mV s−1.

Electrochemical impedance spectroscopy (EIS) was employed to measure the internal resistances of the cathodes at the end of a batch operation. The measurements were conducted at polarized conditions of 0.1 V, 0 V and −0.1 V (vs. saturated Ag/AgCl electrode), which were within the range of the operating potentials of the MFC cathodes, over a frequency range of 100 kHz to 10 mHz with a sinusoidal perturbation of 10 mV amplitude.8 EIS, applied as a useful electrochemical technology, can be employed to measure the internal resistance (Rint) of the cathodes. The Nyquist plots were used to interpret the spectra. The specific composition of each resistance of air-cathodes was determined by using Zview 2.0 software.

For EIS data analysis, two different equivalent circuits were used for the SSF cathodes and the other two cathodes with CC and SSM backing due to the differences in shape of the spectra. Individual components of the internal resistance for the SSF cathodes were identified by fitting their EIS spectra to an equivalent circuit as previously described.16 This equivalent circuit assumes that the cathode reaction is affected by both reaction kinetics and diffusion. The symbol Rs and Rct represent the solution resistance and the charge transfer resistance, respectively. A constant phase element (Q) was used to model double layer capacitance while a Warburg element (W) was employed to evaluate the diffusion resistance (Fig. 1A). On the other hand, the spectra for the CC and SSM cathodes were fitted into equivalent circuits respectively according to the flooded-agglomerate model.25 The equivalent circuit is composed of a solution element (solution resistance, Rs) in series with a charge transfer element (charge transfer resistance Rct in parallel with double layer capacitance Cdl) and followed by a diffusion element (diffusion resistance Rd in parallel with pore adsorption capacitance Cad) (Fig. 1B).


image file: c5ra06448a-f1.tif
Fig. 1 Equivalent circuit for (A) SSF cathodes and (B) CC and SSM cathodes.

Scanning electron microscopy (SEM) (S-4300, Hitachi, Japan) was used to characterize the transversal surface morphology of the samples. All experiments have been repeated twice and similar results were obtained.

3. Results and discussion

3.1. Performance of cathodes in MFC tests

Power production performances of different cathodes in MFCs have been examined. Repeatable and stable voltages were immediately obtained in all MFCs due to the use of pre-acclimated anodes. Although there were very small differences in voltage among these MFCs at a high external resistance of 1 kΩ, the MFC using SSF-1.56 exhibited higher voltage output than the other cathodes (CC-1.56 and SSM-1.56) with the same CB loading of 1.56 mg cm−2 (Fig. 2A), while the cathodes of SSF-0.78 and SSF-1.56 produced relatively higher voltages than the other two SSF cathodes (SSF-0.39 and SSF-3.12) (Fig. 2B). Over 3 batch cycles of operation, the average value of the maximum voltages reached 569 ± 10 mV (±S.D., n = 3) for the SSF-1.56 cathodes while the highest values of the CC and SSM cathodes reached 529 ± 7 mV and 526 ± 4 mV, respectively.
image file: c5ra06448a-f2.tif
Fig. 2 Voltage generation of (A) CC, SSM and SSF cathodes with CB loading of 1.56 mg cm−2 and (B) SSF cathodes with different CB loading versus time, with 50 mM PBS buffer and 1.0 g L−1 sucrose.

At the 4th batch cycle of operation, power densities and electrode potentials have been measured for MFCs with different cathodes. The MFCs equipped with the SSF-1.56 cathodes achieved the highest maximum power density of 1315 ± 6 mW m−2 (±S.D., duplicate reactors), 60% and 42% higher than those with the CC and SSM cathodes, respectively. On the other hand, the CC-1.56 cathodes produced the lowest maximum power density of 820 ± 13 mW m−2 (Fig. 3A). It was also found out that there were large differences in power production performances of the SSF cathodes with different CB loading in the base layers. The maximum power density was 934 ± 9 mW m−2 for the MFCs using SSF cathodes with 0.39 mg cm−2 CB loading. When additional CB was applied into the base layers, the maximum power density increased to 1093 ± 25 mW m−2 (SSF-0.78) and 1315 ± 6 mW m−2 (SSF-1.56). However, further increment of the CB loading reduced the maximum power density, namely 1156 ± 8 mW m−2 for SSF-3.12. The cathode potentials followed the same changing trend as the power generation, while the anode potentials were basically the same at given current densities in all MFCs, indicating the fact that discrepancies in the performances of cathodes lead to the differences in power generation of various MFCs (Fig. 3B).


image file: c5ra06448a-f3.tif
Fig. 3 (A) Power densities and (B) electrode potentials of SSF cathodes with different CB loading and CC and SSM cathodes with the CB loading of 1.56 mg cm−2 as a function of current density (normalized to cathode projected surface area) obtained by varying the external circuit resistance (1000–50 Ω) (error bars ± SD based on measurement of two duplicate reactors).

With the same CB loading of 1.56 mg cm−2, the MFC with the SSF cathodes produced a much higher maximum power density than those with the CC or SSM cathodes, which can be attributed to the improved ORR at three-phase interface (TPI) in the open three-dimensional (3D) macroporous structure of SSF cathodes. Furthermore, the cathodes with different CB loadings in the base layers demonstrated such wide variations in MFC performances that it can be concluded that the amounts of CB blended in base layers exert a significant effect on the performances of cathodes in power generation.

3.2. Performance of cathodes in electrochemical tests

LSV tests were conducted to evaluate the electrochemical performances of different cathodes in the absence of bacteria. The SSF cathodes with different CB loading in the base layers were compared with the CC and SSM cathodes, the results of which showed that the SSF-1.56 cathode exhibited a higher current density than the other cathodes at a given applied potential (Fig. 4). Although the current densities of SSM-1.56 and CC-1.56 were similar at a given applied potential, the onset potential of SSM-1.56 was higher than that of CC-1.56, thereby resulting in a higher maximum power density of SSM-1.56. In our tests, the current densities obtained from the MFCs were in the range of 0–8 A m−2, and the maximum power densities of all MFCs were generally obtained at the cathodic potential around −0.1 V. Thus, although higher current densities were obtained at lower potentials than −0.12 V, the MFCs with the SSF-0.39 cathodes performed poorly in power generation, due to the bad electrochemical performances at higher potential than −0.12 V. The changes in current densities of cathodes in LSV tests demonstrated a similar trend with those in power production which, to a certain degree, enables us to predict the performances of cathodes in MFC tests.
image file: c5ra06448a-f4.tif
Fig. 4 LSV of SSF cathodes with different CB loading and CC and SSM cathodes with the CB loading of 1.56 mg cm−2.

3.3. Morphological characteristics of cathodes' transversal surface

Morphological characteristics of cathodes' transversal surface were observed with SEM. As shown in Fig. 5C and D, the cathodes made from CC and SSM have few porous diffusion paths. SSF made of pressed stainless steel fiber of ∼20 μm in diameter, on the contrary, forms a relatively uniform macroporous 3D configuration, which enables it to be an eligible diffusion backing for air-cathodes (Fig. 5A and B). The cathodes constructed with SSF developed an improved TPI, not only facilitating the electron transfer, the proton transfer and the oxygen diffusion, but offering a large surface area for ORR as well. The sequential applications of a PTFE/CB base layer and PTFE DLs to the porous SSF are important for controlling the water loss from anode chamber and the oxygen intrusion from outside into it. In addition, the amounts of CB in the base layers serve as another significant factor that affects the electrochemical performances of these SSF cathodes. As shown in Fig. 5G, in comparison with Fig. 5E, F and H, the cathodes with CB loading of 1.56 mg cm−2 possess more internal macropores which can enhance the interaction of protons and oxygen and therefore improve the electrochemical activity of these cathodes. This improved structure, most beneficial for the cathodic reaction, has produced the highest maximum power density (1315 ± 6 mW m−2).
image file: c5ra06448a-f5.tif
Fig. 5 SEM images of the transversal surface of unmodified SSF (A and B) and modified cathodes with CC (C), SSM (D), SSF-0.39 (E), SSF-0.78 (F), SSF-1.56 (G), and SSF-3.12 (H).

3.4. Resistances of electrodes

Nyquist plots of EIS operated at 0.1 V, 0 V and −0.1 V (vs. Ag/AgCl) for the cathodes were compared in Fig. 6. The inserts in Fig. 6 illustrate the high-frequency parts of the EIS for the SSF cathodes. As shown by the diminishing size of the semi-circle in Nyquist plots, the total impedance of cathodes became smaller with decreasing the applied potentials (increasing oxygen reduction overpotentials, 0.1 V → 0 V → −0.1 V), which attributed to the increasing kinetic driving force by larger overpotentials. The charge transfer resistance (Rct) was obtained from the high-frequency part of the EIS spectrum in Nyquist plots while the diffusion resistance (Rd) from the low frequency part. It can be seen from the Nyquist plots that the SSF cathodes had smaller total impedances than those based on CC or SSM at all of the three polarized conditions, illustrated by the smaller semi-circles for the SSF cathodes. Moreover, the SSF cathode with CB loading of 1.56 mg cm−2 had the smallest total impedance.
image file: c5ra06448a-f6.tif
Fig. 6 Nyquist plots of EIS spectra by six types of cathodes at polarized conditions of 0.1 V (A), 0 V (B) and −0.1 V (C) (the inserts show the EIS spectra of SSF cathodes).

Individual components of the internal resistance for the SSF cathodes were identified by fitting the EIS spectra to one equivalent circuit, the results of which were shown in Table 1. The Rss of all the SSF cathodes were similar at different polarized conditions. However, the other electrochemical properties (Rct, Rd and Q) varied for those cathodes with different CB loadings. The Rds of these cathodes played a dominant role in most cases but became smaller with increasing oxygen reduction overpotential. Moreover, compared with the other cathodes, the SSF-1.56 cathodes had the smallest Rd at each polarized condition, probably due to the optimal structure of this cathode for proton transfer and oxygen diffusion, resulting in the highest power generation. At −0.1 V, for example, the SSF-1.56 cathode had the lowest Rd of 12.41 Ω, when the CB loading increased from 1.56 mg cm−2 to 3.12 mg cm−2 the Rd of SSF-3.12 cathode reached 23.26 Ω, which was attributed to the destroyed optimal structure for the oxygen diffusion. If the EIS is conducted at the same polarized condition of −0.1 V (around where most cathodes produced the maximum power densities in MFC tests (Fig. 3B)), Rd will be the largest contributor to resistance, indicating that the mass transfer is the primary limiting factor of the ORR for cathodes. Therefore it is important to increase the mass transfer by way of perturbation motion so that MFC performances can be improved. The results here were consistent with previous EIS studies, showing that the cathode diffusion resistance, larger than the charge transfer resistance, became the main part in total internal resistance of cathodes.8,16

Table 1 Individual element of the cathodic internal resistances for SSF cathodes at overpotential of 0.1 V, 0 V and −0.1 V
Element Overpotential SSF-0.39 SSF-0.78 SSF-1.56 SSF-3.12
Rs (Ω) 0.1 V 15.35 15.50 13.42 15.26
0 V 14.61 14.96 13.09 14.64
−0.1 V 14.73 15.53 13.33 14.96
Rct (Ω) 0.1 V 11.76 12.59 4.39 2.37
0 V 10.00 4.55 1.19 2.40
−0.1 V 9.25 9.99 2.80 1.56
Rd (Ω) 0.1 V 143.70 100.1 72.28 93.28
0 V 53.51 84.06 37.67 51.09
−0.1 V 31.83 34.12 12.41 23.26
Q (F) 0.1 V 0.44608 0.68286 0.7894 0.6344
0 V 0.3713 0.33725 0.4197 0.31702
−0.1 V 0.36619 0.34767 0.54884 0.39573


Generally speaking, Rct decreased with both increasing CB loadings in the base layers and increasing oxygen reduction overpotential. At polarized potential of 0.1 V, for instance, Rct decreased from 11.76 Ω to 2.37 Ω as the CB loadings increased from 0.39 mg cm−2 to 3.12 mg cm−2. Those cathodes with larger amounts of CB had lower Rct values than those with lower CB loadings, the reason of which likely lay in the fact that more CB in the internal macropores of the 3D configuration improved the conductivity and thereby facilitated the electron transfer and then enhanced the overall catalytic performance of the cathodes. Besides, Rct also decreased with increasing oxygen reduction overpotential due to the larger driving force for the electron transfer.

The double layer capacitance, given that it is induced by the buildup of charge at the electrode–electrolyte interface, may has something to do with the electrode–electrolyte networks in the catalytic layer.16 In this study, the double layer capacitance generally rose with increasing CB loadings from 0.39 mg cm−2 to 1.56 mg cm−2, suggesting that the cathodes with higher level of CB had larger active surface areas and consequently higher catalyst utilization. The SSF-1.56 cathode, in particular, had the highest Q value, probably owing to abundant macropore in the internal structure which allowed more contact between catalyst and the open 3D porous felt. As the CB loading increased to 3.12 mg cm−2, the optimal structure had been damaged, leading to a lower Q value of the SSF-3.12 cathode.

An equivalent circuit, put forward according to the flooded-agglomerate model, was used for the EIS spectra of the cathodes with CC and SSM backing, resulting in a good fit of the data to the spectra for both cathodes. Due to the poor electrical conductivity and proton transfer for the CC backing, the CC-1.56 cathode obtained the highest Rct (Table 2), producing the lowest maximum power density of 820 ± 13 mW m−2. Similarly, the Rct value of the SSM-1.56 cathode was much higher than those of the SSF cathodes, which can be attributed to the poor proton conductivity of the SSM cathodes resulting from their flat 2D structure. At low overpotential (0.1 V), Rcts for the CC and SSM cathodes were the largest contributors to the internal resistances, indicating that the ORR is primarily kinetically limited. However, when the cathodic potential was fixed at −0.1 V, some discrepancies were observed for the two cathodes, namely, Rct still being the main part of the resistance for the SSM cathode while Rd becoming the primary factor in limiting the cathodic reaction for the CC cathode.

Table 2 Individual element of the cathodic internal resistances for CC and SSM cathodes at overpotential of 0.1 V, 0 V and −0.1 V
Element Overpotential CC-1.56 SSM-1.56
Rs (Ω) 0.1 V 24.24 23.69
0 V 24.12 23.42
−0.1 V 23.99 23.45
Rct (Ω) 0.1 V 137.7 77.44
0 V 62.35 33.94
−0.1 V 43.63 20.66
Cdl (F) 0.1 V 0.05006 0.06523
0 V 0.04018 0.06084
−0.1 V 0.03561 0.05359
Rd (Ω) 0.1 V 108.9 16.77
0 V 111.5 16.1
−0.1 V 90.8 15.95
Cad (F) × 10−6 0.1 V 4.65 3.85
0 V 4.73 3.59
−0.1 V 4.93 3.57


To sum up, the cathodes with SSF backing exhibit lower internal resistance than those with CC and SSM backing, ensuring their outstanding performances in MFCs tests. On the other hand, blending CB in base layers proved to be effective for reducing the internal resistance and enhancing cathode performances in MFCs.

3.5. Corrosion

No corrosion was found on either side of the cathodes after the operation in MFCs. The composition of the metal in the SSF cathodes, which measured by SEM-EDS, showed little variation in molybdenum, chromium, iron and nickel composition before and after use in MFCs (Table 3), confirming the conclusion that power generation in MFC was not a result of corrosion of metal in SSF cathodes. In a previous study, Janicek et al.26 demonstrated that corrosion appeared on the outer surface (air facing side) of the SSM cathode during operation. The formation of insoluble iron hydroxides, which appear reddish brown or green for the SSM cathodes in their experiment, did not occur on the inner surface (water facing side) of the SSF cathodes here. The different corrosion property between the SSF herein and the SSM used in Janicek's experience probably due to the different chemical composition of the stainless steel materials.
Table 3 Metal composition of stainless steel felt by SEM-EDS before and after operation in MFC as cathode
Weight percent (%) Initial Used
Mo 02.01 02.03
Cr 18.46 18.41
Fe 67.32 67.36
Ni 12.20 12.21


3.6. COD removal and coulombic efficiency (CE)

COD removals, over a batch cycle of operation, ranged from 91% to 96% and the CB loading or the type of the backing (SSF or CC or SSM) exerted no apparent effect on them. The CEs of the SSF-0.39 cathodes ranged from 13% to 35% at the current density range of 0.7–4.0 A m−2 and then slightly increased when more CB was applied in the base layers (Fig. 7). The highest CE of 41% was obtained when the CB loading reached as high as 1.56 mg cm−2 at the current density of 5.5 A m−2, but the CEs fell into the range of 14–34% with further addition of CB. Meanwhile, with the same amount of CB loading, the CEs of SSF-1.56 were obviously higher than those of CC-1.56 or SSM-1.56, fully showing the superiority of the SSF cathodes in MFC performances. It is also clear that higher CEs are achieved at increased current density, which is consistent with those results of some previous studies.7,14 Since increase in the current density leads to a reduction of the operation time in a batch cycle, the rise of the CE may result from the substantial decrement of oxygen that diffuses into the anode chamber. However, the values of CE obtained here were lower than those in the previous reports,6,7 probably due to the sucrose we used as the substrate, which, being fermentable, can facilitate fermentations and/or methanogenesis, the likely competitors in the process of the electricity generation in the anode chamber.
image file: c5ra06448a-f7.tif
Fig. 7 CEs of SSF cathodes with different CB loading and CC and SSM cathodes as a function of current density obtained by varying the external circuit resistance (1000–50 Ω).

4. Conclusions

Novel 3D macroporous air-cathodes have been built on the basis of 3D stainless steel felts, a promising alternative to CC and SSM as the air-cathode backing. MFCs equipped with this type of cathodes can produce higher power densities and CEs, which improvements we attribute to the enhanced oxygen reduction reaction at the improved three-phase interface in open 3D macroporous structure of the cathodes. The results show that the construction of cathodes with open 3D macroporous SSF, beneficial for the applications of MFCs in a large scale, is both promising and effective for the MFC cathodes. Our experiments also demonstrate that CB blended in the base layers can improve the electrochemical properties of the cathodes, illustrated by increased current densities, reduced charge transfer resistances and diminished diffusion resistances of the cathodes. The best performance of the SSF cathodes in MFCs tests can be achieved when applied with an appropriate amount of CB of 1.56 mg cm−2. In the foreseeable future, a type of high-performance SSF cathodes will advance the large scale applications of MFCs.

Acknowledgements

This work was supported by the National Natural Science Fund of China (no. 91127012 and no. 21403251) and the Chinese Academy of Sciences for financial support (no. KJCX2-YW-H21).

References

  1. B. E. Logan and J. M. Regan, Environ. Sci. Technol., 2006, 40, 5072–5180 Search PubMed.
  2. B. E. Logan, B. Hamelers, R. Rozendal, U. Schroder, J. Keller, S. Freguia, P. Aelterman, W. Verstraete and K. Rabaey, Environ. Sci. Technol., 2006, 40, 5181–5192 CrossRef CAS.
  3. L. Wei, H. Han and J. Shen, Int. J. Hydrogen Energy, 2012, 37, 12980–12986 CrossRef CAS PubMed.
  4. C. Fang, B. Min and I. Angelidaki, Appl. Microbiol. Biotechnol., 2011, 164, 464–474 CAS.
  5. S. You, Q. Zhao, J. Zhang, J. Jiang and S. Zhao, J. Power Sources, 2006, 162, 1409–1415 CrossRef CAS PubMed.
  6. F. Zhang, T. Saito, S. Cheng, M. A. Hickner and B. E. Logan, Environ. Sci. Technol., 2010, 44, 1490–1495 CrossRef CAS PubMed.
  7. X. Zhang, S. Cheng, P. Liang, X. Huang and B. E. Logan, Bioresour. Technol., 2011, 102, 372–375 CrossRef CAS PubMed.
  8. F. Zhang, G. Chen, M. A. Hickner and B. E. Logan, J. Power Sources, 2012, 218, 100–105 CrossRef CAS PubMed.
  9. S. Cheng and B. E. Logan, Bioresour. Technol., 2011, 102, 4468–4473 CrossRef CAS PubMed.
  10. H. Liu, S. Cheng, L. Huang and B. E. Logan, J. Power Sources, 2008, 179, 274–279 CrossRef CAS PubMed.
  11. Y. Zuo and B. E. Logan, Water Sci. Technol., 2011, 64, 2253–2258 CrossRef CAS PubMed.
  12. R. A. Rozendal, H. V. M. Hamelers, K. Rabaey, J. Keller and C. J. N. Buisman, Trends Biotechnol., 2008, 26, 450–459 CrossRef CAS PubMed.
  13. H. Liu and B. E. Logan, Environ. Sci. Technol., 2004, 38, 4040–4046 CrossRef CAS.
  14. S. Cheng, H. Liu and B. E. Logan, Electrochem. Commun., 2006, 8, 489–494 CrossRef CAS PubMed.
  15. X. Li, X. Wang, Y. Zhang, N. Ding and Q. Zhou, Appl. Energy, 2014, 123, 13–18 CrossRef CAS PubMed.
  16. F. Zhang, M. D. Merrill, J. C. Tokash, T. Saito, S. Cheng, M. A. Hickner and B. E. Logan, J. Power Sources, 2011, 196, 1097–1102 CrossRef CAS PubMed.
  17. J. Hou, Z. Liu, S. Yang and Y. Zhou, J. Power Sources, 2014, 258, 204–209 CrossRef CAS PubMed.
  18. P. Liu and K. Liang, J. Mater. Sci., 2001, 36, 5059–5072 CrossRef CAS.
  19. K. Guo, B. C. Donose, A. H. Soeriyadi, A. Prévoteau, S. A. Patil, J. J. Gooding and K. Rabaey, Environ. Sci. Technol., 2014, 48, 7151–7156 CrossRef CAS PubMed.
  20. P. Yi, L. Peng, X. Lai, M. Li and J. Ni, Int. J. Hydrogen Energy, 2012, 37, 11334–11344 CrossRef CAS PubMed.
  21. Y. Li, X. Zhang, L. Nie, Y. Zhang and X. Liu, J. Power Sources, 2014, 245, 520–528 CrossRef CAS PubMed.
  22. X. Zhang, X. Xia, I. Ivanov, X. Huang and B. E. Logan, Environ. Sci. Technol., 2014, 48, 2075–2081 CrossRef CAS PubMed.
  23. S. Cheng, H. Liu and B. E. Logan, Environ. Sci. Technol., 2006, 40, 364–369 CrossRef CAS.
  24. D. Lovley and E. Phillips, Appl. Environ. Microbiol., 1988, 54, 1472–1480 CAS.
  25. F. Zhang, D. Pant and B. E. Logan, Biosens. Bioelectron., 2011, 30, 49–55 CAS.
  26. A. Janicek, Y. Fan and H. Liu, J. Power Sources, 2015, 280, 159–165 CrossRef CAS PubMed.

This journal is © The Royal Society of Chemistry 2015
Click here to see how this site uses Cookies. View our privacy policy here.