Preparation and characterization of new poly(dimethylsiloxane) membrane series via a ‘cross-linking’ reaction using monomolecular trichloro(alkyl)silane of different alkyl chain and type

Ankit M. Kansaraab, Vinod K. Aswalc and Puyam S. Singh*ab
aCSIR-Central Salt & Marine Chemicals Research Institute, RO Membrane Discipline, G. B. Marg, Bhavnagar-364 002, Gujarat, India. E-mail: puyam@csmcri.org; Fax: +91-278-2567562; Tel: +91-278-2566511
bAcademy of Scientific and Innovative Research (AcSIR-CSMCRI), G. B. Marg, Bhavnagar-364002, Gujarat, India
cSolid State Physics Division, Bhabha Atomic Research Centre, Trombay, Mumbai-400085, India

Received 10th April 2015 , Accepted 22nd May 2015

First published on 22nd May 2015


Abstract

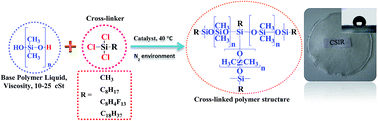
Poly(dimethylsiloxane) (PDMS) membrane, which is generally prepared by cross-linking a hydroxyl-terminated-poly(dimethylsiloxane) liquid with a polymethylhydrosiloxane cross-linker through a condensation reaction between the hydroxyl end groups and hydride groups liberating hydrogen, is one of the most studied polymeric membranes for the separation of gases and liquids. Herein, a new PDMS membrane series prepared by direct cross-linking hydroxyl terminated polydimethylsiloxane pre-polymer liquid with RSiCl3 molecules of different types in n-heptane solvent under a nitrogen environment were studied, wherein the alkyl chain, R, was varied as methyl CH3, octyl C8H17, perfluorooctyl C8H4F13, and octadecyl C18H37. For each membrane series, the amount of cross-linker to pre-polymer was varied as 13[thin space (1/6-em)]:[thin space (1/6-em)]87, 33[thin space (1/6-em)]:[thin space (1/6-em)]67 and 50[thin space (1/6-em)]:[thin space (1/6-em)]50 (w/w) to compare the membranes at different cross-linking densities. The cross-linked network structure of the membrane comprised dimethylsiloxane network structures of two cross-links and alkylsiloxane network structure of two or three cross-links. The changes in the structure and properties of the membranes depending on the concentration and type of trichloro(alkyl)silane used were observed by XRD, SEM, TEM, SANS, TGA, DSC, 29Si NMR, IR, cross-linking density, contact angle (water) and ethanol–water separation performance measurements. The membranes with an optimal amount of trichloro(alkyl)silane cross-linker of approximately 10–30% (w/w) showed better separation performance than the other reported conventional PDMS membranes in terms of the ethanol selectivity and flux from an aqueous feed containing 5% (w/w) ethanol. Among the membranes prepared, the membranes cross-linked with perfluorooctylsiloxane/octadecylsiloxane showed better separation performance than those membranes cross-linked with methylsiloxane/octylsiloxane.


Introduction

The poly(dimethylsiloxane) –Si(CH3)2O– (PDMS) membrane is one of the most studied polymeric membranes for the separation of gases and liquids because of its hydrophobic property, large free volume and high permeability to gases and organic molecules.1,2 The demand for new PDMS membranes with improved properties is increasing because of its effectiveness and reliability in industrial processes. The PDMS membrane is a cross-linked polymer in which important developments,3 such as (i) strain-induced crystallization through the control of chain stiffness or stereo-chemical structure, (ii) dangling chain networks, (iii) possible thermoplastic elastomers, (iv) bimodal network chain-length distributions, and (v) cross-linking in solution, could be possible.

It is generally prepared by cross-linking the hydroxyl-terminated-poly(dimethylsiloxane) liquid pre-polymer with a polymethylhydrosiloxane cross-linker4–12 through a condensation reaction between the hydroxyl end groups and hydride groups in the presence of a reduction catalyst liberating hydrogen. The properties of the PDMS membrane could be influenced greatly by the type of solvent used in the preparation, cross-linking reaction temperature, and curing conditions, including degassing prior to curing and curing at different temperatures9 as well as the membrane thickness.13 The thin membrane film coated on a porous support normally exhibits a less-dense structure with a larger amount of chain aggregates. Alkoxysilane such as tetraethoxysilane Si(OR)4 (ref. 14–22) is also used widely as a cross-linker, in which the hydroxyl end groups of the PDMS pre-polymer liquid are cross-linked multi-dimensionally with the ethoxy groups (–OR) of the monomolecular Si(OR)4 unit. By choosing trialkoxysilane R′Si(OR)3, where R′ is a phenyl23 or vinyl group,24 PDMS membranes with different properties as a result of different distributions of network chain lengths could be obtained. Recently, we prepared improved PDMS membranes via a cross-linking reaction between the hydroxyl terminated polydimethylsiloxane macromolecules and polymethylhydrosiloxane macromolecules along with a small amount of monomolecular cross-linker either of trichloro(n-octadecyl)silane or trichloro(1H,1H,2H,2H-perfluorooctyl)silane in toluene solvent, which showed better separation performance as compared to the typical PDMS membrane in the removal of volatile organics from aqueous streams.25 Some disadvantages of these monomolecular organosilane cross-linkers include the formation of aggregated silica particles by the hydrolysis of the organosilane with moisture present in the environment. By carrying out the reaction under a moisture-free nitrogen environment, the hydrolysis of the organosilane can be almost prevented.

In the present study, a new PDMS membrane series prepared by direct cross-linking hydroxyl terminated polydimethylsiloxane liquid with RSiCl3 molecules of different types in n-heptane solvent under a nitrogen environment were studied, wherein the alkyl chain, R, was varied as methyl CH3, octyl C8H17, perfluorooctyl C8H4F13, octadecyl C18H37. For each membrane series, the amount of cross-linker to pre-polymer was varied as 13[thin space (1/6-em)]:[thin space (1/6-em)]87, 33[thin space (1/6-em)]:[thin space (1/6-em)]67 and 50[thin space (1/6-em)]:[thin space (1/6-em)]50 (w/w) to compare the membranes at different cross-linking densities.

Experimental

Materials and methods

Trichloro(methyl)silane; trichloro(octyl)silane; trichloro(1H,1H,2H,2H-perfluorooctyl)silane; n-trichloro(octadecyl)silane; dibutyltindilaurate; chloroform-D (CDCl3); and hydroxy-terminated PDMS liquid of 18[thin space (1/6-em)]000–22[thin space (1/6-em)]000 cSt viscosity were purchased from Sigma-Aldrich Chemical Co. Membrane structure networks were produced from a cross-linking reaction of the hydroxyl end-linked PDMS pre-polymer liquid with an tricholoro(alkyl)silane through a condensation reaction between the hydroxyl end groups and chloride groups in the presence of the dibutyltindilaurate catalyst releasing HCl. The functionality of the cross-linker, which is the number of available sites per molecule for the cross-linking reaction, was 3 in each case. A homogenous polymer solution of approximately 20 cSt viscosity was prepared by dissolving the hydroxyl-terminated PDMS pre-polymer (20%, w/w) in n-heptane. n-Heptane was of analytical reagent grade and purchased from S.D Fine-Chem. Ltd., India. All the purchased chemicals were used as received. A required amount of trichloro(alkyl)silane cross-linker was added to the abovementioned solution and the solution was mixed well with stirring. Cross-link structures were formed by adding dibutyltindilaurate as a catalyst (3 wt% of catalyst with respect to the total mass of polymer and cross-linker) and keeping the solution at 40 °C for 45 minutes. All these steps were conducted in a nitrogen environment. The condensation reaction process between the PDMS pre-polymer liquid and trichloro(alkyl)silane is shown in Scheme 1. The cross-linked polymer was poured into a petridish and kept inside a closed chamber, and then allowed to cure at room temperature for 12 h by evaporating the solvent under flowing nitrogen through the chamber. This resulted in the formation of a dense rubbery membrane film. The membrane film was further cured in an oven at 80 °C for another hour. The membranes were prepared for the following studies: (i) alkyl carbon chain length of the trichloro(alkyl)silane cross-linker was varied as C1, C8 and C18 to examine the effect of the alkyl chain length of the cross-linker; (ii) two types of the C8-alkyl groups: octyl (C8H17) and perfluorooctyl (C8H4F13) were chosen to study the effect of hydrophobicity of the alkyl chain of the same length; (iii) for each cross-linker, three proportions of the cross-linker to the pre-polymer PDMS as 13[thin space (1/6-em)]:[thin space (1/6-em)]87, 33[thin space (1/6-em)]:[thin space (1/6-em)]67 and 50[thin space (1/6-em)]:[thin space (1/6-em)]50 (w/w) were taken for comparing their cross-linking densities. The synthesis compositions of all the membrane samples studied are given in Table 1.
image file: c5ra06433c-s1.tif
Scheme 1 Cross-linking reaction of PDMS with organosilanes.
Table 1 Synthesis composition of the membranes studied
Sample series Octadecyltrichlorosilane Perfluorooctyltrichlorosilane Octyltrichlorosilane Methyltrichlorosilane
PDMS-ODS1 PDMS-ODS2 PDMS-ODS3 PDMS-FOS1 PDMS-FOS2 PDMS-FOS3 PDMS-OS1 PDMS-OS2 PDMS-OS3 PDMS-MS1 PDMS-MS2 PDMS-MS3
Cross-linker (alkyltricholorosilane), wt% 13 33 50 13 33 50 13 33 50 13 33 50
Base polymer liquid (PDMS), wt% 87 67 50 87 67 50 87 67 50 87 67 50


Membrane morphology

The surface morphology of the membranes was analysed by acquiring the surface images using a scanning electron microscope instrument (LEO 1430VP) with 5–20 kV accelerating voltage. A Philips X'pert MPD system diffractometer was used to carry out the X-ray diffraction experiments of the samples over the 2θ range from 5 to 50 at a scanning rate of 2° minute−1. Transmission electron microscopy (JEOL JEM 2100) of the selected samples was performed to observe the poly(alkylsiloxane) particles in the membranes. Thin polymer films were coated on the copper girds and imaging was carried out at an 80–200 kV accelerating voltage.

Small-angle neutron scattering (SANS) study

The SANS study was carried out to investigate the nanostructure of membrane materials prepared. The measurements were carried on a SANS instrument at Dhruva reactor, BARC, Mumbai, India.26 The scattering measurements were carried out at 25 °C, over the wave vector (Q) range of 0.015–0.35 Å−1. Q is defined as (4π/λ)sin[thin space (1/6-em)]θ, where 2θ is the scattering angle and λ is the wavelength of incident radiation. The measurements were carried out using the samples kept in 2 mm path length Hellma quartz cells. Sample preparation was done in CDCl3 using the same procedure described in earlier studies.25 The data analysis was conducted after carrying the corrections from instrumental smearing and incoherent scattering. In general, the expression of the intensity of scattering, I(Q) is given by
 
I(Q) = ϕΔρ2VpP(Q)S(Q) (1)
ϕ is the number density of scattering unit, Vp is the scattering unit volume, Δρ2 is the contrast factor. The form factor, P(Q), reflects the distribution of scattering material in the scattering particle, while the structure factor, S(Q), is related to the spatial distribution of the scattering particles in the surrounding medium such as the solvent. When there are correlations of position or orientation between the scattering units, I(Q) is contributed from the both P(Q) and S(Q) factors. In such systems, the Ornstein–Zernike approach can be applied to describe the correlation from the direct interactions between the pair of interacting scattering units and the interactions through the other scattering units using the Lorentzian form of the scattering intensity to estimate the average distance between the interacting macromolecular segmental units of a cross-linked polymer. Thus, the scattering of the polymeric chain can be defined by the Ornstein–Zernike (OZ) formulation from the Lorentzian equation to estimate the average distance given by the correlation length, ξOZ.27 A Lorentzian form for the Q-dependence of the scattering intensity, I(Q) can be assumed as
 
image file: c5ra06433c-t1.tif(2)
where I(Q) is the forward scattering intensity at Q = 0.

The Debye–Anderson–Brumberger (DAB) equation is a Lorentzian-square term that can be used to calculate the scattering from a randomly distributed (non-particulate) two-phase system.27 A measure of the average spacing between two phase regions is given by ξDAB.

 
image file: c5ra06433c-t2.tif(3)

The scattering function given by the sum of a Lorentzian and a Lorentzian-squared term is the prediction of Random Field Ising Model as

 
image file: c5ra06433c-t3.tif(4)
where A and B are constants.

The Random Field Ising Model can describe the correlation from the interactions between the polymer chain segmental units, wherein the correlation length varies between tens and hundreds of angstroms.28 Furthermore, the Gaussian characteristics for the polymer chains can be studied using the Kratky plot [Q2I(Q) vs. Q], as described elsewhere.29

Thermal properties

Differential scanning calorimetric studies were carried out using a Mettler Toledo differential scanning calorimeter (DSC 822e) instrument at a heating rate of 5° minute−1 from −120 to 20 °C. About 5 mg of the samples were taken and heated from −140 °C to room temperature at a heating rate of 10 °C min−1 for the measurements. Thermogravimetric analysis (TGA) of all the prepared membranes was carried out with a NETZSCH TG 209F1 Libra TGA209F1D-0105-L instrument. About 10 mg of the samples were taken and heated from room temperature to 800 °C at a heating rate of 10 °C min−1 under a nitrogen environment for the measurements.

NMR, IR, contact-angle, cross-linking density and separation performance studies of the membranes

The solid state 29Si nuclear magnetic resonance measurements were carried out using a Bruker AVANCE-II 500 MHz instrument. Attenuated-total-reflectance infra-red (ATR-IR) spectroscopy studies were obtained with a Perkin-Elmer Spectrum GX (with a resolution of ±4 cm−1, incident angle 45°). The hydrophobicity of the membrane surface was measured using contact angle (water) measurements on DSA 100 Kruss GmbH instrument. The contact angles were measured 5–6 times on different areas of the each membrane surface to obtain average value. The swelling degree measurements of all the membranes were carried out in a carbon tetrachloride solvent. A membrane film of 1 cm2 area was cut and dipped in the solvent for 30 minutes. After that, the sample was taken out from the solvent and immediately wiped with tissue paper and the weight of the swollen membrane was measured. Each measurement was repeated three times and the average values were taken for the calculations. The percentage mass uptake of the swelled membrane sample was then obtained. The cross-linking density, Vc (mol cm−3 of polymer) was calculated from the volume fraction of the polymer (ϕp) in the swelled membrane using the Flory–Rehner equation, as described elsewhere.25

The separation performance of the membranes was evaluated through pervaporation experiments for the removal of organics from aqueous solutions. The experiments were carried out with laboratory fabricated unit described elsewhere9 at 70 °C using aqueous feed solution containing ethanol. The effective membrane area was 18.86 cm2. The downstream pressure was maintained at ∼2 mbar generated by a two stage vacuum pump (Alcatel, France) and measured using a MKS Series 925 pressure transducer with micro-pirani readout. The permeate was collected in a cold trap cooled in liquid nitrogen. Before each measurement, the pervaporation system was stabilized for one hour and the initial permeate of one hour was discarded. The feed and permeate concentrations were measured using an offline GC (Perichrom GC, France). The separation factor of the mixture is expressed as,

 
image file: c5ra06433c-t4.tif(5)

Results and discussion

Preparation of PDMS membranes by cross-linking with trichloro(alkyl)silane

A series of membrane sheets were obtained by the cross-linking of hydroxyl terminated PDMS pre-polymer liquid with RSiCl3 and the amount of RSiCl3 to the PDMS pre-polymer was varied as 13[thin space (1/6-em)]:[thin space (1/6-em)]87, 33[thin space (1/6-em)]:[thin space (1/6-em)]67 and 50[thin space (1/6-em)]:[thin space (1/6-em)]50 (w/w), as mentioned in Table 1. The preparation strategy for the cross-linked polymer membrane is shown in Scheme 1. Images of the membrane sample sheets were taken to compare the transparency of the membranes. These are shown in Fig. 1.
image file: c5ra06433c-f1.tif
Fig. 1 Images of the membrane samples.

Both the PDMS-MS and PDMS-OS membrane series cross-linked with trichloro(methyl)silane and trichloro(octyl)silane were very transparent at all the compositional (cross-linker[thin space (1/6-em)]:[thin space (1/6-em)]pre-polymer) ratios studied. Relatively, the film transparency was lower for the PDMS-FOS and PDMS-ODS samples cross-linked with larger amounts (33–50 wt%) of trichloro(perfluorooctyl)silane or trichloro(octadecyl)silane. The highest opaque among the membrane films was the sample made with 50 wt% of trichloro(octadecyl)silane. The film opaqueness is expected if aggregates or clusters are formed in the membrane film. This is possible if some of the trichloro(alkyl)silane molecules themselves polymerized to poly(alkylsiloxane) as a result of the hydrolysis reaction of trichloro(alkyl)silane with the moisture present in the system environment. The formation of poly(alkylsiloxane) upon the hydrolysis of trichloro(alkyl)silane, followed by the condensation and polymerization reactions of the hydrolysed species is well-known,30 as shown in reactions 1, 2 and 3 of Scheme 2.


image file: c5ra06433c-s2.tif
Scheme 2 Formation of poly(alkylsiloxane) upon hydrolysis of trichloro(alkyl)silane, followed by condensation and polymerization.

XRD patterns of the PDMS membrane samples, as shown in Fig. 2, also indicated a change in membrane structure after cross-linking with trichloro(alkyl)silane. A broad diffraction peak at 2θ value of about 12.1° was observed for the samples prepared from the cross-linking reaction with small amounts of trichloro(alkyl)silane (13 wt%), suggesting the partly crystalline nature of PDMS. The intensity of the peak was lower for the samples obtained from the reaction with a higher amount (33–50 wt%) of the trichloro(methyl)silane, while this peak disappeared for the samples obtained from the reaction with 33–50 wt% of the trichloro(octyl)silane, trichloro(perfluorooctyl)silane, or trichloro(octadecyl)silane.


image file: c5ra06433c-f2.tif
Fig. 2 XRD patterns of the all samples.

The XRD results suggested that the PDMS membranes formed by crosslinking with trichloro(methyl)silane had crystalline regions even from the reaction with 50 wt% trichloro(methyl)silane. This is in contrast to the others, which exhibited a completely amorphous nature of PDMS after the reaction with 33–50 wt% trichloro(alkyl)silane. On the other hand, the sample cross-linked with 33–50 wt% of trichloro(octadecyl)silane showed an additional broad peak at about 21.3°, which is referred to as poly(octadecylsiloxane).30 Changes in membrane structure in terms of the microstructure of the samples cross-linked with different amounts of trichloro(octadecyl)silane were clearly distinguishable in the SEM images, as shown in Fig. 3(A1–A3). The PDMS-ODS3 sample cross-linked with 50 wt% of trichloro(octadecyl)silane showed a rugged surface in micrometre-length-scale compared to relatively smooth surface of the PDMS-ODS1 and PDMS-ODS2 samples prepared with 13 and 33 wt% trichloro(octadecyl)silane. All other sample series (PDMS-MS, PDMS-FOS and PDMS-OS) cross-linked with trichloro(methyl)silane trichloro(octyl)silane and trichloro(perfluorooctyl)silane exhibited a relatively smoother surface than the PDMS-ODS samples. The rugged surface morphology of PDMS-ODS3 may be related to the hybrid structure formed by PDMS and poly(octadecylsiloxane) components. The poly(octadecylsiloxane) is crystalline and so it is harder than the PDMS component. Therefore, it is likely that poly (octadecylsiloxane) crystalline components in excess are separated from the PDMS components. Indeed, nanoscale particles presumably of the poly(octadecylsiloxane) material were clearly visible by TEM in the samples prepared by cross-linking with 33–50 wt% of the trichloro(octadecyl)silane.


image file: c5ra06433c-f3.tif
Fig. 3 A1, 2, 3 are SEM surface images, while B1, 2, 3 are TEM images of PDMS-ODS1, 2, 3. respectively.

The TEM images of the PDMS-ODS samples are shown in Fig. 3(B1–B3). Large aggregations of these nanoparticles were clearly observed in the TEM image of the PDMS-ODS3 sample cross-linked with 50 wt% of trichloro(octadecyl)silane. Although such large nanoparticle aggregates were not observed in the other membrane series, the formation of nanoparticles in the membrane series cross-linked with excess trichloro(alkyl)silane was evident from the TEM studies of the samples. SANS measurements of the samples were performed to probe membrane nanostructure in detail.

Nanostructure of the membranes as studied by SANS

As shown in the preparation route (Scheme 1), the PDMS membrane structure may comprise two characteristic segments of dimethylsiloxane and alkylsiloxane. The dimethylsiloxane group may be considered as a soft segment because it is being derived from the PDMS pre-polymer liquid precursor. On the other hand, the alkylsiloxane group may be of various types and a hard structure as it is resulted from the cross-linking reaction directly with molecular trichloro(alkyl)silane or with the derived species from hydrolysis, condensation and polymerization reactions of trichloro(alkyl)silane, as shown in Scheme 2. Thus, the cross-linked membrane structure may consist of soft and hard segments consisting of dimethylsiloxane and alkylsiloxane groups. The SANS study was performed on the membrane samples to examine the nanoscale structure morphology on the basis of their scattering signatures. The SANS patterns for the membranes at room temperature over the period of 8–12 h were measured to collect statistically meaningful data. Fig. 4 shows the SANS patterns. The SANS pattern can display scattering from both the soft and hard segments of the polymer membrane. The correlations of the position or orientation between the soft segmental units of the polymer membrane structure are described by the Ornstein–Zernike approach, in which the I(Q) is contributed from the both P(Q) and S(Q) factors. The Ornstein–Zernike approach estimates the average distance between the soft macromolecular segmental units of a cross-linked polymer using the Lorentzian form of the scattering intensity. On the other hand, a Lorentzian-square term as Debye–Anderson–Brumberger equation given in eqn (2) can be used to calculate the scattering from a randomly distributed (non-particulate) two-phase system characterized by a single correlation length scale. This correlation length scale is of a much larger value than the value obtained by the Ornstein–Zernike approach. Using Lorentzian-square term of Debye–Anderson–Brumberger equation, the correlation length between the hard segmental units of the cross-linked polymer may be described because the correlation length scale between the hard segments of the polymer can be higher considering their less-flexible nature. Indeed, as shown in Fig. 4, the SANS data of the cross-linked polymer samples were fitted excellently with the scattering function given by the sum of a Lorentzian term from Ornstein–Zernike model and a Lorentzian-squared term from Debye–Anderson–Brumberger model. As expected, the correlation length ξOZ corresponding to the soft polymer segments were smaller by about 7–12 Å than the correlation length ξDAB values (20–63 Å) of the hard polymer segments (Table 2). Commonly for each membrane series, the ξDAB value increased for the membrane with increasing cross-linking degree with trichloro(alkyl)silane.
image file: c5ra06433c-f4.tif
Fig. 4 SANS data of the cross-linked polymer membrane samples of the lowest and highest alkylsiloxane content, fitted excellently with the scattering function given by the sum of a Lorentzian term from Ornstein–Zernike model and a Lorentzian-squared term from Debye–Anderson–Brumberger model.
Table 2 Correlation length, ξ, and the intensity of scattering, I(0), obtained by Ornstein–Zernike and Debye–Anderson–Brumberger model
Sample details Ornstein–Zernike Debye–Anderson–Brumberger
ξOZ, Å I(0)OZ, cm−1 ξDAB, Å I(0)DAB, cm−1
PDMS-ODS1 10.1 0.7 24.2 1.4
PDMS-ODS2 11.9 1.1 24.3 1.8
PDMS-ODS3 11.4 1.1 62.9 7.6
PDMS-FOS1 9.4 0.4 31.8 1.0
PDMS-FOS2 10.1 0.5 43.8 2.1
PDMS-FOS3 8.9 0.4 46.5 3.2
PDMS-OS1 7.5 0.3 19.9 0.5
PDMS-OS2 9.3 0.6 50.6 23.9
PDMS-OS3 7.0 0.5 52.7 31.8
PDMS-MS1 7.6 0.4 44.0 1.0
PDMS-MS2 7.3 0.3 44.6 1.2
PDMS-MS3 8.7 0.6 46.4 2.1


Kratky plots [Q2I(Q) vs. Q] for the membranes (as shown in Fig. 5) were compared to identify the structural differences in Gaussian characteristics of the scattering chains. All the plots were inclined to a horizontal asymptote implying the Gaussian statistics of the polymer chain.


image file: c5ra06433c-f5.tif
Fig. 5 Kratky plots [Q2I(Q) vs. Q] for the membranes of the lowest and highest alkylsiloxane content.

Two important observations from the Kratky plots are (1) the Q value at which the plateau value reached was lower for the PDMS-ODS membrane series than the other membrane series and (2) a peak at a low Q value in each of PDMS-OS2 and PDMS-OS3 membrane was clearly observed. This indicated that the Gaussian segmental length of the polymer chain networks was longer for the PDMS-ODS membrane series compared to the other membrane series because the plateau Q value is inversely proportional to the Gaussian segmental length. On the other hand, the low Q peak observed in case of PDMS-OS2 and PDMS-OS3 may correspond to polymer mesh size or aggregated cluster of polymer chains formed by localized cross-linking. Such a low Q peak was also observed in some PDMS membranes.12 Upon closer examination of the Kratky plots, a shoulder peak at low Q was apparently present in the PDMS-ODS3, all the PDMS-FOS series and all the PDMS-MS series, implying some degree of polymer chain aggregation in most of the samples.

TGA, DSC and cross-linking density measurements

The thermal stability of the membrane samples, as measured by TGA under nitrogen atmosphere, is described in Fig. 6. Among the sample series, the PDMS-FOS series decomposed relatively faster with onset and end point temperatures at about 300 °C and 590 °C, respectively. In contrast, for PDMS-ODS sample series, the end point temperatures were extended to about 670 °C from an onset temperature of about 250 °C. The PDMS-OS and PDMS-MS series had the decomposition temperature range 270–650 °C and 260–620 °C, respectively. As shown in the DTG (derivative of thermogravimetric analysis) plots (Fig. 6 inset), the decomposition losses of the samples were mostly at about 500 °C for all the PDMS-ODS and PDMS-FOS samples. However, two major decomposition steps with median peaks at about 400 °C and 520 °C were observed for the PDMS-OS and PDMS-MS samples with higher alkylsiloxane content (PDMS-OS2, PDMS-OS3, PDMS-MS2 and PDMS-MS3). This observation would mean that the base PDMS polymer chains were modified differently by cross-linking with the different types of alkylsiloxane.
image file: c5ra06433c-f6.tif
Fig. 6 TGA and DTG plots of the membrane samples.

Fig. 7 shows DSC plots of all the alkylsiloxane cross-linked PDMS membrane samples. The glass transition temperatures (Tg) for all the membranes were similar at about −100 °C while the melting peaks (Tm) were in the temperature range from −48 °C to −40 °C.


image file: c5ra06433c-f7.tif
Fig. 7 DSC plots of the membrane samples.

The presence of both the Tg and Tm peaks in the membranes indicated the semi-crystalline nature of the membrane material because the Tg peak corresponds to the amorphous region, while the Tm peaks correspond to the crystalline region. For each membrane series, the intensity of the Tm peak for the membrane decreased by an increase in the alkylsiloxane content. Furthermore, shifts of the Tm peaks towards lower values were observed for the PDMS-ODS (−40 °C to −45 °C), PDMS-FOS (−40 °C to −48 °C) and PDMS-OS (−42 °C to −44 °C) membranes of higher alkylsiloxane contents except the PDMS-MS samples, which had the same Tm at about −42 °C. The decrease in the intensity and shifts to lower value of the Tm peak indicated that the crystallinity of the initial PDMS structure was decreased by cross-linking with alkylsiloxane. For the cross-linked structure, the segmental mobility of the polymer chain is expected to be decreased, resulting in a decrease in heat capacity.

The density of the membrane structure in terms of the cross-linking density (Vc) was examined by the membrane swelling in carbon tetrachloride. From the swelling experiments, the volume fraction of polymer (ϕp) was estimated. The Vc values were calculated from the ϕp values using the Flory–Rehner equation for all the membrane series. The Mc value for the sample was calculated based on the relation, Mc = density × Vc−1, in which the density of the PDMS membrane was taken as the density of pure polydimethylsiloxane material, 0.97 g cm−3.31 The results are given in Table 3.

Table 3 Volume fraction of polymer (ϕp), cross-linking density (Vc) and molecular weight between the crosslinks (Mc) of the membranes
Membrane ϕp Vc × 10−5 mol cm−3 Mc g mol−1
PDMS-ODS1 0.139 8.3 11[thin space (1/6-em)]563
PDMS-ODS2 0.204 19.0 5098
PDMS-ODS3 0.233 25.8 3761
PDMS-FOS1 0.176 13.8 7042
PDMS-FOS2 0.227 24.2 4011
PDMS-FOS3 0.258 32.6 2972
PDMS-OS1 0.147 9.4 10[thin space (1/6-em)]268
PDMS-OS2 0.225 23.8 4068
PDMS-OS3 0.315 53.3 1820
PDMS-MS1 0.109 5.1 18[thin space (1/6-em)]844
PDMS-MS2 0.127 7.0 13[thin space (1/6-em)]857
PDMS-MS3 0.133 7.7 12[thin space (1/6-em)]570


Among all the membranes, the Vc value 5.1 × 10⁻⁵ mol cm−3 of the PDMS-MS1 was the lowest. The density of the membrane structure was affected by the type of trichloro(alkyl)silane used as well as the trichloro(alkyl)silane concentration. The membrane structure density in terms of the ϕp, Vc and Mc values was the highest for the PDMS-FOS1 at a low loading (13 wt%) of trichloro(alkyl)silane. In contrast, at a high loading (50 wt%) of trichloro(alkyl)silane, the highest Vc 53.3 × 10⁻⁵ mol cm−3 with the corresponding Mc = 1820 g mol−1 was observed for the PDMS-OS3, which was about 10-times that of the corresponding value of PDMS-MS1. PDMS-MS sample series exhibited a relatively loose membrane structure with a Vc value range of 5.1–7.7 × 10⁻⁵ mol cm−3.

29Si NMR and FT-IR studies

The solid state 29Si NMR spectra of the modified PDMS membrane series are shown in Fig. 8. All the spectra showed a prominent peak at −22 ppm, which was assigned as the repeating D2 units (dimethylsiloxane units) of the polysiloxane chain32,33 and two small peaks at −57 ppm and −68 ppm. The 29Si resonance at −57 ppm and −68 ppm of the spectra can be assigned, respectively, to the general alkylsiloxane structures of (HO) (R)Si(OSi)2 [isolated silanol, T2 units] and (R)Si(OSi)3 [siloxane, T3 units], where R = alkyl.30 Although the resonance peaks of the T units were weak for some samples with a low alkylsiloxane content, the T resonance peaks were well-resolved for most of the samples. The observation of the presence of some T2 units in the spectra indicates that the portions of network structures exhibit two cross-links with isolated silanols, whereas the presence of T3 units in the spectra indicating more network structures of three cross-links. Geminal silanol group (HO)2(R)Si(OSi) (T1 unit) was absent in all the samples.
image file: c5ra06433c-f8.tif
Fig. 8 Solid state 29Si NMR spectra of the PDMS membrane series.

The infrared spectra of the membrane series are given in Fig. 9. A broad absorption band at about 3230 cm−1 due to O–H stretching vibrations of the absorbed moisture, was observed in all the spectra. The absorption band due to the O–H the stretching vibration can be at a higher wave number range if they are from structural O–H group of the materials, such as silanol alkylsiloxane structures (HO) (R)Si(OSi)2 of the membranes. Depending on the nature of OH groups, such as free OH groups, hydrogen bonded pairs (OH⋯HO), and perturbed OH, various structural OH absorption bands can be present in the spectra.34


image file: c5ra06433c-f9.tif
Fig. 9 Infrared spectra of the PDMS membrane series.

This is what has been observed in all the spectra, which showed three weak bands at about 3600 cm−1, 3723 cm−1 and 3820 cm−1 due to the silanols (T2 units) in the network structure of the membranes. The bands in the wavenumber range of 1500–1690 cm−1 were assigned as (Si)O–H⋯O(Si) vibrations, in which the (Si)O–H group forms hydrogen bonds with the oxygen of the siloxanes and bending mode of absorbed water. Such water and hydroxyl-related bands were observed in the IR spectra of silicate glasses.35 The strong absorption band observed at 800 cm−1 is due to the symmetric stretching vibration of Si–O–Si, rocking alkyl group and stretching vibration of Si–C bond of the alkylsiloxane structure of the membranes. The asymmetric stretching vibration of the Si–O–Si (siloxane) bonds for the membranes was observed at 1020 and 1090 cm−1. Long chains of the D siloxane units generally show two distinct bands at 1020 and 1090 cm−1.36 The other absorption band due to the O–Si–C linkage can also interfere at this range.37 The Si-alkyl group from the D and T units was identified by two overlapping absorption bands at about 1240–1260 cm−1. This may be due to the chemical cross-linking of the hydroxyl group of the polymer precursor with trichloro(alkyl)silane.

Hydrophobicity and separation performance of the membranes

Contact angle (water) measurements were carried out to check the hydrophobicity of the membrane. The results are shown in Fig. 10. The PDMS-FOS membrane prepared by cross-linking with the trichloro(perfluorooctyl)silane showed the highest contact angle (water) of 120° than the other cross-linkers. This may be due to the highly hydrophobic nature of the perfluorooctyl chain present in the membrane structure. Based on the contact angle values, the order of hydrophobicity of membrane was followed as PDMS-FOS > PDMS-ODS > PDMS-OS > PDMS-MS.
image file: c5ra06433c-f10.tif
Fig. 10 Contact angle (water) of the PDMS samples.

Furthermore, the membrane prepared with trichloro(alkyl)silane of a longer alkyl chain showed a higher contact angle, which indicated that the long alkyl chain in the structure helped increase the hydrophobicity of the membrane.

On the other hand, a larger amount of cross-linker was not helpful in increasing the hydrophobicity. The PDMS-FOS1 and PDMS-FOS2 had a similar contact angle of 120°, which are slightly higher than the PDMS-FOS3 value of 117°. The same trend was observed for the PDMS-ODS series, in which both the PDMS-ODS1 and PDMS-ODS2 showed a contact angle of 113°, while the PDMS-ODS3 had a value of 110°. In the case of the PDMS-OS and PDMS-MS series, the contact angle decreased from 111° to 105° and 108° to 103°, respectively, with increasing cross-linker amount. This may be due to secondary reaction of trichloro(alkyl)silane hydrolysis when used in excess forming poly(alkyl)siloxane inside the membrane, as discussed above. The separation performance of the membranes in terms of the ethanol selectivity and flux from an aqueous feed containing 5% (w/w) ethanol was examined.

Fig. 11 shows the performance comparison of the present PDMS membranes prepared by trichloro(alkyl)silane cross-linking and the other conventional PDMS membranes prepared by cross-linking with polymethyl(hydro)siloxane. The highest ethanol/water separation factor of 18 and normalized permeate flux of 183 g m−2 h−1 (flux normalized per unit membrane thickness of 100 μm) was observed for the PDMS-FOS1 sample, while a slight decrease in the ethanol/water separation factor 17, but a slight increase in flux, 190 g m−2 h−1, was observed for the PDMS-ODS1 sample. Both the PDMS-OS1 and PDMS-MS1 samples exhibited a higher flux of about 210 g m−2 h−1 but with a moderate separation factor of 14. There was a decrease in the membrane performance for all the membranes series prepared with increasing amount of cross-linker loading, which may be due to poly(alkyl)siloxane particle formation in the membrane film rather than cross-linking as discussed above. The details of the membrane performance studies of all the membrane series in ethanol–water as well as butanol–water separation will be published elsewhere. It can be seen from Fig. 11 that the present PDMS membranes prepared with an optimal loading of trichloro(alkyl)silane cross-linker performed better than the other reported conventional PDMS membranes.


image file: c5ra06433c-f11.tif
Fig. 11 Comparison of the present PDMS membranes with other reported conventional PDMS membranes. Experimental conditions: Present work: feed = 5% (w/w) of ethanol in water, operating temperature = 70 °C. Ref. 38: feed = 1.5% (w/w) of ethanol in water, operating temperature = 66 °C. Ref. 39: feed = 6% (w/w) of ethanol in water, operating temperature = 65 °C. Ref. 40: feed = 7% (w/w) of ethanol in water, operating temperature = 22 °C. All the membrane fluxes were normalized to a membrane thickness of 100 μm.

Conclusions

A new preparation method of the PDMS membrane by cross-linking the hydroxyl-terminated-poly(dimethylsiloxane) oligomer with a molecular trichloro(alkyl)silane through condensation reaction between the hydroxyl and chloride groups in n-heptane solvent under a nitrogen environment liberating HCl, is reported. The membranes were prepared from the reaction system, in which the trichloro(alkyl)silane cross-linker was varied as trichloro(methyl)silane, trichloro(octyl)silane, trichloro(1H,1H,2H,2H-perfluorooctyl)silane and trichloro(n-octadecyl)silane and for each cross-linker, three proportions of the cross-linker to the base polymer liquid, as 13[thin space (1/6-em)]:[thin space (1/6-em)]87, 33[thin space (1/6-em)]:[thin space (1/6-em)]67 and 50[thin space (1/6-em)]:[thin space (1/6-em)]50 (w/w), were taken for a comparison of their cross-linking densities. XRD, SEM, TEM, SANS, TGA, DSC, 29Si NMR, IR, cross-linking density, contact angle (water), and ethanol–water separation performance measurements were performed to assess the prepared membranes.

The membranes formed by crosslinking with trichloro(methyl)silane had crystalline PDMS regions even from the reaction with 50 wt% trichloro(methyl)silane. This is in contrast to the others, which exhibited a completely amorphous nature of PDMS after the reaction with 33–50 wt% trichloro(alkyl)silane. The additional presence of poly(alkylsiloxane) groups from the self-condensation of trichloro(alkyl)silane was observed in the membranes formed with 33–50 wt% of trichloro(alkyl)silane. The cross-linked network structure comprising the dimethylsiloxane network structures of two cross-links and alkylsiloxane network structure of two or three cross-links were observed by 29Si NMR and IR spectra. Thus, the PDMS membrane structure comprised two characteristic segments of dimethylsiloxane and alkylsiloxane units. The dimethylsiloxane networks are long chain polymeric networks that may be considered soft segment because it is being derived from the PDMS pre-polymer liquid while the alkylsiloxane networks are short chain networks and a hard structure resulting from the cross-linking reaction directly with molecular trichloro(alkyl)silane or with the species derived from hydrolysis, condensation and polymerization reactions of trichloro(alkyl)silane. SANS models of the Ornstein–Zernike approach and Debye–Anderson–Brumberger equation described the soft and hard segments comprising dimethylsiloxane and alkylsiloxane groups of the cross-linked membrane structure. The hard segment of the membrane was increased in the membrane samples formed with a larger amount of trichloro(alkyl)silane. Changes in the thermal properties and structure density of the membranes depending on concentration and type of trichloro(alkyl)silane used were also observed.

An optimal amount of trichloro(alkyl)silane cross-linker of about 10–30% (w/w) was required to prepare uniformly homogenous membrane and these membranes showed better separation performance than the other reported conventional PDMS membranes in terms of the ethanol selectivity and flux from an aqueous feed containing 5% (w/w) ethanol.

Acknowledgements

Financial assistance to carry out this study from the Science and Engineering Research Board, the Department of Science & Technology (SR/S1/PC-09/2011) and the CSIR network project grants on membranes (9/1/CS/CSMCRI(1)/2012-13-PPD) under the 12th five-year-plan, Government of India, are gratefully acknowledged. CSIR-CSMCRI registration number – 046/2015. The Analytical Discipline Centralized Instrument Facility, CSIR-CSMCRI is also gratefully acknowledged for providing the analytical instrument facility for carrying out the present study. A. M. Kansara is thankful to AcSIR for the Ph.D. registration.

Notes and references

  1. M. Mulder, Basic Principles of Membrane Technology, Kluwer, Dordrecht, The Netherlands, 2nd edn, 1996 Search PubMed.
  2. W. S. W. Ho and K. K. Sirkar, Membrane Handbook, Van Nostrand Reinhold, New York, 1992 Search PubMed.
  3. J. E. Mark, Acc. Chem. Res., 2004, 37, 946 CrossRef CAS PubMed.
  4. M. Bennett, B. J. Brisdon, R. England and R. W. Field, J. Membr. Sci., 1997, 137, 63 CrossRef CAS.
  5. S. Tanaka, Y. Chao, S. Araki and Y. Miyake, J. Membr. Sci., 2010, 348, 383 CrossRef CAS.
  6. Y. Fu, H. Qui, K. Liao, S. J. Lue, C. Hu, K. Lee and J. Lai, Langmuir, 2010, 26(6), 4392 CrossRef CAS PubMed.
  7. T. R. E. Simpson, Z. Tabatabaian, C. Jeynes, B. Parbhoo and J. L. Keddie, J. Polym. Sci., Part A: Polym. Chem., 2004, 42, 1421 CrossRef CAS.
  8. A. Camenzinda, T. Schweizer, M. Sztucki and S. E. Pratsinis, Polymer, 2010, 51, 1796 CrossRef.
  9. G. L. Jadav, V. K. Aswal and P. S. Singh, J. Membr. Sci., 2011, 378, 194 CrossRef CAS.
  10. S. J. Lue, C. Chien and K. P. O. Mahesh, J. Membr. Sci., 2011, 384, 17 CrossRef CAS.
  11. W. Ogieglo, H. Werf, K. Tempelman, H. Wormeester, M. Wessling, A. Nijmeijer and N. E. Benes, J. Membr. Sci., 2013, 437, 313 CrossRef.
  12. P. S. Singh, G. L. Jadav, V. K. Aswal, A. K. Das, S. Kumar, A. M. Kansara, S. G. Chaudhri and H. Brahmbhatt, J. Appl. Polym. Sci., 2015, 132, 41461 Search PubMed.
  13. G. L. Jadav, V. K. Aswal, H. Bhatt, J. C. Chaudhari and P. S. Singh, J. Membr. Sci., 2012, 415–416, 624 CrossRef CAS.
  14. L. Liu, Z. Jiang, F. Pan, F. Peng and H. Wu, J. Membr. Sci., 2006, 279, 111 CrossRef CAS.
  15. H. Wu, L. Liu, F. Pan, C. Hu and Z. Jiang, Sep. Purif. Technol., 2006, 51, 352 CrossRef CAS.
  16. F. Xiangli, Y. Chen, W. Jin and N. Xu, Ind. Eng. Chem. Res., 2007, 46, 2224 CrossRef CAS.
  17. Y. Huang, P. Zhang, J. Fu, Y. Zhou, X. Huang and X. Tang, J. Membr. Sci., 2009, 339, 85 CrossRef CAS.
  18. W. Wei, S. Xia, G. Liu, X. Dong, W. Jin and N. Xu, J. Membr. Sci., 2011, 375, 334 CrossRef CAS.
  19. S. S. Shahrabi, H. R. Mortaheb, J. Barzin and M. R. Ehsani, Desalination, 2012, 287, 281 CrossRef.
  20. I. Ahmed, N. F. C. Pa, M. Ghazali, M. Nawawi and W. A. W. A. Rahman, J. Appl. Polym. Sci., 2011, 122, 2666 CrossRef CAS.
  21. J. Li, S. Ji, G. Zhang and H. Guo, Langmuir, 2013, 29, 8093 CrossRef CAS PubMed.
  22. S. Li, F. Qin, P. Qin, M. N. Karim and T. Tan, Green Chem., 2013, 15, 2180 RSC.
  23. X. Zhan, J. Li, J. Huang and C. Chen, Appl. Biochem. Biotechnol., 2010, 160, 632 CrossRef CAS PubMed.
  24. J. Gu, Y. Bai, L. Zhang, L. Deng, C. Zhang, Y. Sun and H. Chen, Int. J. Polym. Sci., 2013, 2013, 529474,  DOI:10.1155/2013/529474.
  25. G. L. Jadav, V. K. Aswal and P. S. Singh, J. Mater. Chem. A, 2013, 1, 4893–4903 CAS.
  26. V. K. Aswal and P. S. Goyal, Curr. Sci., 2000, 79, 947 Search PubMed.
  27. J. Kohlbrecher, SASfit: a program for fitting simple structural models to small angle scattering data, PSI, Switzerland, http://kur.web.psi.ch/sans1/SANSSoft/sasfit.html Search PubMed.
  28. M. Lin, S. Sinha, J. Drake, P. Thiyagarajan, X. Wu and H. Stanley, J. Phys. IV, 1993, 03(C8), C8-109–C8-115 Search PubMed.
  29. A. Guinier and G. Fournet, Small Angle Scattering of X-Rays, Wiley, New York, 1955 Search PubMed.
  30. A. N. Parikh, K. Mueller, M. A. Schivley, D. L. Allara, E. Koo, K. Seshadri and D. Aurentz, J. Am. Chem. Soc., 1997, 119, 3135 CrossRef CAS.
  31. J. E. Mark, Polymer Data Handbook, Oxford University Press, 2009 Search PubMed.
  32. D. P. Dworak and M. D. Soucek, Macromol. Chem. Phys., 2006, 207, 1220 CrossRef CAS.
  33. V. Belot, R. J. P. Corriu, D. Leclercq, P. H. Mutin and A. Vloux, J. Polym. Sci., Part A: Polym. Chem., 1992, 30, 613 CrossRef CAS.
  34. B. A. Morrow and A. J. McFarlan, J. Phys. Chem., 1992, 96, 1395 CrossRef CAS.
  35. A. M. Efimov, V. G. Pogareva and A. V. Shashkin, J. Non-Cryst. Solids, 2003, 332, 93 CrossRef CAS.
  36. L. J. Bellamy, The Infrared Spectra of Complex Molecules, Chapman and Hall, London, 1975, p. 374 Search PubMed.
  37. G. Socrates, IR Characteristic Group Frequencies, Wiley, New York, 1980 Search PubMed.
  38. Y. Mori and T. Inaba, Biotechnol. Bioeng., 1990, 36, 849 CrossRef CAS PubMed.
  39. B. Moermans, W. D. Beuckelaer, I. F. J. Vankelecom, R. Ravishankar, J. A. Martens and P. A. Jacobs, Chem. Commun., 2000, 2467 RSC.
  40. M. D. Jia, K. V. Peinemann and R. D. Behling, J. Membr. Sci., 1992, 73, 119 CrossRef CAS.

This journal is © The Royal Society of Chemistry 2015