Crystal orientation dependence of crack growth and stress evolution in single crystal nickel: a molecular dynamics simulation-based cohesive zone model

Yuan Qia, Wen-Ping Wu*ab, Yun-Bing Chena and Ming-Xiang Chenab
aDepartment of Engineering Mechanics, School of Civil Engineering, Wuhan University, Wuhan, China. E-mail: wpwu@whu.edu.cn; Fax: +86-27-68775496; Tel: +86-27-68775496
bState Key Laboratory of Water Resources & Hydropower Engineering Science, Wuhan University, Wuhan, China

Received 9th April 2015 , Accepted 27th July 2015

First published on 29th July 2015


Abstract

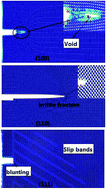
The crack growth and stress evolution of single crystal nickel under three different crystal orientations (X[100], Y[010], Z[001]; X[110], Y[[1 with combining macron]10], Z[001]; X[111], Y[[1 with combining macron]10], Z [[1 with combining macron][1 with combining macron]2]) were studied by introducing a cohesive zone model (CZM) based on molecular dynamics (MD) simulation. The results indicated that different crystal orientations have significant effect on the fracture mechanisms and stress distribution characteristics. Under the X[100], Y[010], Z[001] orientation, void nucleation and growth was observed during the crack propagation; under the X[110], Y[[1 with combining macron]10], Z[001] orientation, atomic configurations basically remained unchanged throughout the crack growth, which represented a brittle process; dissimilarly, blunting and slip bands occurred at the front of the crack tip for the X[111], Y[[1 with combining macron]10], Z[[1 with combining macron][1 with combining macron]2] orientation. These different mechanisms resulted in different stress distributions along the crack path and crack growth rates. Moreover, based on the calculation of the CZM, the relationship between stress and opening displacement was obtained, which provided useful information for understanding the crystal orientation dependent on the atomic-scale fracture mechanisms and associated mechanical properties.

1. Introduction

Fracture is a universal and complex problem which spans many disciplines in the physical sciences and engineering. Classical theory of continuum fracture and some empirical formulas at the macroscopic level are well established and utilized.1–4 Yet, on the atomic scale, crack growth is in fact a progressive process of material degeneration, and the geometry feature of the crack tip would cause a non-physical stress singularity. Macroscopic fracture mechanical theories based on phenomenological hypotheses, hereby, are no longer sufficient and even improper to resolve the very essence of the physical mechanisms. Hence, more micro-level investigations are naturally demanded.

Molecular dynamics (MD) simulation have been proven to be a useful tool for its modeling atomic scale failure process and analyzing stress evolution around the crack tip from an atomistic standpoint.5–7 Recently, many fracture events have been carried out by utilizing the molecular dynamic simulations, which includes dynamic fracture instability,8,9 strain rate, size and temperature dependency on crack propagation,10–13 microstructure and stress field near crack tip,14–16 brittle and ductile behaviors,12,17–19 intergranular and transgranular crack propagation behavior,20 etc. One of the critical elements that influence fracture behavior and metal strength is the lattice orientation. Zhang and Ghosh15 investigated the interaction of dislocation networks and twins and their variances in different crystal orientations on atomic level. Abraham and Broughton17 studied the cleavage direction by setting three different pre-crack orientations, and indicated that atomic stress rather than surface energy controls brittle crack growth. Xie et al.21 fabricated three cracks and studied the influence of crystal orientation of twin formation from crack tip. Mei et al.22 studied the surface energy and slip planes in rare metal tantalum (Ta) with different crack orientations, and proposed a new criterion to distinguish brittle from ductile fracture. These studies indicated that the crystal orientations have an important effect on the microstructure evolution and failure mechanisms of materials.

Due to material failure can be determined by the stresses and strains of strength theory, related research has indicated that atomic stress played a controlling role in nanoscale fracture, it is essential to consider the stress state during crack growth.7,17 However, when considering the stress singularity at crack-tip, it was inappropriate to calculate directly the stress state near the crack-tip. The cohesive zone model (CZM), as a method for calculation of local properties in the field of fracture mechanics, has been extensively used because it avoided the stress singularity at the crack-tip and represented the physics of the fracture process at the atomic scale.23–25 Especially, the CZM can adequately track crack propagation dynamics and obtain the constitutive behavior (traction–displacement relationship) of the fracture, which was not obtained only by MD simulation.26,27 Therefore, it was effective and of interesting to apply a MD-based CZM for analyzing the influence of crystal orientation on the stress state and microstructure evolution near the crack-tip and the associated fracture mechanisms.

In this study, the crack-tip stress distribution and fracture mechanisms were investigated using a MD-based CZM in a pre-crack single crystal nickel with different orientations. The objective of the present work is to reveal the influence of crystal orientation on the crack propagation and fracture mechanisms. Meanwhile, based on the calculation of CZM, the relationship between crack-tip stress field and microstructure evolution, stress and opening displacement as the crack propagates were determined from an atomic physics standpoint.

2. Modeling and simulation

2.1. Model geometry and simulation process

In this paper, MD-based CZM are performed to study the influence of the orientation on the crack propagation and fracture mechanisms in a pre-crack single crystal nickel. The geometry of the system of the crack propagation is shown in Fig. 1a. A pre-crack with 1/10 of the size of the X-dimension is inserted on the left edge of the sample along the X direction by removing atoms. That is, the size of X-dimension is much larger than the crack length so that the edge effects are eliminated for most of the crack growth of interest. The sample dimension in the X-axis is chosen to be sufficiently long so that steady-state crack propagation is obtained during MD simulations and the right side of the crystal is fixed for motions in X-direction to limit boundary effects. The top and bottom 2-layer atoms, which have a thickness of potential cut-off distance, are fixed. Periodic boundary conditions are formulated in the Z direction, and non-periodic boundary conditions are applied in the X and Y directions. To study the crystal orientation effect, the samples with three different orientations (X[100], Y[010], Z[001]; X[110], Y[[1 with combining macron]10], Z[001]; X[111], Y[[1 with combining macron]10], Z[[1 with combining macron][1 with combining macron]2]) are set up as shown in Table 1, and the initial crack fronts of these three samples with different orientations are along the [100], [110], [111] direction, respectively. In the present MD simulations, the embedded-atom-method (EAM) potential provided by Mishin et al.28 is adopted, which has previously been successfully applied to simulate the failure process of face-centered cubic (FCC) single crystal nickel.10,11,14,27,29
image file: c5ra06370a-f1.tif
Fig. 1 (a) Atomic model of an FCC single crystal nickel containing a single edge crack, (b) schematic of region used to calculate local facture properties and obtain the cohesive behavior mechanism from MD simulation (the width of one cell is the lattice constant of nickel).
Table 1 Atomic configuration for the crack models with three different orientations (a = 3.52 Å is the lattice constant of nickel)
Orientation (X, Y, Z) Model size (X, Y, Z) Crack size (X, Y, Z) Number of atoms
[100], [010], [001] 100a × 50a × 6a 10a × a × 6a 121428
[110], [[1 with combining macron]10], [001] 100a × 50a × 4a 10a × a × 4a 159588
[111], [[1 with combining macron]10], [[1 with combining macron][1 with combining macron]2] 50a × 25a × 6a 5a × a × 6a 119878


To accurately and quantitatively predict the crack propagation and failure properties of microstructures, the local nanoscale properties are considered. Fig. 1b shows the schematic of regions used to calculate the local properties using CZM. The initial configuration is divided into n = 50 cells (where the width of one cell is the lattice constant of nickel), the height of the cohesive zone is 4 cells (four times the lattice constant of nickel) as shown in Fig. 1b. That is for calculating the crack opening displacement and establishing the relationship governing their cohesive behavior from discrete atomistic simulations.

At the beginning of the simulation, the system is relaxed using the conjugate gradient method to reach a minimum thermo-energy state. Then the models are stretched in the Y direction by an incrementally displacement loading every 20 ps and the global strain rate of 1.0 × 10⁸ s−1. In the next step, the same displacement increment is applied again, and the process was repeated. Finally, the deformed configuration of the system is computed by MD simulations, where the simulation is carried out by integrating Newton's equations of motion for all the atoms using a time step of 1 × 10⁻¹⁵ s. The open-source MD code LAMMPS30 and the visualization tools AtomEye31 are used in the atomistic simulations. As the temperature plays a critical role in crack propagation velocities of the atoms are rescaled to avoid thermal activation and the temperature is maintained at 1 × 10⁻⁴ K (approximately 0 K) throughout the simulation.

2.2. Definition of stress and centro-symmetry parameter

To examine the different orientations of crack propagation at nanoscale level, the atomistic level stress tensor is recorded and studied. In this paper, we employ the stress definition, the measurement of the inter-atomic interactions between atom and its neighbors, proposed by Born and Huang32
 
image file: c5ra06370a-t1.tif(1)
where N is the number of atoms within the cutoff-distance region around atom i, Ωi is the volume of atom i, fα(i, j) is the interactive force component by atom j on atom i, and rβ(i, j) stands the relative position from atom j to atom i. Usually, the stress of atom i is taken as an average of atom stress within its cutoff-distance region, the average atomic stress tensor [small sigma, Greek, macron]αβ(i) at atom i is given by33
 
image file: c5ra06370a-t2.tif(2)

To measure the local lattice disorder around an atom and to characterize whether the atom is part of a perfect lattice, the centro-symmetry parameter for a single atom is defined as34

 
image file: c5ra06370a-t3.tif(3)
where Ri and Ri+6 are the vectors from the central atom to the six pair of nearest neighbors in the FCC lattice. By definition, it is clearly that if the perfect FCC material is subjected to homogeneous elastic deformation, e.g. no flaws or strain localization, the value of CSP should be zero.

3. Simulation results and discussion

Three pre-cracked samples with different orientations of (X[100], Y[010], Z [001]; X[110], Y[[1 with combining macron]10], Z[001]; X[111], Y[[1 with combining macron]10], Z[[1 with combining macron][1 with combining macron]2]) are carried out to discuss the influence of crystal orientation on crack propagation and fracture mechanisms. Detailed results of crack growth process, stress field and the microstructure evolution are illustrated and analyzed in the following sections.

3.1. X[100], Y[010], Z[001] crystal orientation

Fig. 2 shows the stress and microstructure evolutions near the crack tip during crack growth in the X[100], Y[010], Z[001] orientation. At a loading time of t = 300 ps, the crack does not initiate and holds in the original shape, but the stress concentration occurs at the crack tip due to the geometry singularity as shown in Fig. 2a (the contour plot stands for the atomic tensile stress variation at different sites). At t = 376 ps, the site of peak stress site shifts ahead along the direction of the crack tip and dislocation emits at this place (see Fig. 2b). As the loading continues, at t = 386 ps and 400 ps, a void is formed at the region of the dislocation nucleation, and then the void coalesced and growth to form a new crack tip at a short distance in front of the original crack with the application of loading. Meanwhile, the site of the stress concentrations move to the new crack tip of a growing crack, as shown in Fig. 2c and d. Subsequently, the new crack begins to grow with the highest stress at the crack tip, at t = 400 ps, the new crack linked-up with the original crack to create a longer crack along the crack path until the sample wholly fracture (Fig. 2e).
image file: c5ra06370a-f2.tif
Fig. 2 The contour plots of the atomic tensile stress field and microstructure evolution during the process of crack propagation in the X[100], Y[010], Z[001] orientation. (a) t = 300 ps, (b) t = 376 ps, (c) t = 386 ps, (d) t = 400 ps and (e) t = 448 ps. The insets in this figure provided a detailed view of the atomic tensile stress levels and microstructure evolutions.

Fig. 3 quantitatively shows the atomic tensile stress as a function of the atom position along the crack path at different loading time. It can be seen that the peak tensile stress maintains about 22 GPa with its site moves forward in the whole crack propagation process. At t = 300 ps, the peak tensile stress occurs at the crack tip, and the stress is monotonic to the atom position along the crack path at crack front. Subsequently, at t = 376 ps and t = 386 ps, dislocation emission and void formation lead to the redistribution of the atomic tensile stress and make the stress variation non-monotonically along the crack path. Once the void link-up with the original crack, the peak tensile stress returns to the crack tip again, and the crack propagates forward in a brittle way.


image file: c5ra06370a-f3.tif
Fig. 3 Atomic tensile stress as a function of the atom position along the crack path during the process of crack propagation in the X[100], Y[010], Z[001] orientation.

3.2. X[110], Y[[1 with combining macron]10], Z[001] crystal orientation

Fig. 4 shows a detailed observation on the stress field around the crack tip and microstructure evolution during crack growth in the X [110], Y[[1 with combining macron]10], Z[001] orientation. At the loading time of t = 150 ps, the atomic tensile stress concentrates at the crack tip due to geometric discontinuity; these atoms at the crack tip hold their initial atomic configuration without inducing the change of microstructure, as shown in Fig. 4a. At the onset of crack growth (t = 190 ps), a new minor crack initiates at the upper corner of the original pre-crack, and the site of stress concentration moves to the new formed crack tip. Besides, there is still no other change of the crack-tip microstructure (see Fig. 4b). After crack growth initiation, the crack extends quickly and approaches fracture at t = 358 ps, the atomic tensile stress concentration always occurs at the crack-tip of a growing crack, as observed in Fig. 4c and d. The four snapshots of crack propagation in Fig. 4 show a clean brittle fracture, the atomic configuration clearly displays almost perfectly flat atomic surfaces without inducing the change of microstructure.
image file: c5ra06370a-f4.tif
Fig. 4 The contour plots of the atomic tensile stress field and microstructure evolution during the process of crack propagation in the X[110], Y[[1 with combining macron]10], Z[001] orientation. (a) t = 150 ps, (b) t = 190 ps, (c) t = 300 ps and (d) t = 358 ps. The insets in this figure provided a detailed view of the atomic tensile stress levels and microstructure evolutions.

To more quantitative understanding the atomic stress distribution during the process of crack propagation, the atomic tensile stress as a function of the atom position along the crack path is plotted in Fig. 5. The highest tensile stress always occurs at the crack-tip of a growing crack during the whole fracture process. Meanwhile, the stress distributions are basically monotonic to the atom position along crack path at crack front due to there is no microstructure changing near the crack-tip during the process of crack propagation. Furthermore, it is obvious that the atomic tensile stress increases slowly (from about 17 GPa increases to 20 GPa) as the crack propagates forward due to the reduction of the effective surface area.


image file: c5ra06370a-f5.tif
Fig. 5 The atomic tensile stress as a function of atom position along the crack path during the process of crack propagation in the X[110], Y[[1 with combining macron]10], Z[001] orientation.

3.3. X[111], Y[[1 with combining macron]10], Z[[1 with combining macron][1 with combining macron]2] crystal orientation

Fig. 6 shows the stress field and related microstructure evolution around the crack tip in the X[111], Y[[1 with combining macron]10], Z[[1 with combining macron][1 with combining macron]2] crystal orientation. As discussed in the former two different orientations of samples, at the early loading time (t = 200 ps), the atoms at the crack tip hold their initial atomic configuration, and these crack tip atoms have the highest atomic tensile stress levels, see the contour plots of the atomic tensile stress field in Fig. 6a. As loading continues, crack tip blunting occurs due to the [[1 with combining macron]10] dislocation emission at the loading time of t = 232 ps. In this case, the original atomic configuration begins to change. The analysis of the microstructure shows the dislocation emits at certain distance ahead of the crack tip where the crack tip blunts. Simultaneously, the microstructure evolution induces the change of the atomic tensile stress field around the crack tip, as shown in Fig. 6b. At t = 300 ps, another dislocation emits from the crack tip along the [021] direction and the atoms have very high stress values at the region of dislocation is shown in Fig. 6c. When these stresses are increased by stress concentrations resulting from the surface irregularities, the material reaches its yield strength in the localized region which initiates slip. As can be seen in Fig. 6d, slip bands generates and a rather large region of plastic deformation occurs in front of the growing crack. Those can be observed through a one-to-one relationship between the stress distributions and microstructure characteristics around the crack tip at t = 330 ps. In the next loading time of t = 350 ps, the slip bands and the plastic deformation zone gradually expands until the rest of the sample occupied (see Fig. 6e).
image file: c5ra06370a-f6.tif
Fig. 6 The contour plots of the atomic tensile stress field and microstructure evolution during the process of crack propagation in the X[111], Y[[1 with combining macron]10], Z[[1 with combining macron][1 with combining macron]2] orientation. (a) t = 200 ps, (b) t = 232 ps, (c) t = 300 ps, (d) t = 330 ps and (e) t = 350 ps. The insets in this figure provided a detailed view of the atomic tensile stress levels and microstructure evolutions during the process of crack propagation.

Fig. 7 shows the atomic tensile stress sample as a function of atom position along the crack path at different loading time for the X[111], Y[[1 with combining macron]10], Z[[1 with combining macron][1 with combining macron]2] crystal orientation. As observed in Fig. 7, the peak tensile stress (14 GPa) occurs at the crack tip on account of geometry singularity at beginning of loading time of t = 200 ps, and the tensile stress field along the crack line is basically monotonic at the crack front. After the loading time of t = 232 ps, the tensile stress field varies non-monotonically along crack path, it goes down first, and then gradually climbs up. When the loading time t = 350 ps, the atoms at the just right side of the sample gets the tensile stress value equivalently to the stress of the crack tip and even surpass a bit. It suggests that the high stress value not only occurs at the crack tip but also at the region of the existence of slip bands. That is, atoms have the highest tensile stress values both at the new crack tip and at the region of plastic deformation.


image file: c5ra06370a-f7.tif
Fig. 7 The atomic tensile stress as a function of atom position along the crack path during the process of crack propagation in the X[111], Y[[1 with combining macron]10], Z[[1 with combining macron][1 with combining macron]2] orientation.

4. Crack propagation dynamics for samples with three different orientations

Crack propagation dynamics is an important aspect for understanding the crack propagation and fracture behavior. In order to show quantitatively how the crystal orientations effect on the crack resistance and crack propagation dynamics, based on the calculation of the CZM, the results for the crack length as a function of loading time for three different orientations are plotted as Fig. 8a. It can be seen that the crack propagation is susceptible to the crystal orientations and show disparate behaviors. In the X[100], Y[010], Z [001] crystal orientation, the crack does not propagate until around 355 ps, then the material experiences a ductile to brittle transition, after t = 375 ps, the crack grows forward quickly with an average speed of 396 m s−1 until the sample final fracture. In the X[110], Y[[1 with combining macron]10], Z[001] crystal orientation, the crack does not propagate until around 180 ps, then the crack extends quickly from the original crack to the final fracture with an average speed of 285 m s−1. The whole procedure is just like a brittle fracture process. For the X[111], Y[[1 with combining macron]10], Z[[1 with combining macron][1 with combining macron]2] crystal orientation, compared with X[100], Y[010], Z[001] and X[110], Y[[1 with combining macron]10], Z[001] crystal orientations, the crack extension displays a distinctly slow due to the formation of slip bands in front of the crack tip during the crack propagation. The crack length almost remain the initial length at the most of run time and eventually increase less than 18 Å until the end of run time t = 500 ps, the inset in Fig. 8 provide a more detailed view of the crack extension levels as the loading time increase. The results indicate that the crack length is closely related to the micro-structural evolution around the crack tip of samples with different orientations.
image file: c5ra06370a-f8.tif
Fig. 8 Crack propagation dynamics of samples with different orentations: (a) crack growth length vs. loading time; (b) averaged atomic tensile stress vs. the opening displacement.

Fig. 8b shows the averaged atomic tensile stress vs. the opening displacement. The stress and opening displacement relations of the samples with different orientations under mode I loading are extracted from the atomic forces and motions of the cohesive zone model. Both the samples with X[100], Y[010], Z[001] and X[110], Y[[1 with combining macron]10], Z[001] orientations had their highest tensile stress at about 1.5 Å of opening displacement. The highest averaged tensile stress is about 18 GPa in the X[100], Y[010], Z[001] orientation, and the stress has maintained a very high value until the opening displacement reached 2.0 Å due to the void nucleation during the crack propagation. While in the X[110], Y[[1 with combining macron]10], Z[001] orientation, the highest averaged tensile stress is about 13 GPa, then the stress decreased quickly after reaching its maximum value at about 1.5 Å of opening displacement. For the X[111], Y[[1 with combining macron]10], Z[[1 with combining macron][1 with combining macron]2] orientation, the averaged tensile stress has always kept very high value due to a larger number of slip bands generation during the crack propagation. The results indicate that the different micro-mechanisms that occur during the processes of crack growth affect significantly opening crack and stress states.

5. Conclusions

In this paper, Molecular dynamics simulations based on the cohesive zone model have been performed to investigate the effect of crystal orientation on the crack-tip stress and crack propagation in single crystal nickel. The results indicated that crack-tip stress and microstructure evolutions depend on crystal orientations. In the X[100], Y[010], Z[001] orientation, void nucleation and growth was observed during the crack propagation, and associated with a mutation of stress at the region of void nucleation; in the X[110], Y[[1 with combining macron]10], Z[001] orientation, atomic configurations near the crack tip basically remained unchanged and stress concentration always occurred at the crack tip of a growing crack throughout the crack growth, which represented a brittle process; however, crack tip blunting and slip bands occurred in the X[111], Y[[1 with combining macron]10], Z[[1 with combining macron][1 with combining macron]2] orientation, the highest stress occurred at the region of crack tip blunting and slip bands. Moreover, based on the calculation of CZM, there were obvious differences in the crack growth rate and crack opening displacement for the samples with three different orientations, respectively, which were closely related to the different fracture mechanisms caused by crystal orientation. These results provided useful information for understanding the crystal orientation dependent on the atomic-scale fracture mechanisms and stress distribution characterizes.

Acknowledgements

The work was supported by National Natural Science Foundation of China (Grant No. 11102139 and 11472195), and Natural Science Foundation of Hubei Province of China (Grant No. 2014CFB713).

References

  1. A. A. Griffith, Philos. Trans. R. Soc., A, 1921, 221, 163 CrossRef.
  2. G. R. Irwin, J. Appl. Mech., 1957, 24, 361 Search PubMed.
  3. S. Y. Yarema, Mater. Sci., 1996, 31, 617 CrossRef.
  4. J. R. Rice, J. Appl. Mech., 1986, 35, 379 CrossRef.
  5. K. Nishimura and N. Miyazaki, Comput. Model. Eng. Sci., 2001, 2, 143 Search PubMed.
  6. K. S. Cheung and S. Yip, Modell. Simul. Mater. Sci. Eng., 1994, 2, 865 CrossRef CAS PubMed.
  7. S. Xu and X. Deng, Nanotechnology, 2008, 19, 115705 CrossRef PubMed.
  8. D. Holland and M. Marder, Phys. Rev. Lett., 1998, 80, 746 CrossRef CAS.
  9. D. Holland and M. Marder, Adv. Mater., 1999, 11, 793 CrossRef CAS.
  10. W. P. Wu and Z. Z. Yao, Strength Mater., 2014, 46, 164 CrossRef CAS.
  11. W. P. Wu and Z. Z. Yao, Comput. Model. Eng. Sci., 2013, 93, 235 Search PubMed.
  12. Y. Furuya, H. Noguchi and S. Schmauder, Int. J. Fract., 2001, 107, 139 CrossRef CAS.
  13. M. F. Horstemeyer, M. I. Baskes and S. J. Plimpton, Acta Mater., 2001, 49, 4363 CrossRef CAS.
  14. W. P. Wu and Z. Z. Yao, Theor. Appl. Fract. Mech., 2012, 62, 67 CrossRef CAS PubMed.
  15. J. Zhang and S. Ghosh, J. Mech. Phys. Solids, 2013, 61, 1670 CrossRef CAS PubMed.
  16. Y. Cheng, M. X. Shi and Y. W. Zhang, Int. J. Solids Struct., 2012, 49, 3345 CrossRef CAS PubMed.
  17. F. F. Abraham and J. Q. Broughton, Comput. Mater. Sci., 1998, 10, 1 CrossRef CAS.
  18. Y. F. Guo, C. Y. Wang and D. L. Zhao, Mater. Sci. Eng., A, 2003, 349, 29 CrossRef.
  19. O. Nejadseyfi and A. Shokuhfar, J. Comput. Theor. Nanosci., 2014, 11, 2199 CrossRef CAS PubMed.
  20. J. G. Yu, Q. X. Zhang, R. Liu, Z. F. Yue, M. K. Tang and X. W. Li, RSC Adv., 2014, 4, 32749 RSC.
  21. H. Xie, T. Yu, F. Yin and C. Tang, Mater. Sci. Eng., A, 2013, 580, 99 CrossRef CAS PubMed.
  22. J. Mei, Y. Ni and J. Li, Int. J. Solids Struct., 2011, 48, 3054 CrossRef CAS PubMed.
  23. V. Yamakov, E. Saether, D. R. Phillips and E. H. Glaessgen, J. Mech. Phys. Solids, 2006, 54, 1899 CrossRef CAS PubMed.
  24. C. R. Dandekar and Y. C. Shin, Composites, Part A, 2011, 42, 355 CrossRef PubMed.
  25. X. W. Zhou, J. A. Zimmerman, E. D. Reedy Jr and N. R. Moody, Mech. Mater., 2008, 40, 832 CrossRef PubMed.
  26. K. Park and G. H. Paulino, Appl. Mech. Rev., 2011, 64, 060802 CrossRef.
  27. Y. L. Li, W. P. Wu, N. L. Li and Y. Qi, Comput. Mater. Sci., 2015, 104, 212 CrossRef CAS PubMed.
  28. Y. Mishin, D. Farkas, M. J. Mehl and D. A. Papaconstantopoulos, Phys. Rev. B: Condens. Matter Mater. Phys., 1999, 59, 3393 CrossRef CAS.
  29. M. Karimi, T. Roarty and T. Kaplan, Modell. Simul. Mater. Sci. Eng., 2006, 14, 1409 CrossRef CAS.
  30. S. J. Plimpton, J. Comput. Phys., 1995, 117, 1 CrossRef CAS . http://www.lammps.sandia.gov/.
  31. J. Li, Modell. Simul. Mater. Sci. Eng., 2003, 11, 173 CrossRef PubMed.
  32. M. Born and K. Huang, Dynamical theory of crystal lattices, Clarendon, Oxford, 1954 Search PubMed.
  33. M. F. Horstemeyer and M. I. Baskes, J. Eng. Mater. Technol., 1999, 121, 114 CrossRef.
  34. C. L. Kelchner, S. J. Plimpton and J. C. Hamilton, Phys. Rev. B: Condens. Matter Mater. Phys., 1998, 58, 11085 CrossRef CAS.

This journal is © The Royal Society of Chemistry 2015