Determination of rice sensory quality with similarity analysis-artificial neural network method in electronic tongue system
Lin Luab,
Shiyi Tianb,
Shaoping Dengb,
Zhiwei Zhua and
Xianqiao Hu*a
aRice Product Quality Supervision and Inspection Center, Ministry of Agriculture, China National Rice Research Institute, Hangzhou 310006, China. E-mail: hxhxqia@aliyun.com; Fax: +86 571 63370380; Tel: +86 571 63370311
bCollege of Food Science and Biotechnology, Zhejiang Gongshang University, Hangzhou 310035, China
First published on 12th May 2015
Abstract
Lack of effective data processing methods has limited the application of electronic tongues in rice sensory analysis. In this paper, a novel similarity analysis-artificial neural network (SA-ANN) method was developed for an electronic tongue system to determine rice sensory quality. Characteristic data were extracted from signals and arranged in data matrix. The obtained matrix data were analyzed using the similarity analysis method by comparing the data to those of a control sample, resulting in a similarity degree that was used as the input variable for the artificial neural network. The SA-ANN method was tested and compared to traditional sensory evaluation. The correlation coefficients (R) for odor, appearance, palatability, texture, and overall scores were 0.9669, 0.9711, 0.9760, 0.8654 and 0.9848, respectively. Results indicated that the developed SA-ANN technique is an efficient data processing method for use in an electronic tongue system to characterize and predict rice sensory quality.
1. Introduction
Rice is one of the most important staple foods in the world. As living standards improve, consumers pay more attention to rice quality. Hence, determination and prediction of rice quality are of great importance. The sensory quality of cooked rice is of greatest concern to consumers, given that rice is consumed as whole cooked milled kernels. Traditionally, sensory quality is determined manually by sensory evaluation. According to China's national standard GB/T 15682-2008, sensory evaluation should be performed by 5–10 skilled or 18–24 trained panelists. The panelists score test rice samples in comparison to a control rice sample. However, sensory evaluation is very labor intensive, time consuming and requires skilled persons. In addition, results are not entirely reliable because of panelists' bias and variability of the human sensory system depending on daily physical and psychological conditions.1The electronic tongue, a system that closely mimics the mechanism of human taste sense,2–4 is based on an array of sensors and an appropriate pattern recognition method.5 This tool has become an attractive alternative to human panels in food analysis,2,6–9 because it is objective, tireless, sensitive, and applicable to a wide range of samples. For example, the electronic tongue has been widely used in authenticity assessment, recognition, freshness evaluation and quantitative analysis of water;10,11 wine,4,12 tea,13,14 milk,3,15 and other beverages;16,17 and fish,18,19 meat,20 and other foodstuffs. Electronic tongues have also been applied in the evaluation of firmness, organoleptic scores, color, texture and palatability properties of pear, dried apple, and drugs.21–23 However, limited work on rice quality analysis using the electronic tongue has been reported. Electronic tongues were applied to distinguish variations in taste and quality of rice during storage.24 Tran et al.25 analyzed the taste of brown rice and milled rice with different milling yields by using an electronic tongue. However, no work on systematic prediction of rice sensory scores has been previously reported.
Basically, an electronic tongue system consists of three essential elements:6 an array of chemical sensors with different selectivities, an instrument for collecting signals, and software with an appropriate data processing method to process signals and obtain results. Signals obtained by sensor array, which varied among samples due to the presence of diverse compounds and ions, could be used as fingerprint information to identify sensory properties. However, the obtained signals contain a large quantity of information on the sample, including useless information. Hence, an appropriate algorithm for data processing was fundamental to a useful electronic tongue system.
Several universal data processing methods such as principal component analysis (PCA),26,27 cluster analysis (CA),4 and linear discriminant analysis (LDA)28,29 were applied to process data in an electronic tongue system. However, characteristic results obtained with PCA or LDA were not unique for a given sample, as they varied depending on the collection of sample set. That is, characteristic results depend not only on sample properties but also on sample set composition. Unique and absolute values rather than varied and relative ones are optimal for expressing sample characteristics. The complexity of rice samples and the lack of an appropriate data processing method limited application of the electronic tongue in systematic analysis and prediction of rice sensory quality. The similarity analysis method identifies the degree of similarity for a test sample versus a control sample. Hence, characteristic results obtained via similarity analysis between the test sample characteristic data matrix and control sample characteristic data matrix are the only and absolute characteristic values for the sample. Template matching, which was originally used to identify geometric transformations of a template image in a test image,30 one of several classic similarity analysis methods, is based on the comparison of a test data matrix against a stored template data matrix.31,32 That is, it can calculate the degree of correlation between one matrix and another matrix. However, the similarity analysis method had never been applied in an electronic tongue system.
In this study, a novel data processing method, similarity analysis combined with artificial neural network (SA-ANN), was developed for an electronic tongue system to predict rice sensory quality. Various similarity algorithms were used to determine degrees of similarity between matrix data of the test sample and that of the control sample. The degree of similarity was adopted as the characteristic feature in the subsequent ANN analysis for predicting rice quality. Sensory scores obtained from the electronic tongue system were also compared with those from sensory evaluations.
2. Materials and methods
2.1. Rice samples and sample treatment
Sixteen indica rice samples (1 control sample, 15 test samples) harvested from Guangdong, China in 2012, were used. The samples were stored in an environment of 18% relative humidity before use.Before testing, samples were husked using a Satake Testing Husker (Model THU35B, Satake Engineering Co., Ltd, Japan) and then milled with a McGill Mill (China National Rice Research Institute, China) according GB/T 5495-2008. Next, milled rice kernels were ground into flour using a Cyclotec 1093 Sample Mill (Foss Tecator, Sweden).
2.2. Electronic tongue
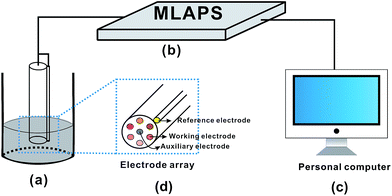
As shown in Fig. 1, the electronic tongue employed in this paper consisted of six different metallic disk electrodes (platinum, gold, palladium, wolfram, titanium and silver; diameter 2 mm; purity 99.9%) as working electrodes, an Ag/AgCl electrode (saturated KCl, diameter 2 mm) as the reference electrode and a platinum electrode (diameter 2 mm) as the auxiliary electrode in a standard three-electrode system. Six working electrodes together with an auxiliary electrode were embedded in a composite material, with the reference electrode placed nearby (Fig. 1d). The electrodes were connected to a multifrequency large-amplitude pulse scanner (MLAPS, Fig. 1b), which was controlled by a personal computer (PC; Fig. 1c). The PC was used to set and control potential pulses and to record response currents.2.3. Measurement by electronic tongue
Rice flours (1.5 g each) were mixed and homogenized with 150 mL boiling water, and filtered after cooling down to room temperature. The filtrate was used as the rice sample solution for subsequent measurements.Before testing, electronic sensors were stabilized in 0.01 mol L−1 KCl by pulse voltammetry for 10 cycles. The potential waveform was from 1 V to −1 V with a potential step of 0.2 V and a step length of 1 s. Multifrequency large-amplitude pulse voltammetry (MLAPV)33,34 was applied in the work, as it is capable of obtaining large amounts of information per test sample. The applied potential waveform consisted of three segments—1 Hz, 10 Hz and 100 Hz (the corresponding step lengths were 1 s, 0.1 s and 0.01 s, respectively). In each segment, the scan was conducted from 1 V to −1 V with a potential step of 0.2 V. A step of 0 V was conducted for 5 s between each segment to eliminate interaction between segments. The 1 Hz segment was the same as normal LAPV because no interaction occurred between steps. However, in the cases of 10 Hz and 100 Hz, charging currents did not decay to zero and steady-state, diffusion-limited current was not formed in limited step length of 0.1 s and 0.01 s. Thus, interaction between steps existed in the 10 and 100 Hz segments, resulting in extra information.
After each measurement, the electronic sensors were first soaked in deionized water for 30 s, and then washed by scanning the electrodes at a potential of 0 V for 1 s, 1.5 V for 2 s, and then −1.5 V for 2 s and finally 0 V for 3 s.
Four independent repeated measurements were performed for each sample.
2.4. Data processing
Algorithm I:
Algorithm II:
Algorithm III (normalized by algorithm II):
2.5. Prediction of rice sensory scores with the PCA-ANN method
In the PCA analysis process, less significant components are omitted. The first 10 important components (PC1-10) of the characteristics data set, which contributed more than 90% of total variance, were applied in the ANN analysis process. During the ANN process, the first 10 components (PC1–10) were used as input variables, and sensory scores were obtained with the BP-ANN. For correct learning, 10 training samples (40 measurements in total) whose sensory scores were determined with sensory evaluation were used for training the BP-ANN. The sensory scores of 5 test samples (20 measurements in total) were predicted with the trained PCA-ANN system.2.6. Determination of rice sensory scores with sensory evaluation
Sensory evaluations of rice samples were performed after cooked rice was prepared. A total of 100 g milled rice kernels were washed twice with 200 g water and soaked with 1.6 times their mass in water for 30 min before cooking, and steamed for 20 min. After cooling for 40 min at room temperature, the cooked rice sample was placed in ceramic bowls and presented to panelists. Five skilled panelists were members of the Rice Product Quality Supervision and Inspection Center, Ministry of Agriculture, China. One of the samples was known as the control sample; all other samples were presented in random sequence to panelists. Panelists input responses for each sample on odor, appearance, palatability and texture by comparing it to the control sample. Each item contained six corresponding levels (1 – worse, 2 – bad, 3 – same, 4 – good, 5 – better, and 6 – best versus the control sample). Generally, levels 1 (worse) and 6 (best) corresponded to 50 × Y and 100 × Y points (Y: weighting coefficient, 0.15, 0.15, 0.60 and 0.10 for odor, appearance, palatability and texture, respectively). Scores of other levels were calculated depending on the control sample score. Score steps among levels 1, 2 and 3 were equal, while those among levels 3, 4, 5 and 6 were also equal. Score steps between levels were calculated as following: score step among levels 1, 2 and 3 was derived as (X − 50) × Y/2, while the score step among levels 3, 4, 5 and 6 was derived as (100 − X) × Y/3 (X: overall score of the control sample). In this work, a rice sample with a sensory score of 68 points (10.2, 10.2, 40.8 and 6.8 points for odor, appearance, palatability and texture, respectively) was used as the control sample, for it is regarded as possessing stable sensory properties. Based on the evaluation of a single panelist, scores for each attribute could be calculated, and overall sensory score was obtained as follows: overall sensory score = odor score + appearance score + palatability score + texture score. The ultimate score for each sample was determined as the average value of valid sensory scores whose overall score deviations from the average value of 5 for overall sensory scores were within 10 points. Finally, the degree of difference was obtained as the overall sensory score deviation from the control sample.3. Results and discussion
Food quality was influenced by related chemical components, while the electronic tongue could determine overall chemical compositions and their interaction. Reports in the literature indicated that electronic tongues were applied for evaluation of firmness, organoleptic scores, color, texture and palatability properties of foodstuffs. Therefore, we attempted to predict the sensory properties of rice, including odor, appearance, palatability, texture and overall scores that were important parameters of rice sensory quality in China. These characteristics were the principal factors in the sensory properties of rice. Texture and appearance are largely determined by the property and structure of starch.35,36 The sweetness and umami tastes of rice were mainly affected by soluble sugars such as glucose and sucrose, and free amino acids such as glutamic acid and aspartic acid.25 2-Acetyl-1-pyrroline (2AP), which was soluble in hot water, is believed to be the main aroma compound in rice.37By using the similarity analysis method, the sensory quality of rice was determined not by detecting amounts of related components but by comparing electronic signals of test samples to that of that control sample; that is, it was determined by the similarity degree of the test sample versus the control sample. Differences in signals between the test sample and control sample were expressions of differences in sample constituents. The signals obtained from the electronic tongue were treated with the following similarity analysis—the artificial neural network method for analyzing and predicting rice sensory properties.
For the electronic tongue system, platinum, gold, palladium, wolfram, titanium and silver were chosen as the working electrodes because of their high stability and availability. It was found that the RSDs of characteristic data over 20 successive runs were all within 10% for both 0.01 mol L−1 sucrose and 0.01 mol L−1 tartaric acid for the six working electrodes.
3.1. Similarity analysis
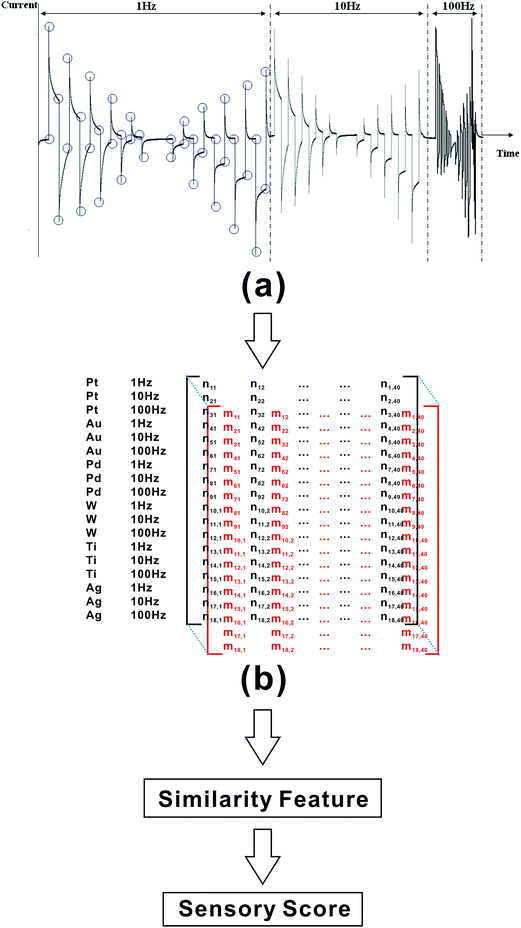
More than 520![[thin space (1/6-em)]](https://www.rsc.org/images/entities/char_2009.gif) 000 data points were collected by a single working electrode for a single sample at a pulse voltage of 1.0 V to −1.0 V, with a potential step of 0.2 V and a data collection interval of 100 μs. Collected data were too voluminous to be processed. These large data sets contained not only useful information but also useless information. Thus, extracting useful characteristic data by employing a reasonable method is essential. Useful characteristic data were extracted and placed into a data matrix as described in Section 2.4.1.
000 data points were collected by a single working electrode for a single sample at a pulse voltage of 1.0 V to −1.0 V, with a potential step of 0.2 V and a data collection interval of 100 μs. Collected data were too voluminous to be processed. These large data sets contained not only useful information but also useless information. Thus, extracting useful characteristic data by employing a reasonable method is essential. Useful characteristic data were extracted and placed into a data matrix as described in Section 2.4.1.
Every datum in the characteristic data matrix contains features of the rice sample. The characteristic data matrix from electronic tongue signals possesses more integral and interactional information among different compounds than that after reduced dimensionality. Similarity analysis with template matching was based on comparison of the test sample data matrix against the control sample data matrix without reducing dimensionality. Hence, it is an appropriate analysis method to extract similarity features of the test sample compared to the control sample, and the obtained similarity degree should be a characteristic feature for the test sample. Here, template matching was adopted as the similarity analysis for electronic tongue system. During similarity analysis, it was implemented by comparing every data in test data matrix against that in the template data matrix of the same position, and then similarity of every data item was accumulated with proper algorithms, resulting in the similarity degree. Hence, similarity should be a feature of the sample. Different algorithms would result in different similarity degrees. Similarity degrees determined by different algorithms were demonstrated by comparing them to degrees of difference obtained by sensory evaluation as in Section 2.6.
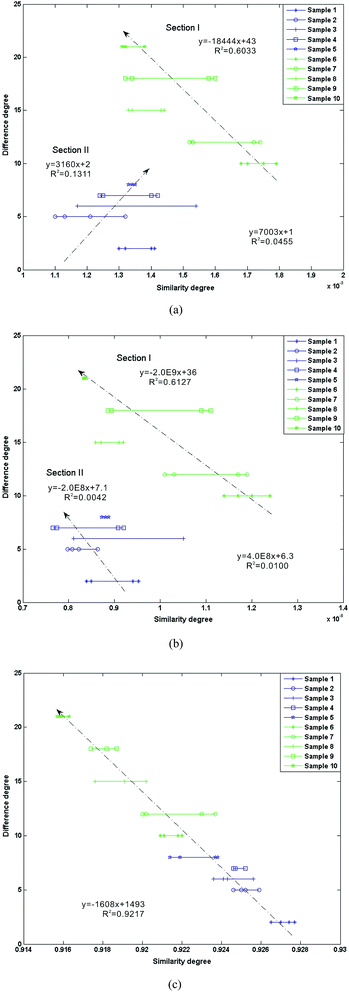
The lower the similarity degrees obtained with algorithms I and II, the closer the test samples were to the control sample. However, algorithm III was normalized from algorithm II. So, the closer to 1 similarity degrees obtained with algorithm III, the closer the test samples to the control sample. Relationships between degrees of difference in overall quality from sensory evaluation and similarity degrees obtained with the three algorithms were established and compared.
As shown in Fig. 3, similarity degrees obtained with algorithm III show more significant negative linear relationships with difference degrees of overall sensory scores (R2 = 0.9217) compared to those obtained from the other two algorithms. The higher the similarity, the smaller the difference. A chasm occurred between samples 5 and 6, seen in Fig. 3a and b. First, as seen in Fig. 3a, Section I (samples 6–10) showed a negative linear relationship with sample 8 slightly deviated (R2 = 0.6033). However, Section II (samples 1–5) showed a much weaker linear relationship with sample 1 severey deviated (R2 = 0.1311). In Fig. 3b, a negative linear relationship between similarity degrees and difference degrees (R2 = 0.6127) was obtained for Section I and a weak linear relationship (R2 < 0.005) for Section II.
With algorithms I and II, a significant linear relationship between similarity and difference degrees was obtained only for high sensory score samples (≥78 points, samples 6–10). Hence, algorithm III was the most effective algorithm for extracting characteristic similarity degrees. It was apparent that algorithm III would be the best choice to reflect the relationship between similarity degree obtained from electronic tongue signals and degree of difference from sensory evaluation. The smaller similarity degree obtained with algorithm III corresponded to a lower difference degree of sensory score and thus, a higher sensory score. Consequently, matrix data obtained from the electronic tongue did involve sensory properties, and algorithm III was an effective algorithm to extract the characteristic feature. Algorithm III was applied in the following work to determine the similarity degree of test samples.
3.2. Training of BP-ANN
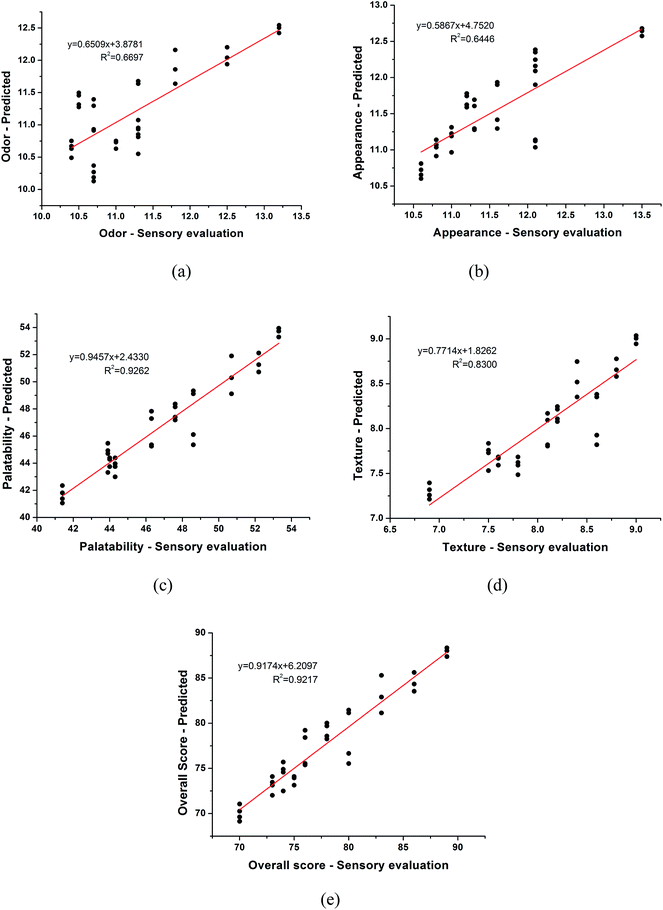
BP-ANN was used to provide mapping between input variable (similarity degree) and output variables (odor, appearance, palatability, texture and overall scores). Similarity degrees obtained with algorithm III were used as the input variable for training the neural network. The network output variables were odor, appearance, palatability, texture and overall scores obtained via sensory evaluation. The number of training epochs was 1000 and the training goal was 0.001. Data from 40 measurements were used to training the BP-ANN. The training process consisted of adjusting weights between the hidden and output layers to the data set that is composed of known input and output parameters. After a simple optimization showing the fastest convergence rate and lowest MSE, the neurons number 4 was selected. As shown in Fig. 4, relatively high correlation coefficients (R) of 0.8184, 0.8029, 0.9624, 0.9100 and 0.9600, and RMSEs (root-mean-square error) of 0.5059, 0.4910, 1.0299, 0.2579 and 1.6298 for odor, appearance, palatability, texture and overall scores, respectively, were obtained with training samples, indicating that SA-ANN performed well at the task of predicting the rice sensory score.3.3. Analytical performance of SA-ANN method
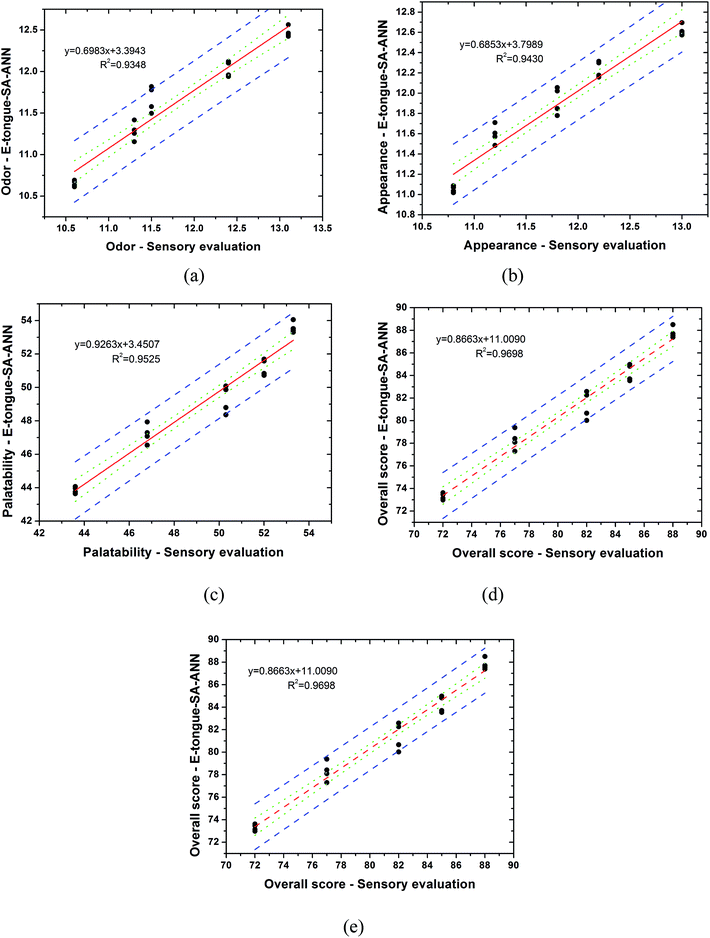
The accuracy of prediction for rice sensory quality using the developed electronic tongue with similarity analysis-artificial neural network was compared with traditional sensory evaluation. In the case of sensory evaluation, sensory scores were determined according to China's national standard GB/T 15682-2008. Meanwhile, samples were measured by electronic tongue, and the obtained matrix data were analyzed by using SA-ANN. The correspondences between results of the developed SA-ANN method in the electronic tongue system and traditional sensory evaluation were showed in Fig. 5. Correlation coefficients of 0.9669, 0.9711, 0.9760, 0.8654 and 0.9848 for odor, appearance, palatability, texture and overall scores, respectively, were obtained between the developed E-tongue-SA-ANN and sensory evaluation results. Results of developed method were consistent with those of the sensory evaluation method for determining sensory quality.The precision of the developed analysis method for determining quality parameters was determined. RSDs of 0.50%, 0.42%, 0.62%, 0.53% and 0.57% (n = 4) for odor, appearance, palatability, texture and overall scores, respectively, were obtained, indicating that the precision of the developed analysis method was very good.
Overall scores obtained by the developed SA-ANN method were compared to those obtained via the PCA-ANN method (Table 1). As seen in Table 1, both precision and accuracy of the SA-ANN method were better than the PCA-ANN method. Average deviations of less than 1.2 were obtained using SA-ANN method. However, average deviations for PCA-ANN method were quite large, all of which were larger than 2.0. Deviations for the PCA-ANN method from the sensory evaluation were 0.7–14.2. Meanwhile, deviations for the developed SA-ANN method were 0.3–1.3, indicating the excellent accuracy of the developed method.
| Sensory score–sensory evaluation | SA-ANN method | PCA-ANN method | ||||
|---|---|---|---|---|---|---|
| Sensory score | Average deviation | Deviation | Sensory score | Average deviation | Deviation | |
| 72 | 73.3 | 0.3 | 1.3 | 71.3 | 3.3 | −0.7 |
| 77 | 78.3 | 0.9 | 1.3 | 78.2 | 11 | 1.2 |
| 82 | 81.4 | 1.2 | −0.6 | 76.9 | 3.9 | −5.1 |
| 85 | 84.0 | 0.7 | −1.0 | 75.6 | 13.1 | −9.4 |
| 88 | 87.7 | 0.5 | −0.3 | 73.8 | 2.4 | −14.2 |
4. Conclusions
An appropriate algorithm for data processing is an essential component to an electronic tongue system. The complexity of rice samples and the lack of proper data processing methods had previously limited application of electronic tongues in measuring rice sensory quality. A novel SA-ANN method for systematic analysis and prediction of rice sensory quality was developed as the essential part of an electronic tongue system. With such an analysis method, odor, appearance, palatability, texture and overall scores of test sample were obtained after measurement via electronic sensors and processing via SA-ANN. The obtained characteristic data matrix of the test samples without reducing dimensionality were compared to those of the control sample, resulting in a similarity degree for the test sample that was used as the input variable for the ANN to predict rice sensory quality. It was found that similarity algorithm III, which was applied to determine degree similarity for samples in this system, was more suitable for extracting characteristic features from electronic tongue data than similarity algorithms I and II. The sensory quality determined via the SA-ANN method via electronic tongue was consistent with that obtained by sensory evaluation. The developed electronic tongue system is both less labor intensive and time consuming than sensory evaluation performed by panelists. Therefore, the electronic tongue system with the SA-ANN method described here is potentially applicable in rapid and large-scale prediction of rice sensory properties in scientific research and development programs.Acknowledgements
This work was funded by the Chinese Central Government's Special Fund for Basic Scientific Research Operations in Commonweal Research Institutes (2014RG006-4, 2014RG006-1), Zhejiang Provincial Natural Science Foundation of China (LQ15C200007), and National Grain and Oil Crops product quality and safety risk assessment project (GJFP2014006).Notes and references
- H. Smyth and D. Cozzoino, Chem. Rev., 2013, 113, 1429–1440 CrossRef CAS PubMed
.
- E. A. Baldwin, J. H. Bai, A. Plotto and S. Dea, Sensors, 2011, 11, 4744–4766 CrossRef PubMed
.
- Z. B. Wei and J. Wang, Anal. Chim. Acta, 2011, 694, 46–56 CrossRef CAS PubMed
.
- Z. B. Wei, J. Wang and L. S. Ye, Biosens. Bioelectron., 2011, 26, 4767–4773 CrossRef CAS PubMed
.
- Y. Vlasov, A. Legin, A. Rudnitskaya, C. Di Natale and A. D'Amico, Pure Appl. Chem., 2005, 77, 1965–1983 CrossRef CAS
.
- L. Escuder-Gilabert and M. Peris, Anal. Chim. Acta, 2010, 665, 15–25 CrossRef CAS PubMed
.
- M. Peris and L. Escuder-Gilabert, Anal. Chim. Acta, 2013, 804, 29–36 CrossRef CAS PubMed
.
- M. Sliwinska, P. Wisniewska, T. Dymerski, J. Namiesnik and W. Wardencki, J. Agric. Food Chem., 2014, 62, 1423–1448 CrossRef CAS PubMed
.
- Y. Tahara and K. Toko, IEEE Sens. J., 2013, 13, 3001–3011 CrossRef
.
- J. Y. Heras, D. Pallarola and F. Battaglini, Biosens. Bioelectron., 2010, 25, 2470–2476 CrossRef CAS PubMed
.
- L. Moreno, A. Merlos, N. Abramova, C. Jimenez and A. Bratov, Sens. Actuators, B, 2006, 116, 130–134 CrossRef CAS PubMed
.
- A. Rudnitskaya, L. M. Schmidtke, I. Delgadillo, A. Legin and G. Scollary, Anal. Chim. Acta, 2009, 642, 235–245 CrossRef CAS PubMed
.
- K. H. Chang, R. L. C. Chen, B. C. Hsieh, P. C. Chen, H. Y. Hsiao, C. H. Nieh and T. J. Cheng, Biosens. Bioelectron., 2010, 26, 1507–1513 CrossRef CAS PubMed
.
- M. Palit, B. Tudu, N. Bhattacharyya, A. Dutta, P. K. Dutta, A. Jana, R. Bandyopadhyay and A. Chatterjee, Anal. Chim. Acta, 2010, 675, 8–15 CrossRef CAS PubMed
.
- Z. B. Wei, J. Wang and X. Zhang, Microchim. Acta, 2013, 88, 231–239 CAS
.
- P. Ciosek, E. Augustyniak and W. Wroblewski, Analyst, 2004, 129, 639–644 RSC
.
- P. Ciosek, Z. Brzozka and W. Wroblewski, Sens. Actuators, B, 2004, 103, 76–83 CrossRef CAS PubMed
.
- L. Gil, J. M. Barat, I. Escriche, E. Garcia-Breijo, R. Martinez-Manez and J. Soto, Microchim. Acta, 2008, 163, 121–129 CrossRef CAS
.
- L. Gil, J. M. Barat, E. Garcia-Breijo, J. Ibanez, R. Martinez-Manez, J. Soto, E. Llobet, J. Brezmes, M. C. Aristoy and F. Toldra, Sens. Actuators, B, 2008, 131, 362–370 CrossRef CAS PubMed
.
- L. Gil, J. M. Barat, D. Baigts, R. Martinez-Manez, J. Soto, E. Garcia-Breijo, M. C. Aristoy, F. Toldra and E. Llobet, Food Chem., 2011, 126, 1261–1268 CrossRef CAS PubMed
.
- A. Kutyla-Olesiuk, M. Nowacka, M. Wesoly and P. Ciosek, Sens. Actuators, B, 2013, 187, 234–240 CrossRef CAS PubMed
.
- N. Sadrieh, J. Brower, L. Yu, W. Doub, A. Straughn, S. Machado, F. Pelsor, E. Saint Martin, T. Moore, J. Reepmeyer, D. Toler, A. Nguyenpho, R. Roberts, D. J. Schuirmann, M. Nasr and L. Buhse, Pharm. Res., 2005, 22, 1747–1756 CrossRef CAS PubMed
.
- Z. Wei and J. Wang, J. Food Eng., 2013, 117, 158–164 CrossRef CAS PubMed
.
- K. Toko, Biomimetic sensor technology, Cambridge University Press, 2000 Search PubMed.
- T. U. Tran, K. Suzuki, H. Okadome, S. Homma and K. Ohtsubo, Food Chem., 2004, 88, 557–566 CrossRef CAS PubMed
.
- M. Ito, K. Ikehama, K. Yoshida, T. Haraguchi, M. Yoshida, K. Wada and T. Uchida, Int. J. Pharm., 2013, 441, 121–127 CrossRef CAS PubMed
.
- A. H. Kiranmayee, P. C. Panchariya and A. L. Sharma, Sens. Actuators, A, 2012, 187, 154–161 CrossRef CAS PubMed
.
- L. Sipos, Z. Kovacs, V. Sagi-Kiss, T. Csiki, Z. Kokai, A. Fekete and K. Heberger, Food Chem., 2012, 135, 2947–2953 CrossRef CAS PubMed
.
- D. Szollosi, Z. Kovacs, A. Gere, L. Sipos, Z. Kokai and A. Fekete, IEEE Sens. J., 2012, 12, 3119–3123 CrossRef
.
- V. H. Gaidhane, Y. V. Hote and V. Singh, Sadhana, 2014, 39, 317–331 CrossRef PubMed
.
- T. Z. Shen and Z. W. Fang, Digital Image Processing and Pattern Recognition, Beijing Ligong University Press, China, 1998, pp. 150–155 Search PubMed
.
- B. Zitova and J. Flusser, Image Vis. Comput., 2003, 21, 977–1000 CrossRef
.
- S. Y. Tian, S. P. Deng and Z. X. Chen, Sens. Actuators, B, 2007, 123, 1049–1056 CrossRef CAS PubMed
.
- F. Winquist, Microchim. Acta, 2008, 163, 3–10 CrossRef CAS
.
- M. Ramesh, K. R. Bhattacharya and J. R. Mitchell, Crit. Rev. Food Sci. Nutr., 2000, 40, 449–460 CrossRef CAS PubMed
.
- Z. K. Zhou, K. Robards, S. Helliwell and C. Blanchard, Int. J. Food Sci. Technol., 2002, 37, 849–868 CrossRef CAS
.
- F. S. G. Hashemi, M. Y. Rafii, M. R. Ismail, T. M. M. Mahmud, H. A. Rahim, R. Asfaliza, M. A. Malek and M. A. Latif, Crit. Rev. Plant Sci., 2013, 32, 445–457 CrossRef CAS PubMed
.
| This journal is © The Royal Society of Chemistry 2015 |

