Towards computational design of zeolite catalysts for CO2 reduction†
A. W. Thornton*a,
D. A. Winklerabe,
M. S. Liuc,
M. Haranczykd and
D. F. Kennedya
aCSIRO Manufacturing Flagship, Private Bag 10, Clayton South MDC, Victoria 3169, Australia. E-mail: Aaron.Thornton@csiro.au
bMonash Institute of Pharmaceutical Sciences, 390 Royal Parade, Parkville 3052, Australia
cCSIRO Digital Productivity and Services Flagship, Private Bag 10, Clayton South MDC, Victoria 3169, Australia
dLawrence Berkeley National Laboratory, Computational Research Division, Berkeley, CA 94720, USA
eLatrobe Institute for Molecular Science, Latrobe University, Bundoora 3086, Australia
First published on 30th April 2015
Abstract
Carbon dioxide, an energy waste by-product with significant environmental consequences can be utilized and converted into useful chemical products such as formic acid, formaldehyde, methanol or methane, but more energy and cost efficient catalytic processes are required. Here we develop the methodology for the intelligent selection of porous zeolites for dual-adsorption of hydrogen and carbon dioxide as templates for preparing the optimal catalytic environment for carbon dioxide reduction. Useful zeolite catalysts were computationally screened from over 300 thousand zeolite structures using a combination of molecular simulation and machine-learning techniques. Several of the top candidates were very promising energy-efficient templates for catalysis with the potential to perform at 50% above conventional reactors. It is also found that an optimal cavity size of around 6 Å is required to maximize the change in entropy–enthalpy upon adsorption with a maximum void space >30% to boost product formation per volume of material.
Introduction
The environmental impact of global CO2 levels is well documented.3,4 For the past decade the focus of atmospheric remediation has been on long term storage of CO2 via geosequestration to mitigate the effect of societies use of fossil fuels. Increasingly, there is a move away from the energy intensive process of carbon capture and storage (CCS) to carbon capture and utilization (CCU).3 Approaches to CCU may be as simple as new large scale uses for supercritical CO2, or application of CO2 as a growth medium for algal growth. An increasingly attractive alternative utilization method is the catalyzed chemical transformation of CO2 into useful and saleable chemical feedstocks and fuels such as formic acid, formaldehyde, methanol and methane.2,5–8 Hydrogen is a promising fuel but it lacks the energy density for practical use. Conversion of CO2 and hydrogen into liquid fuels such as methane or methanol is more desirable from a convenience and energy density perspective. However, significant improvement in catalyst technology for CO2 conversion is required for CCU to become an economically viable alternative. Recent advances in catalytic include the direct synthesis of formic acid from carbon dioxide by hydrogenation using a ruthenium catalyst by Moret et al.9 and the photothermal reduction of CO2 to methane in the gas phase over nanocatalysts by Meng et al.10 Moreover, Graciani et al.11 recently reported methanol synthesis from CO2 with novel composites. While these studies demonstrate advances in CO2 conversion, the discovery procedure is limited to a small set of materials through experimental trial and error.Virtual screening is a method that broadly combines computational algorithms for selecting promising candidates from a large library of materials.12 In many fields of materials science, there are an unlimited number of possible structures to choose from for a particular application. Combinatorial methods, in combination with high-throughput synthesis and characterization methods, have attempted to address this challenge by increasing the number of candidates that can be tested, but this requires large amounts of time and resources.13 Increasing recognition of the enormity of materials compositional and property space is also driving alternative methods for materials discovery, such as computational design, virtual screening, and materials evolutionary methods. Virtual screening or high-throughput computational screening provides an inexpensive and rapid method to pre-screen candidates before pursuing synthesis. Successful examples of virtual screening include:
- the selection of porous adsorbents for the separation of linear, mono-branched, and di-branched isomers of alkanes for petrochemical applications.14
- the selection of zeolitic imidazolate framework (ZIF)-based membranes for clean energy applications including land fill gas purification, post-combustion CO2 separation and pre-combustion H2 separation.15
- the selection of zeolites and ZIFs for carbon dioxide capture.16
- the selection of metal–organic frameworks (MOFs) for carbon dioxide separation.17
- the selection of MOF analogues for water adsorption.18
- the selection of compounds for molecular docking in proteins for pharmaceutical inhibitors.19
- the selection of MOFs for methane storage.20
We have modified the methodology of virtual screening and applied it to predict the dual-adsorption of gases for catalyzed reactions in this study, depicted in Fig. 1. Porous catalysts such as zeolites offer large surface areas and active sites available for CO2 conversion and they can be ‘tuned’ to optimize their performance. There are ca. 200 known ideal silica zeolites21 and over a billion hypothetical zeolites22 developed from the bonding principles between silicon and oxygen. With an abundant database of structures there is an opportunity and a computational challenge to select the promising candidates that could act as excellent templates for porous catalysts. An important step in heterogeneous catalysis is the adsorption step before catalysis. The methodology for predicting gas adsorption within nanoporous materials is well established.18,23–25 Therefore we predict the gas stoichiometric adsorption properties within zeolite candidates and use this information to select the most promising zeolite for catalysis.
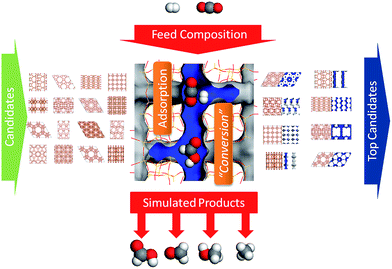 | ||
| Fig. 1 Virtual screening workflow for predicting stoichiometric adsorption properties in preparation for catalysis. | ||
Finally, machine learning methods based on Quantitative Structure–Property Relationships (QSPR) models offer a useful framework for interpreting the screening results and targeting the most important structural characteristics for further discovery.26,27 QSPR models were utilized by Fernandez et al.27 to investigate MOFs for methane storage, which revealed an optimal range of, pore sizes and void fraction. With a growing dataset of structures, QSPR models are needed to explore regions of the materials landscape unreachable by more computationally-intensive methods such as molecular dynamics and quantum chemistry. Other examples of QSPR modelling include the prediction of C60 solubility in various solvents, thermal conductivity of nanomaterials, operating conditions for optimal catalysis and bio-compatibility of polymeric materials.26,28–32 Here the QSPR method is applied to a relatively simple system to predict the gas adsorption and thermodynamic properties of zeolites based on a few structural descriptors.
Methodology
Virtual screening studies require a number of key components, such as the atomic structures, the structural descriptors (void fraction, surface area, heat of adsorption etc.), and the materials properties predicted from simulation. Here we describe the zeolite structures, the method for calculating descriptors, and the method for simulating material properties.Zeolite database
There are approximately 200 experimental zeolite frameworks33 and over a billion hypothetical zeolite structures constructed from the simple oxygen–silicon–oxygen bond repeated over all 230 space groups.22,34 Although many of the hypothetical structures are energetically inaccessible, there remains an enormous number of structures with a diverse range of pore morphology worthy of exploring. Previous screening work has narrowed the dataset down to around 300![[thin space (1/6-em)]](https://www.rsc.org/images/entities/char_2009.gif) 000–500
000–500![[thin space (1/6-em)]](https://www.rsc.org/images/entities/char_2009.gif) 000 energetically accessible structures, depending on the force field16 used. Computational resource demands mean that it is impractical to simulate adsorption isotherms for the entire dataset; therefore a subset must be chosen to adequately represent the entire dataset. Martin et al. developed a similarity descriptor for zeolite structures that captures the shape and geometrical characteristics of pores.35 Based on this, we selected a subset of 164 structures with maximal dissimilarity, i.e. with the most diverse set of pore characteristics. Overall, we analyze 167 ideal silica zeolites (after removing incomplete and energetically unfavourable frameworks), 164 hypothetical silica zeolites plus an additional ‘smart’ set of 60 zeolites chosen from the QSPR model described below.
000 energetically accessible structures, depending on the force field16 used. Computational resource demands mean that it is impractical to simulate adsorption isotherms for the entire dataset; therefore a subset must be chosen to adequately represent the entire dataset. Martin et al. developed a similarity descriptor for zeolite structures that captures the shape and geometrical characteristics of pores.35 Based on this, we selected a subset of 164 structures with maximal dissimilarity, i.e. with the most diverse set of pore characteristics. Overall, we analyze 167 ideal silica zeolites (after removing incomplete and energetically unfavourable frameworks), 164 hypothetical silica zeolites plus an additional ‘smart’ set of 60 zeolites chosen from the QSPR model described below.
Material properties
Overall we are interested in the catalytic properties of each candidate material. Catalysis is a difficult phenomenon to predict because of the multiple steps and levels of theory involved. To reduce the problem, we begin with the adsorption step of feed gas mixture. There are four main steps in the catalytic process:(1) the diffusion of the reactant gases to the active sites within the material from the feed stock,
(2) the adsorption of the reactant gases at the active sites,
(3) the catalytic conversion of the reactant gases into products, and,
(4) the desorption and diffusion of the products out of the material.
Each step contributes a thermodynamic and kinetic component to the overall efficiency. Here we focus on the thermodynamics of the second step whereby the reactants, H2 and CO2, co-adsorb within the pores of the catalyst in preparation for the third step of catalytic conversion. The dual-adsorption ratios, or the stoichiometric adsorption properties of the material, play a critical role in the conversion efficiency. Upon adsorption there is a change in entropy and enthalpy that promotes the succeeding conversion steps. A large change in entropy and enthalpy upon adsorption will cause the reactants to bind into position and their internal bonds to become strained in preparation for reaction. In addition, the difference in adsorption between CO2 and H2 will determine the likely product to form due to stoichiometric considerations. Feed compositions can be tuned to optimize the adsorbed composition for the target product. Finally, the amount of pore volume and surface area will also govern the amount of product formation per volume of material. Therefore, optimization of CO2 conversion lies in the choice of a porous catalyst with optimized structural features to maximize both the thermodynamics and production capacity.36,37
IAST is typically used to predict the adsorbed ratio of the components given the feed ratio.46,47 In our study, we are interested in the inverse problem of predicting the feed ratio necessary to achieve an adsorbed ratio close to the stoichiometry of the reaction of interest. Therefore we have rearranged the model to develop an inverse IAST, see ESI† for the mathematical solution.
where KH is the Henry's constant, P is pressure and M is the saturation loading. Henry's constant is calculated from the simulation of Widom insertions within the unit cell.50 While the saturation loading is approximated as the product of the helium pore volume and the liquid density of hydrogen.48,51
The change in enthalpy and entropy upon adsorption is considered a necessary step leading to the full catalytic conversion of carbon dioxide. In this study, we are interested in the catalytic activity of the materials for the reactions listed in Table 1. Thermodynamic data each reaction indicates the changes of enthalpy and entropy when the reaction occurs in the gas and liquid phase.1 It is important to note that the reactions are all exothermic when carried out in the liquid phase and less input energy is required because of the reduced enthalpy and entropy compared with the gas phase. Considering that the adsorbed phase is a similar state to the liquid phase with an even further reduction in enthalpy and entropy, this is a promising attribute to consider when selecting a zeolite.
| Reaction | Gas phase | Liquid phase | ||
|---|---|---|---|---|
| ΔHgas (kJ mol−1) | ΔSgas (J mol−1) | ΔHliquid (kJ mol−1) | ΔSliquid (J mol−1) | |
| Formic acid: CO2 + H2 → HCOOH | 15 | −87 | −31 | −195 |
| Formaldehyde: CO2 + 2H2 → HCOH + H2O | 36 | −64 | −8 | −201 |
| Methanol: CO2 + 3H2 → H3COH + H2O | −53 | −161 | −130 | −380 |
| Methane: CO2 + 4H2 → CH4 + 2H2O | −165 | −337 | −253 | −552 |
Quantitative structure–property relationships
We also employed statistical and machine learning (QSPR) modelling techniques to identify quantitative relationships between the zeolite structural characteristics and the simulated adsorption properties. The modelling methods employ Bayesian methods to optimize the complexity of any nonlinear models, and to therefore optimize the quantitative prediction power of the models. Bayesian methods with sparse priors can also identify the most relevant subsets of structural parameters that have the largest impact on the gas adsorption properties of the zeolites. A complete explanation of these modelling techniques is beyond the scope of this paper, as they have been extensively described in previous publications.26,52 In brief, we used a Bayesian regularized feed-forward neural network with three layers, the input nodes, hidden nodes, and output nodes. The input and output nodes employ linear transfer functions, effectively generating a weighted sum of the contributions from the descriptors, or hidden layer nodes respectively. The hidden nodes use a nonlinear sigmoidal transfer function to generate nonlinear models. Bayesian regularization is used to control the degree of nonlinearity of the model to find the best balance between bias (model too simple to capture underlying structure–property relationships) and variance (model overly complex and over fitting). The hidden layer used a small number of nodes (usually 2–3) as the regularization ensures that the number of effective weights (fitted parameters) in the model is relatively independent of the number of hidden layer nodes (and fully connected neural network weights). Models were trained until the Bayesian evidence for the model reached maximum, obviating the need for a validation set to stop neural network training. This machine learning method can model structure–property relationships of arbitrary complexity given sufficient training data. Validation of the predictive power of QSPR models is very important. We held aside 20% of the data set as an independent test set never used for model development. The models derived from the remaining 80% of the data were used to predict the performance of zeolites in the test set. In addition, a diverse set of hypothetical structures was used as a training set that was tested on the IZA (International Zeolite Association) set, and vice versa. The former approach proved more accurate which means that the diverse hypothetical set is a reasonable representation of the complete IZA set. Finally, the combination of the diverse hypothetical set and the IZA set was used as the training set to select a secondary ‘smart’ set based on an optimal combination of structural features that maximize dual-adsorption properties.The descriptors for the QSPR model include the maximum pore size, surface area, void fraction, density and heat of adsorption. Heat of adsorption is the isosteric heat of adsorption calculated from the simulation data using ΔH = ΔU − RT, where ΔU is the energy of adsorption, R is the universal gas constant and T is temperature. Maximum pore size was calculated using the Zeo++ analyzer based on the Voronoi decomposition of the atomic coordinates.53,54 Void fraction was calculated using Widom insertions of helium at 300 K based on the Rosenbluth factor described by Smit and Frenkel.50 While surface area is the accessible surface area based geometrically on a spherical probe size of nitrogen (3.681 Å), shown to compare well with experimental BET surface areas.55 In addition to guiding the choice of a ‘smart’ set, the machine learning method also provides insight into the most important structural parameters.
Results and discussion
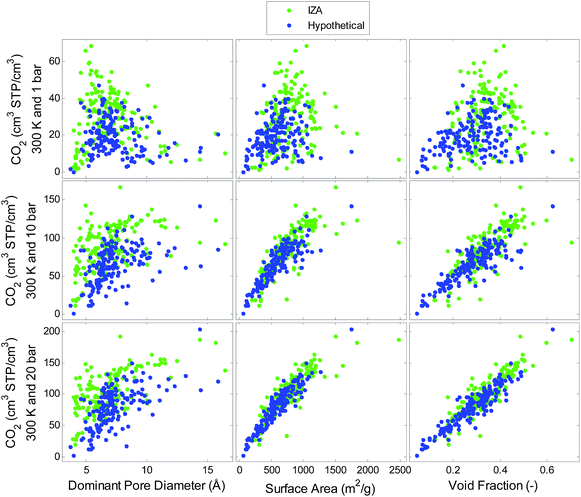
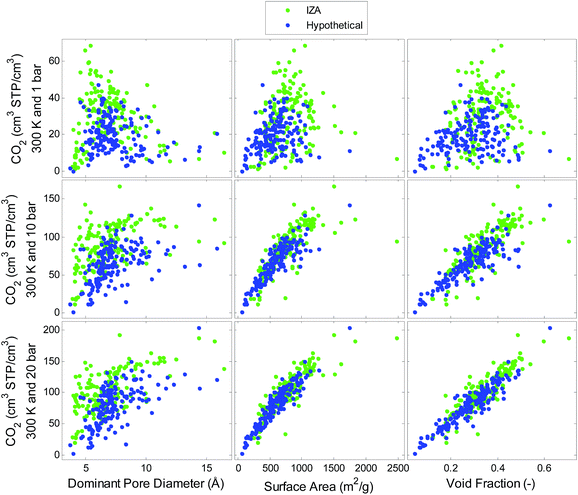
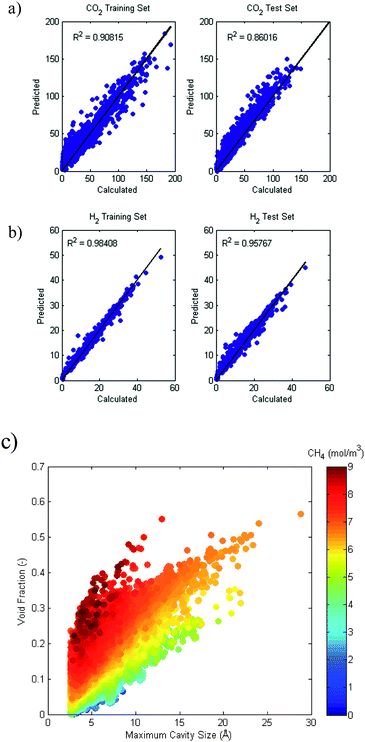
Simulated single component adsorption is viewed as a function of structural descriptors in Fig. 2 and 3 for CO2 and H2, respectively. The relationships between CO2 uptake and the structural features depend on pressure. There is a strong linear correlation between CO2 uptake and void fraction at high pressures (20 bar) while at lower pressures (1 bar) there is a more complex relationship between uptake and pore diameter indicating an optimal pore size that maximizes uptake. The correlations for H2 on the other hand, do not depend on pressure. There is a strong relationship with void fraction and surface area at all pressures. Similar trends are also observed for volumetric uptake, see Fig. S1 and S2 in ESI.†A QSPR model is developed using the following input parameters: temperature, pressure, pore diameter, density, surface area, void fraction and heat of adsorption. The hypothetical dataset is used to train the model which is then tested on the IZA dataset. The model predictions for both CO2 and H2 uptake were excellent, with R2 values of 0.86 and 0.96, respectively shown in Fig. 4. The models could predict the gas adsorption with standard errors of 9.5 cm3 STP per cm3 (CO2), and 1.3 cm3 STP per cm3 (H2). We conclude that the hypothetical set with high diversity in pore characteristics is an excellent training set for predicting uptake in all-silica zeolites at a range of temperatures and pressures. When sparse feature selection was imposed, the results indicated that temperature, pressure, density, surface area, and void fraction were the most relevant contributors to the CO2 and H2 uptake models. The heat of adsorption was found to be less important for predicting uptake using the QSPR models. However, as will be shown further in the article that heat of adsorption plays a critical role in contributing to the thermodynamics of reaction.
The simulated pure gas adsorption data is used to predict the dual-adsorption of the mixture through the IAST model. Assuming 100% yield, the dual-adsorbed mixture converts to a quantity of product. With a 1![[thin space (1/6-em)]](https://www.rsc.org/images/entities/char_2009.gif) :
:![[thin space (1/6-em)]](https://www.rsc.org/images/entities/char_2009.gif) 1 (CO2
1 (CO2![[thin space (1/6-em)]](https://www.rsc.org/images/entities/char_2009.gif) :
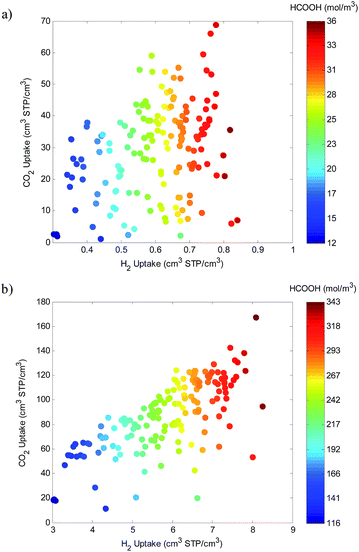
:![[thin space (1/6-em)]](https://www.rsc.org/images/entities/char_2009.gif) H2) stoichiometry, we plot the quantity of formic acid produced at 1 and 10 bar with the corresponding pure gas uptake, see Fig. 5. Interestingly, the production of formic acid is hydrogen limited at low pressures and dual-gas limited at higher pressures. This is because at low pressures there is a sufficient amount of CO2 adsorbed while there is insufficient H2 adsorption. At high pressures on the other hand, there is sufficient uptake of both gases and a more linear dependence is observed.
H2) stoichiometry, we plot the quantity of formic acid produced at 1 and 10 bar with the corresponding pure gas uptake, see Fig. 5. Interestingly, the production of formic acid is hydrogen limited at low pressures and dual-gas limited at higher pressures. This is because at low pressures there is a sufficient amount of CO2 adsorbed while there is insufficient H2 adsorption. At high pressures on the other hand, there is sufficient uptake of both gases and a more linear dependence is observed.
In a similar manner, the quantity of product is generated for each stoichiometry including formic acid, formaldehyde, methanol and methane that require the stoichiometric adsorption ratios 1![[thin space (1/6-em)]](https://www.rsc.org/images/entities/char_2009.gif) :
:![[thin space (1/6-em)]](https://www.rsc.org/images/entities/char_2009.gif) 1, 1
1, 1![[thin space (1/6-em)]](https://www.rsc.org/images/entities/char_2009.gif) :
:![[thin space (1/6-em)]](https://www.rsc.org/images/entities/char_2009.gif) 2, 1
2, 1![[thin space (1/6-em)]](https://www.rsc.org/images/entities/char_2009.gif) :
:![[thin space (1/6-em)]](https://www.rsc.org/images/entities/char_2009.gif) 3 and 1
3 and 1![[thin space (1/6-em)]](https://www.rsc.org/images/entities/char_2009.gif) :
:![[thin space (1/6-em)]](https://www.rsc.org/images/entities/char_2009.gif) 4 (CO2
4 (CO2![[thin space (1/6-em)]](https://www.rsc.org/images/entities/char_2009.gif) :
:![[thin space (1/6-em)]](https://www.rsc.org/images/entities/char_2009.gif) H2), respectively, see Fig. 6a. There is a lot less methane produced than formic acid because methane requires four H2 molecules per CO2 rather than a 1
H2), respectively, see Fig. 6a. There is a lot less methane produced than formic acid because methane requires four H2 molecules per CO2 rather than a 1![[thin space (1/6-em)]](https://www.rsc.org/images/entities/char_2009.gif) :
:![[thin space (1/6-em)]](https://www.rsc.org/images/entities/char_2009.gif) 1 ratio. As discussed earlier, hydrogen adsorption is the limiting factor in dual-adsorption for catalysis. As shown from the QSPR model there are many factors that affect the dual-adsorbed quantity including surface area, void fraction and density.
1 ratio. As discussed earlier, hydrogen adsorption is the limiting factor in dual-adsorption for catalysis. As shown from the QSPR model there are many factors that affect the dual-adsorbed quantity including surface area, void fraction and density.
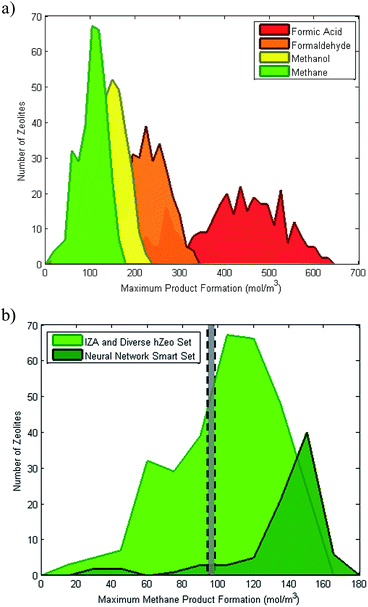 | ||
Fig. 6 Distribution of predicted product formation (mol of product per m3 of zeolite) assuming 100% conversion of all adsorbed reactants. (a) Formic acid, formaldehyde, methanol and methane that require the stoichiometric adsorption ratios 1![[thin space (1/6-em)]](https://www.rsc.org/images/entities/char_2009.gif) : :![[thin space (1/6-em)]](https://www.rsc.org/images/entities/char_2009.gif) 1, 1 1, 1![[thin space (1/6-em)]](https://www.rsc.org/images/entities/char_2009.gif) : :![[thin space (1/6-em)]](https://www.rsc.org/images/entities/char_2009.gif) 2, 1 2, 1![[thin space (1/6-em)]](https://www.rsc.org/images/entities/char_2009.gif) : :![[thin space (1/6-em)]](https://www.rsc.org/images/entities/char_2009.gif) 3 and 1 3 and 1![[thin space (1/6-em)]](https://www.rsc.org/images/entities/char_2009.gif) : :![[thin space (1/6-em)]](https://www.rsc.org/images/entities/char_2009.gif) 4 (CO2 4 (CO2![[thin space (1/6-em)]](https://www.rsc.org/images/entities/char_2009.gif) : :![[thin space (1/6-em)]](https://www.rsc.org/images/entities/char_2009.gif) H2), respectively. (b) Methane formation with IZA and diverse hypothetical set with neural network-based smart set. Grey section represents conventional product formation from Sabatier reactors.2 H2), respectively. (b) Methane formation with IZA and diverse hypothetical set with neural network-based smart set. Grey section represents conventional product formation from Sabatier reactors.2 | ||
The QSPR neural network model is utilized to select a secondary “smart” set from the 300![[thin space (1/6-em)]](https://www.rsc.org/images/entities/char_2009.gif) 000 hypothetical zeolite set with structural features likely to further maximize the adsorption uptake. The neural network-based smart set is shown in Fig. 6b, indicating that new structures are discovered with a marginally higher potential for product formation above the conventional Sabatier reactors that run at a range of operating conditions 10–20 bar and 300–500 K.2 Note that these estimates are assuming 100% conversion of all adsorbed gases. In reality this is not the case and the actual conversion efficiency also depends on the energetic landscape, which will be explored using the enthalpy and entropy of adsorption.
000 hypothetical zeolite set with structural features likely to further maximize the adsorption uptake. The neural network-based smart set is shown in Fig. 6b, indicating that new structures are discovered with a marginally higher potential for product formation above the conventional Sabatier reactors that run at a range of operating conditions 10–20 bar and 300–500 K.2 Note that these estimates are assuming 100% conversion of all adsorbed gases. In reality this is not the case and the actual conversion efficiency also depends on the energetic landscape, which will be explored using the enthalpy and entropy of adsorption.
The enthalpy and entropy of methane production via the Sabatier reaction (the methanation of CO2) is measured experimentally to be 165 kJ mol−1 and 172 J mol−1 K−1, respectively. Here in Fig. 7a we plot the predicted change in enthalpy and entropy upon adsorption of the required CO2 and H2 ratio. The ultimate conversion efficient will depend on the free energy barrier at the transition step which can be different for each zeolite, shown in Fig. 7b. However, the adsorbed state does boost the free energy of the system towards the transition state in all cases. Therefore the thermodynamics of physical adsorption is a critical step before the chemical conversion, and materials with a greater change in both entropy and enthalpy of adsorption are more promising candidates for efficient catalysis.
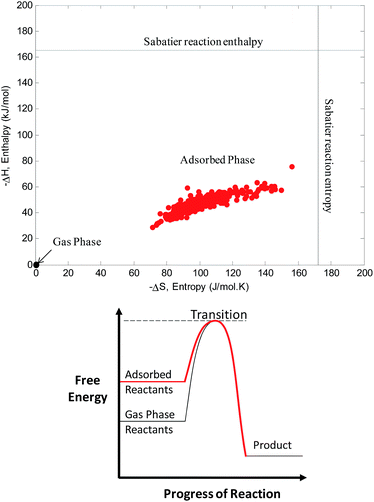 | ||
| Fig. 7 (a) Enthalpy and entropy of reactant adsorption for all zeolites (red dots) compared with experimental enthalpy and entropy of methane production via the Sabatier reaction2 (black horizontal and vertical lines, respectively). (b) Schematic of the reduced energy barrier for reaction as a consequence of adsorption. | ||
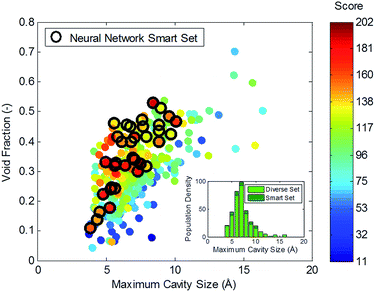
Finally we combine the thermodynamic factors with the degree of production to score the zeolites, see Fig. 8. The score factor is the product of the change in Gibbs free energy with quantity of product formation. The top candidates will have a maximum dual-adsorption capacity for the required stoichiometry as well as the large change in enthalpy and entropy in preparation for the catalysis step. When plotted against the structural characteristics void fraction and maximum cavity size, it is evident that there is an optimal range of cavity sizes (∼6 Å). It is likely that these cavities offer the correct energetic environment for strong dual-adsorption. Those materials with many of these cavities, characterized by void fraction, will also offer a high production output. Once again, the neural network-based smart set performs higher on the score factor than the randomly chosen set. Theoretically, the neural network model could be retrained with the new data and used to choose a third smart set, a fourth etc. in an iterative manner. Here we only demonstrate that one round of neural network selection is sufficient to discover more promising structures.
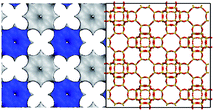
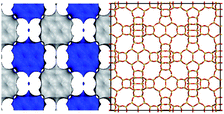
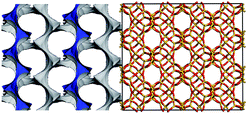
From this score, five top candidates are chosen and listed in Table 2 for methane production at ambient conditions, while ESI† lists candidates for other product formation. The five top candidates provide a diversity in pore shapes and topology. Interestingly there are two ideal silica frameworks, namely PUN and STW, which perform as well as the hypothetical structures. PUN, originally named PKU-9, was first discovered by Peking University with 10-ring and 8-ring channels running in parallel.56 STW (or SU-32) was synthesized as part of the first family of chiral structures, a useful properties for sorption/separation and catalytic processes.57 The window size of 3.8 Å is used as a cut-off for methane transport, eliminating structures that would not be capable of exporting the converted product. We observe that the top candidates all have a dominant pore size of ∼6 Å with high amounts of void space >30%.
Thermodynamics play a critical role in determining the optimal catalyst however kinetics is also an important factor that includes reaction, desorption and diffusion rates. We have shown that there is an optimal cavity size to maximize the dual adsorption properties but the optimal pore size for diffusion is yet to be determined. During operation the reactants will adsorb within the catalyst, react into products and exit by diffusion. The molecular diameter of the products considered here are larger than the reactants and therefore the diffusion of the product could be the rate-limiting determinant. The screening procedure presented here has discarded those structures that would not allow the products to diffuse through due to the restrictive window size. Other factors to consider include tortuosity that could increase the resistance of product diffusion unnecessarily, pore shape that could be unfavourable for product orientation and pore uniformity where fluctuations in pore diameter could present multiple energy barriers that could further inhibit product flow. An ideal zeolitic structure for catalyst would consist of a stable and highly connected network of pores with maximum porosity and optimal pore size (or range of sizes) for adsorption, reaction and diffusion. Overall, it is very difficult to consider all factors when determining the optimal catalyst but this preliminary screening procedure is a reasonable step forward.
Future work includes the incorporation of ions to further encourage catalytic activity. The porosity templates investigated here are a good basis for this future work. The interaction between gases and ions have been modelled well by García-Sánchez et al.,58 Kim et al.59 and Darkrim et al.,60 establishing the ground-work for the next stage of screening. The addition of by-product water must also be considered which could hinder the transport of products, adsorption of precursors and reaction kinetics. In addition, quantum-based calculations could accurately predict the activation energy for catalysis, adding an additional layer to the screening procedure. This concept has been discussed in other virtual screening studies to optimize the computational time for large amounts of materials by hierarchically laying the different computational routines with varying accuracy and computational time.12,61 In these procedures, less accurate but fast calculations are performed first to narrow the scope of structures, followed by more accurate but slower calculations to further narrow the amount of promising candidates to a synthesizable number. Ultimately, neural network-based decision-making can play a role in scaling this screening process to an indefinite amount of materials where structural descriptors are calculated almost instantaneously. Given the continually growing databases of new materials through programs such as the Materials Genome Initiative, a scalable screening strategy is necessary to manage large amounts of data. In this work, the first procedure steps are mapped and demonstrated for choosing promising catalysis templates for carbon dioxide utilization.
Conclusions
A virtual screening procedure is mapped and utilized to discover the optimal zeolite templates for conversion of carbon dioxide into useful products. Over 300 thousand structures with varying porosity features are screened using a combination of GCMC adsorption simulations, IAST dual-adsorption models, energy-entropy calculations and neural network-based QSPR models. Top candidates are listed for the production of methane, methanol, formic acid and formaldehyde, all requiring different stoichiometric adsorption ratios of carbon dioxide and hydrogen.Robust structure–property relationships are found between structural descriptors such as pore size, surface area and void fraction, and zeolite performance. Neural network-based QSPR models were valuable in identifying more promising candidates from a growing set of zeolite frameworks. Top candidates have a common cavity size of around 6 Å, which maximizes the strength of dual-adsorption with a maximum void space greater than 30% to increase product quantity.
Future work includes the incorporation of water (by-product), ions to enhance catalytic activity and quantum mechanics-based calculations to accurately determine reaction kinetics and finally synthetic trial.
Acknowledgements
AWT, DAW, MSL and DFK acknowledge the support of the CSIRO Advanced Materials, Computational & Simulation Sciences, and Intelligent Processing Transformational Capability Platforms. AWT and DFK acknowledge the Science and Industry Endowment Fund for support through the ‘Solving the Energy-Waste Roadblock’ project. MH was supported by the U.S. Department of Energy, Office of Basic Energy Sciences, Division of Chemical Sciences, Geosciences and Biosciences under Award DE-FG02-12ER16362.Notes and references
- P. Styring, E. A. Quadrelli and K. Armstrong, Carbon Dioxide Utilisation: Closing the Carbon Cycle, Elsevier, 2015 Search PubMed.
- W. Wang, S. Wang, X. Ma and J. Gong, Chem. Soc. Rev., 2011, 40, 3703–3727 RSC.
- M. Z. Jacobson, Energy Environ. Sci., 2009, 2, 148–173 CAS.
- N. von der Assen, J. Jung and A. Bardow, Energy Environ. Sci., 2013, 6, 2721–2734 CAS.
- E. J. Maginn, J. Phys. Chem. Lett., 2010, 1, 3478–3479 CrossRef CAS.
- Y. Xie, T.-T. Wang, X.-H. Liu, K. Zou and W.-Q. Deng, Nat. Commun., 2013, 4, 1960 Search PubMed.
- P. Lanzafame, G. Centi and S. Perathoner, Chem. Soc. Rev., 2014, 43, 7562–7580 RSC.
- X. Meng, T. Wang, L. Liu, S. Ouyang, P. Li, H. Hu, T. Kako, H. Iwai, A. Tanaka and J. Ye, Angew. Chem., 2014, 126, 11662–11666 CrossRef PubMed.
- S. Moret, P. J. Dyson and G. Laurenczy, Nat. Commun., 2014, 5, 1–7 Search PubMed.
- X. Meng, T. Wang, L. Liu, S. Ouyang, P. Li, H. Hu, T. Kako, H. Iwai, A. Tanaka and J. Ye, Angew. Chem., 2014, 126, 11662–11666 CrossRef PubMed.
- J. Graciani, K. Mudiyanselage, F. Xu, A. E. Baber, J. Evans, S. D. Senanayake, D. J. Stacchiola, P. Liu, J. Hrbek, J. F. Sanz and J. A. Rodriguez, Science, 2014, 345, 546–550 CrossRef CAS PubMed.
- Y. J. Colon and R. Q. Snurr, Chem. Soc. Rev., 2014, 43, 5735–5749 RSC.
- R. H. Crabtree, Chem. Commun., 1999, 1611–1616, 10.1039/a901022j.
- D. Dubbeldam, R. Krishna, S. Calero and A. Ö. Yazaydın, Angew. Chem., Int. Ed., 2012, 51, 11867–11871 CrossRef CAS PubMed.
- A. W. Thornton, D. Dubbeldam, M. S. Liu, B. P. Ladewig, A. J. Hill and M. R. Hill, Energy Environ. Sci., 2012, 5, 7637–7646 CAS.
- L.-C. Lin, A. H. Berger, R. L. Martin, J. Kim, J. A. Swisher, K. Jariwala, C. H. Rycroft, A. S. Bhown, M. W. Deem, M. Haranczyk and B. Smit, Nat. Mater., 2012, 11, 633–641 CrossRef CAS PubMed.
- C. E. Wilmer, O. K. Farha, Y.-S. Bae, J. T. Hupp and R. Q. Snurr, Energy Environ. Sci., 2012, 5, 9849–9856 CAS.
- P. Canepa, C. A. Arter, E. M. Conwill, D. H. Johnson, B. A. Shoemaker, K. Z. Soliman and T. Thonhauser, J. Mater. Chem. A, 2013, 1, 13597–13604 CAS.
- Y. Zhang, S. Yang, Y. Jiao, H. Liu, H. Yuan, S. Lu, T. Ran, S. Yao, Z. Ke, J. Xu, X. Xiong, Y. Chen and T. Lu, J. Chem. Inf. Model., 2013, 53, 3163–3177 CrossRef CAS PubMed.
- C. E. Wilmer, M. Leaf, C. Y. Lee, O. K. Farha, B. G. Hauser, J. T. Hupp and R. Q. Snurr, Nat. Chem., 2011, 4, 83–89 CrossRef PubMed.
- C. Baerlocher and L. B. McCusker, Database of Zeolite Structures, http://www.iza-structure.org/databases/.
- M. W. Deem, R. Pophale, P. A. Cheeseman and D. J. Earl, J. Phys. Chem. C, 2009, 113, 21353–21360 CAS.
- L. J. Abbott, N. B. McKeown and C. M. Colina, J. Mater. Chem. A, 2013, 1, 11950–11960 CAS.
- Z. Xiang and D. Cao, J. Mater. Chem. A, 2013, 1, 2691–2718 CAS.
- M. Calvaresi and F. Zerbetto, J. Mater. Chem. A, 2014, 2, 12123–12135 CAS.
- T. Le, V. C. Epa, F. R. Burden and D. A. Winkler, Chem. Rev., 2012, 112, 2889–2919 CrossRef CAS PubMed.
- M. Fernandez, T. K. Woo, C. E. Wilmer and R. Q. Snurr, J. Phys. Chem. C, 2013, 117, 7681–7689 CAS.
- V. C. Epa, A. L. Hook, C. Chang, J. Yang, R. Langer, D. G. Anderson, P. Williams, M. C. Davies, M. R. Alexander and D. A. Winkler, Adv. Funct. Mater., 2014, 24, 2085–2093 CrossRef CAS PubMed.
- M. Salahinejad, T. C. Le and D. A. Winkler, J. Chem. Inf. Model., 2013, 53, 223–229 CrossRef CAS PubMed.
- M. Salahinejad, T. C. Le and D. A. Winkler, Mol. Pharm., 2013, 10, 2757–2766 CrossRef CAS PubMed.
- V. C. Epa, J. Yang, Y. Mei, A. L. Hook, R. Langer, D. G. Anderson, M. C. Davies, M. R. Alexander and D. A. Winkler, J. Mater. Chem., 2012, 22, 20902–20906 RSC.
- V. C. Epa, F. R. Burden, C. Tassa, R. Weissleder, S. Shaw and D. A. Winkler, Nano Lett., 2012, 12, 5808–5812 CrossRef CAS PubMed.
- C. Baerlocher and L. B. McCusker, 2011, http://www.iza-structure.org/databases/.
- R. Pophale, P. A. Cheeseman and M. W. Deem, Phys. Chem. Chem. Phys., 2011, 13, 12407–12412 RSC.
- R. L. Martin, B. Smit and M. Haranczyk, J. Chem. Inf. Model., 2011, 52, 308–318 CrossRef PubMed.
- D. J. Parrillo and R. J. Gorte, Catal. Lett., 1992, 16, 17–25 CrossRef CAS.
- N. Sun, X. Wen, F. Wang, W. Wei and Y. Sun, Energy Environ. Sci., 2010, 3, 366–369 CAS.
- E. García-Pérez, J. B. Parra, C. O. Ania, A. García-Sánchez, J. M. Baten, R. Krishna, D. Dubbeldam and S. Calero, Adsorption, 2007, 13, 469–476 CrossRef.
- R. Babarao, Z. Hu, J. Jiang, S. Chempath and S. I. Sandler, Langmuir, 2007, 23, 659–666 CrossRef CAS PubMed.
- K. S. Deeg, J. J. Gutiérrez-Sevillano, R. Bueno-Pérez, J. B. Parra, C. O. Ania, M. Doblaré and S. Calero, J. Phys. Chem. C, 2013, 117, 14374–14380 CAS.
- D. Dubbeldam, S. Calero, D. E. Ellis and R. Q. Snurr, Mol. Simul., 2015, 1–21 CrossRef PubMed.
- J. A. O'Brien and A. L. Myers, Ind. Eng. Chem. Res., 1988, 27, 2085–2092 CrossRef.
- A. L. Myers and J. M. Prausnitz, AIChE J., 1965, 11, 121 CrossRef CAS PubMed.
- J. Perez-Carbajo, P. Gomez-Alvarez, R. Bueno-Perez, P. J. Merkling and S. Calero, Phys. Chem. Chem. Phys., 2014, 16, 5678–5688 RSC.
- A. Erto, A. Lancia and D. Musmarra, Microporous Mesoporous Mater., 2012, 154, 45–50 CrossRef CAS PubMed.
- J. Chen, L. S. Loo and K. Wang, J. Chem. Eng. Data, 2011, 56, 1209–1212 CrossRef CAS.
- J. A. Swisher, L.-C. Lin, J. Kim and B. Smit, AIChE J., 2013, 59, 3054–3064 CrossRef CAS PubMed.
- C. M. Simon, J. Kim, L.-C. Lin, R. L. Martin, M. Haranczyk and B. Smit, Phys. Chem. Chem. Phys., 2014, 16, 5499–5513 RSC.
- S. Sircar, R. Mohr, C. Ristic and M. B. Rao, J. Phys. Chem. B, 1999, 103, 6539–6546 CrossRef CAS.
- D. Frenkel and B. Smit, Understanding molecular simulation: From algorithms to applications, Academic Press, San Diego, 2002 Search PubMed.
- A. L. Myers, Colloids Surf., A, 2004, 241, 9–14 CrossRef CAS PubMed.
- F. R. Burden and D. A. Winkler, QSAR Comb. Sci., 2009, 28, 1092–1097 CAS.
- M. Haranczyk, C. H. Rycroft, R. L. Martin and T. F. Willems, 2012, http://hhtp://www.zeoplusplus.org.
- T. F. Willems, C. H. Rycroft, M. Kazi, J. C. Meza and M. Haranczyk, Microporous Mesoporous Mater., 2012, 149, 134–141 CrossRef CAS PubMed.
- T. Duren, F. Millange, G. Ferey, K. S. Walton and R. Q. Snurr, J. Phys. Chem. C, 2007, 111, 15350–15356 Search PubMed.
- J. Su, Y. Wang, Z. Wang and J. Lin, J. Am. Chem. Soc., 2009, 131, 6080–6081 CrossRef CAS PubMed.
- L. Tang, L. Shi, C. Bonneau, J. Sun, H. Yue, A. Ojuva, B.-L. Lee, M. Kritikos, R. G. Bell, Z. Bacsik, J. Mink and X. Zou, Nat. Mater., 2008, 7, 381–385 CrossRef CAS PubMed.
- A. García-Sánchez, C. O. Ania, J. B. Parra, D. Dubbeldam, T. J. H. Vlugt, R. Krishna and S. a. Calero, J. Phys. Chem. C, 2009, 113, 8814–8820 Search PubMed.
- J. Kim, L.-C. Lin, J. A. Swisher, M. Haranczyk and B. Smit, J. Am. Chem. Soc., 2012, 134, 18940–18943 CrossRef CAS PubMed.
- F. Darkrim, A. Aoufi, P. Malbrunot and D. Levesque, J. Chem. Phys., 2000, 112, 5991–5999 CrossRef CAS PubMed.
- T. Watanabe and D. S. Sholl, Langmuir, 2012, 28, 14114–14128 CrossRef CAS PubMed.
Footnote |
| † Electronic supplementary information (ESI) available: Inverse-IAST formulation, force field tables and complete list of top candidates. See DOI: 10.1039/c5ra06214d |
| This journal is © The Royal Society of Chemistry 2015 |


