DOI:
10.1039/C5RA06148B
(Paper)
RSC Adv., 2015,
5, 53529-53542
Sonochemical synthesis of mesoporous ZrFe2O5 and its application for degradation of recalcitrant pollutants†
Received
7th April 2015
, Accepted 10th June 2015
First published on 10th June 2015
Abstract
In this paper, we have reported the sonochemical synthesis and characterization of zirconium ferrite (ZrFe2O5), and its use as a catalyst in advanced oxidation processes (AOPs) using decolorization/degradation of azo and non-azo dyes as model processes. The efficacy of ZrFe2O5 for dye decolorization has been compared with the conventional catalyst TiO2 synthesized using sonochemical sol–gel method. Sonochemically synthesized ZrFe2O5 and TiO2 have been characterized using PSD, XRD, FESEM, TEM, DRS, BET and TGA. ZrFe2O5 is revealed to have a lower band gap energy than TiO2. However, the α-Fe2O3 (hematite) phase in ZrFe2O5 acts as a recombination center of photogenerated electrons and holes, which adversely affects the photo-activity of ZrFe2O5. In the context of degradation of recalcitrant pollutants, this adverse effect is compensated by Fenton activity of the α-Fe2O3 (hematite) phase which is stimulated by addition of H2O2. Sonochemically synthesized ZrFe2O5 also has high adsorption capacity for the textile dyes that assists their effective degradation through Fenton and photocatalytic mechanisms. The decolorization experiments have employed individual AOPs of sonolysis, photocatalysis, (heterogeneous) Fenton and various combinations of these as hybrid AOPs. Due to combined facets of photo- and Fenton-activity, ZrFe2O5 is a better catalyst for hybrid AOPs than TiO2. Nonetheless, the Fenton-activity of ZrFe2O5 overwhelms the photo-activity in dye decolorization. The most efficient hybrid AOP is revealed to be sono-photo-Fenton, in which both photo- and Fenton- activities of ZrFe2O5 are utilized. Analysis of decolorization experiments has also provided interesting mechanistic insight into interactions and synergies between different competing mechanisms of hybrid AOPs.
1. Introduction
Wastewater discharge from process industries contains numerous recalcitrant organic pollutants, which are not degradable with conventional biological treatment of anaerobic digestion. Effective degradation of these pollutants requires advanced oxidation processes (AOPs), which are based on the production of oxidizing radicals.1–5 Among the various AOPs, photocatalysis has been studied extensively by several researchers to enhance the photocatalysis activity by modification of catalysts with transition metals (Fe-, Au-, Ag-, Mg-, Ni-, Au-)6,7,8–13 and rare-earth elements (Ce-, Er-, Yb-)14,15 as well as non-metallic elements (N- and F-)16,17 and 2D layered materials (such as graphene, MoS2 etc.).18 The more recent AOP of sonolysis has been used for degradation of wide variety of recalcitrant pollutants.6,7,19–21 In this process, the oxidizing radicals are produced through transient cavitation, which is growth and implosive collapse of tiny gas/vapor bubbles that create intense energy concentration on extremely small spatial and temporal scale.22 Sonolysis has also been applied in presence of catalyst possessing adsorption capacity and/or photo-activity and/or Fenton activity. The processes combining these techniques are called sonocatalysis, sono-photocatalysis and sono-photo-Fenton process, respectively.22–27 These hybrid AOPs have been reported to give enhanced degradation of the recalcitrant pollutants than individual sonolysis.
In this study, we have reported sonochemical synthesis and characterization of zirconium ferrite (ZrFe2O5). Synthesis of metal ferrites (e.g. Zn and Mn-ferrite) through sonochemical route has been reported by earlier authors.28–30 Some distinct merits of sonochemical route for ferrite synthesis are: one-pot synthesis, mild operating conditions, low energy requirement, and use of safe chemicals.31,32 This catalyst has been used with sonolysis for degradation/mineralization of recalcitrant pollutants such as textile dyes. ZrFe2O5 has been found to possess both photo activity and Fenton activity; and hence, we have also explored the additional contributions of an external UV-source and H2O2 addition on enhancement in degradation/mineralization of azo and non-azo textile dyes. The efficacy of ZrFe2O5 in degradation/mineralization of the textile dyes has been compared with conventional photocatalyst of TiO2. The results of experiments with sonication have been compared with experiments with mechanical agitation. Combination of these techniques gives the hybrid AOPs of sonocatalysis, photocatalysis, sono-photocatalysis and heterogeneous sono-Fenton and sono-photo-Fenton. Another facet of this study is investigation into the physical mechanism of these hybrid AOPs and identification of the relative roles of individual phenomena of adsorption, Fenton reaction, photocatalysis and physical/chemical effects of transient cavitation. Thus, this study not only reports synthesis of metal ferrite catalyst, which can be coupled with sonolysis for the hybrid AOPs mentioned earlier, but also gives a mechanistic insight into these hybrid AOPs. To the best of our knowledge, this paper is the first report on sonochemical synthesis of ZrFe2O5 with dual (photo- and Fenton-) activity, and its application for degradation of the textile dyes (azo and non-azo).
2. Experimental section
2.1 Materials
The following chemicals have been used for the present study: titanium(IV) isopropoxide (Alfa Aesar), zirconium oxychloride (Merck), glacial acetic acid (Merck) and ammonium solution (30%, Merck), hydrogen peroxide (30%, Merck), ethanol (Merck) and iron(II) acetate (Sigma-Aldrich), ethylenediaminetetraacetic acid (Merck), benzoquinone (Merck), isopropyl alcohol (Merck). The model dye of Methylene Blue (C16H18N3SCl) was purchased from Loba Chemie, while Acid Red B or Acid Red 14 (C20H12N2Na2O7S2) was procured from A.B. Chemicals and Instrument. Dye solutions in all experiments were prepared using ultrapure water (≥18 MΩ cm resistivity at 25 °C).
2.2 Synthesis of ZrFe2O5 and TiO2 particles
Protocol for sonochemical synthesis of Zr-ferrite (ZrFe2O5). In this protocol, an aqueous solution of 3.223 g (0.2 M) of zirconium oxychloride and 3.479 g (0.4 M) of iron(II) acetate was prepared in 50 mL of water. The molar ratio of zirconium chloride to iron acetate in this solution was 1
:
2. The pH of the solution was maintained at 6.5 using 30% ammonium solution. The reaction mixture was sonicated for 2 h with 5 s ON and 5 s OFF pulse mode. The temperature of the reaction mixture during sonication was maintained at 30 °C using an ice bath. 2 h of sonication of this mixture resulted in brown colored solid suspension. The solid phase in the suspension was separated by centrifugation at 5000 rpm for 30 min (Remi Equipment, model: R-8C). Solid particles were further dried in a hot air oven (Navyug, model: 101) at 100 °C for 12 h. The solid powder obtained after drying was ground and calcined at different temperatures in the range of 500° to 900 °C.
Protocol for sonochemical synthesis of TiO2. An ultrasound-assisted sol–gel method was used for synthesis of TiO2 particles. In this protocol, 2 mL of titanium (IV) isopropoxide was added to 30 mL of ethanol and 1 mL of acetic acid mixture. The mixture was then sonicated for 10 min using 20 kHz ultrasonic probe with 40% amplitude (Sonics, model: VCX500, 500 W), which corresponded to theoretical power input of 200 W. Actual power input to the system and the pressure amplitude of the ultrasound waves generated by the probe was determined as 1.5 bar using calorimetric technique.26 After 10 min sonication of the mixture, 30 mL of water was added to the reaction mixture followed by sonication for another 30 min, which resulted in gel formation. The gel was dried in a hot air oven (Navyug, model: 101) at 100 °C for 12 h. White powder obtained after drying was calcined at 300 °C and 500 °C to obtain TiO2 in anatase form.
2.3 Assessment of catalytic activity of ZrFe2O5 and TiO2 using dye decolorization
The catalytic activity of the synthesized TiO2 and ZrFe2O5 was assessed using protocols of sonocatalysis, photocatalysis, sono-photocatalysis and (heterogeneous) sono-Fenton. Decolorization/degradation of textile dyes was used as the model reaction. Two textile dyes, viz. Acid Red B (an azo dye, abbreviated hereafter as ARB), and Methylene Blue (non-azo dye, abbreviated hereafter as MB) were chosen as model recalcitrant organic pollutants. All experiments were carried out using 50 mL dye solutions with initial concentration of 20 ppm (corresponding molar concentration of 0.04 mM for ARB and 0.063 mM for MB). In each experiment, 25 mg of catalyst was added to the dye solution prior to experiment. All the experiments were conducted at neutral pH.
Adsorption of dye onto catalyst. Both catalysts, viz. TiO2 and ZrFe2O5 show tendency to adsorb dye molecules. The adsorbed dye molecules may be mistakenly counted as degraded molecules. In order to isolate this artifact, the adsorptive capacity of TiO2 and ZrFe2O5 for both model dyes was assessed prior to main experiments. The protocol followed was as follows: 25 mg of catalyst was added in 50 mL of dye solution with initial concentration of 20 ppm. The progress of adsorption study was evaluated by withdrawing 1 mL sample of the dye solution at regular time interval. The residual concentration of the dyes in these samples was determined using UV-visible spectrophotometer.
Decolorization experiments. Ultrasound-assisted experiments (viz. protocols of sonocatalysis, sono-Fenton, sono-photocatalysis and sono-photo-Fenton) were carried out using an ultrasound bath (Jeio Tech, Korea, model: UC-10), which operates at a frequency of 40 kHz and a theoretical power of 200 W. For the photo-assisted experiments (viz. protocols of sono-photocatalysis, sono-photo-Fenton and photocatalysis with mechanical stirring (MS)), two UV sources, viz. a UVA lamp (11 W, Phillips) having the light emission in the range of 300–400 nm with maximum peak emission at 365 nm and a UVC lamp (11 W, Phillips) having the light emission in the range of 200–300 nm with maximum peak emission at 254 nm, were used. The experiments were conducted with either a single UV source (UVA) or a combination of two UV sources (UVA + UVC). The UV source was placed above the reaction beaker at a distance of 14 cm from the surface of dye solution in the beaker (for greater details along with schematic of the experimental set up, we refer reader to our earlier paper26).In ultrasound-assisted experiments, the reaction beaker was placed exactly in the center of the bath. The UVA lamp was switched on for 15 min before the experiment so that the diffusion of UV light in the reaction solution is uniform. During the reaction, the temperature of the dye solution was maintained at 25 ± 1 °C. In ultrasound-assisted experiments, the temperature of the reaction mixture increases during sonication. This temperature rise was controlled by circulating cooling water in the bath using a temperature controlled bath (Amkette Analytics, model: WB2000). The decolorization reaction was monitored by withdrawing aliquots of dye solution at regular intervals. These aliquots were centrifuged at 5000 rpm (Remi Equipment, model: R-8C) to separate the solid catalyst particles and the residual dye concentration in these samples was analyzed at 512 nm (for ARB dye) and 663 nm (for MB dye) using UV-visible spectrophotometer (Perkin Elmer, model: Lambda 35). In addition, the removal of total organic carbon (TOC) in the dye solution with mineralization was analyzed using a TOC analyzer (O-I-Analytical, model: Aurora 1030).
In view of experimental results of adsorption experiments (described in the next section), ZrFe2O5 catalyst was added to the ARB dye solution just before the commencement of main treatment. For consistency, the same protocol was followed for the other dye of MB as well. On the basis of results of characterizations of catalysts, the decolorization experiments were devised in 7 different categories on the basis of the prevalent mechanism of decolorization. Each of these categories used either TiO2 or ZrFe2O5 as the catalyst. In view of the Fenton active α-Fe2O3 phase present in ZrFe2O5 (as described in greater detail in the next section), the experiments using ZrFe2O5 were also carried out with external addition of H2O2 (7.83 mM). Moreover, for experimental categories employing ultrasound, the saturation level of the liquid medium was also varied. In one category, liquid medium saturated with dissolved oxygen (9 ppm) was used, while in another category, the dissolved oxygen content of the medium was lowered to 2 ppm by application of vacuum and heating. With permutation–combination of different techniques, the following experimental protocols employing either individual AOP or hybrid AOP have been devised.
Individual AOPs. Sonolysis, photocatalysis (with either TiO2 or ZrFe2O5) and heterogeneous Fenton (with ZrFe2O5 + H2O2).
Hybrid AOPs. Sonocatalysis (with either TiO2 or ZrFe2O5), sono-photocatalysis (with either TiO2 or ZrFe2O5 and UV source), sono-Fenton (with ZrFe2O5 + H2O2) and sono-photo-Fenton (with ZrFe2O5 + H2O2 + UV source).
3. Characterization of ZrFe2O5 and TiO2 particles: results and discussion
3.1 Particle size distribution (PSD) analysis
The particles size distribution of ZrFe2O5 and TiO2 powder was performed using Delsa™ Nano C (Beckman Coulter, model: A53878) particle size analyzer. The result of particle size distribution is shown in Fig. 1. The particle distribution of synthesized catalysts was as follows:
 |
| Fig. 1 Particle size distribution of Zr-ferrite (ZrFe2O5) and TiO2 powders. | |
TiO2: D (10%): 308.60 nm, D (50%): 692.80 nm and D (90%): 1736.50 nm.
ZrFe2O5: D (10%): 159.60 nm, D (50%): 272.60 nm and D (90%): 560.40 nm.
3.2 X-Ray diffraction (XRD) analysis
The structural characteristics of the catalysts were determined using X-ray powder diffractometer (Bruker, model: D8 Advance) with monochromatic Cu-Kα (λ = 1.5406 Å) radiation. Fig. 2 and 3 show the XRD spectrum of the catalyst particles in the range 2θ = 10–80°. The strong peak in Fig. 2 at 2θ = 25.4° corresponds to the predominant (101) anatase phase of TiO2.24 The other peaks corresponding to lattice plane (004), (200), (105), (211), (204), (311), (112) and (103) also represented anatase phase of TiO2.13,33,34 As seen from Fig. 2, the presence of above peaks in the XRD spectrum of TiO2 prior to calcination is an evidence that titanium dioxide was formed during the sonochemical treatment. Sonochemically synthesized TiO2 has anatase phase, which remains unaltered even after calcination of the particles at a temperature of 500 °C.
 |
| Fig. 2 Powder X-ray diffraction results of TiO2 particles. | |
 |
| Fig. 3 Powder X-ray diffraction results of ZrFe2O5 particles calcined at different temperatures. | |
In case of ZrFe2O5, the solid particles obtained after sonochemical treatment did not show any peak corresponding spinel structure. This essentially means that synthesis of ZrFe2O5 is not complete after sonochemical treatment, and external calcination of the solid product is essential for formation of ferrite. As seen in Fig. 3A, calcination of solid product from sonochemical treatment did not yield ferrite till calcination temperature of 600 °C. Above this threshold temperature, peaks corresponding to the ferrite phase appeared in the XRD spectrum of calcined solids. The samples calcined at 700 °C showed peaks at (220), (311) and (440) along with α-Fe2O3 phase at (104) and tetragonal ZrO2 at (022). The diffractograms of samples calcined at 800 and 900 °C (shown in Fig. 3B) showed high intensity peaks at (111), (220), (311), (422), (440) and (533), which correspond to the spinel structure of ferrite particles.14,35 Some peaks at (012), (104), (113), (024) and (300) were also seen in Fig. 3B, which correspond to the hematite phase (α-Fe2O3).36,37 Solids calcined at 900 °C also showed the presence of monoclinic phase (corresponding to peak at (−111, 111)) and tetragonal phase (corresponding to peak at (022, 140)) of ZrO2.37,38 Reduction in the intensity of peak at (220) for solids calcined at 900 °C (as compared to 800 °C) could be attributed to agglomeration of particles (as observed in our previous study by Goswami et al.32). The increase in intensity of peak (104) for solids calcined at 900 °C could be attributed to the formation of α-Fe2O3 phase. It is noteworthy that this phase has Fenton activity, and this forms the basis of the experimental category with external H2O2 addition, as noted earlier.
3.3 FESEM and TEM analysis
The surface morphologies of the prepared ZrFe2O5 and TiO2 particles were performed using Field Emission Scanning Electron Microscopy (Carl Zeiss GmbH, model: SIGMA VP, Germany) and Transmission Electron Microscope (JEOL, model: JEM 2100, USA). Fig. 4 and 5 represent the FESEM and TEM images of as-synthesized TiO2 and ZrFe2O5 particles. It could be seen from these pictures that both ZrFe2O5 and TiO2 particles are isotropic in shape and uniform in terms of size distribution.
 |
| Fig. 4 FESEM images for surface morphology of (A) ZrFe2O5 and (B) TiO2 at 30k×. | |
 |
| Fig. 5 TEM images of sonochemically synthesized (A) ZrFe2O5 and (B) TiO2. | |
3.4 Diffuse reflectance spectra (DRS) analysis
Fig. 6 shows the diffuse reflectance spectra (DRS) of ZrFe2O5 and TiO2 powder. The band gap energies for both the catalysts have been determined by plotting [F(R)hv]0.5 against photon energy hv (eV); and extrapolating the linear portion of [F(R)hv]0.5 to 0 (zero). Here, F(R) is the Kubelka–Munk function, which is defined as:22,39 F(R) = (1 − R)2/2R, where R is the reflectance. The DRS results showed that sonochemically synthesized ZrFe2O5 has lower band gap energy than TiO2. With this analysis, the band gap energies for ZrFe2O5 and TiO2 have been estimated as 2.05 and 3.1 eV, respectively.
 |
| Fig. 6 (A) UV-visible diffuse reflectance spectra of ZrFe2O5 and TiO2, and (B) estimated band gap energy of ZrFe2O5 and TiO2. | |
3.5 BET surface area analysis
The surface area of ZrFe2O5 and TiO2 was analyzed using a fully automated BET surface area analyzer (Beckman Coulter, model: SA3100) by nitrogen multilayer adsorption measured as a function of relative pressure (Ps/P0) in the range of 0.05–0.2. The N2 adsorption–desorption isotherms and the corresponding pore size distribution curve (inset figure) for ZrFe2O5 and TiO2 are shown in Fig. 7. The pore size distribution and pore volume analysis were determined from desorption data using Barrett–Joyner–Halenda (BJH) method. As per this analysis, the predominant pore diameter for ZrFe2O5 was in the range of 8–11 nm (shown in inset of Fig. 7A) and 5–7 nm for TiO2 (shown in inset of Fig. 7B). This range of pore diameter indicates the mesoporous structure of the material.40–42 Also, the adsorption–desorption isotherms showed a large hysteresis loop of type VI characteristic that indicates the presence of mesoporosity due to the capillary condensation in the open mesoporous channels.43,44 The BET surface areas for ZrFe2O5 and TiO2 were 97.13 and 152.39 m2 g−1, respectively; while the pore volumes of ZrFe2O5 and TiO2 were 0.2808 and 0.3465 cm3 g−1, respectively.
 |
| Fig. 7 Results of BET surface area analysis. N2 adsorption–desorption isotherms of catalysts and the corresponding BJH pore size distribution curves (inset). (A) ZrFe2O5 and (B) TiO2. | |
3.6 Thermogravimetric analysis (TGA)
In order to determine the thermal characteristics of ZrFe2O5 and TiO2, TG/DTG analysis was performed using thermo-gravimetric analyzer (TG 209 F1 Libra, NETZSCH) under N2 environment with a flow rate of 40 mL min−1. The analyses were conducted using heating rates of 10 °C min−1 and the temperature range from 30 °C to 900 °C. The thermo-gravimetric analysis results of ZrFe2O5 calcined at 800 °C and TiO2 calcined at 500 °C are shown in Fig. 8. The TGA results showed two stages of weight loss. The major weight loss of 2.20% and 0.41% for TiO2 and ZrFe2O5, respectively, was observed from room temperature to 150 °C, which corresponds to dehydration of physically adsorbed water. The second and minor weight loss of 1.8% and 0.04% for TiO2 and ZrFe2O5, respectively, was observed in the range of 150–900 °C. This could be attributed to the decomposition of residual contaminants from the reaction mixture present in the solid products after synthesis.
 |
| Fig. 8 Thermo-gravimetric analysis (TGA) results of (A) ZrFe2O5 and (B) TiO2. | |
4. Dye decolorization: results and discussion
Before presenting the results of this study and related discussion, we give a brief preamble about the chemical mechanism of the degradation of ARB and MB dyes, which has been well documented in published literature. Gao et al.45 and Xia et al.46 have postulated detail of the degradation pathways of ARB dye with identification of several intermediates during photocatalytic degradation. The degradation of ARB dye is initiated by attacking of ˙OH radicals produced through photocatalysis process. The main decolorization reactions occur during treatment are the breakage of the chromophoric azo (–N
N–) bonds, hydroxylation and oxidation. Some of the intermediates of ARB dye degradation that have been reported by Gao et al.45 and Xia et al.46 are 1,4-dihydroxynaphthalene, 1,2- and 1,4-naphthoquinone, 1-naphthol, 2-hydroxybenzoic acid, 1,2-benzene dicarboxylic acid, benzoic acid, carboxylic acids (maleic acid, oxalic acid, lactic acid, acetic acid and formic acid), ketones and aldehydes. Yu and Chuang;47 Houas et al.48 and Wang et al.49 have studied the degradation of MB dye and have reported that the main chemical mechanism of degradation is due to hydroxylation/oxidation induced by ˙OH and HO2˙ radicals formed by AOPs. The main degradation products of MB dye are C14H13N2OS, C13H11N2OS, C12H8NO2S, and C12H9N2OS.
4.1 Dye adsorption
The results of dye adsorption on ZrFe2O5 and TiO2 catalyst particles are given in Fig. 9. As stated earlier, the BET surface area analysis revealed much higher surface area for TiO2 than ZrFe2O5. The adsorption of MB dye on both catalysts was ∼5.5%, while the adsorption percentage of ARB dye was 6.6 and 19.4% on TiO2 and ZrFe2O5, respectively. An explanation for higher adsorption of ARB on ZrFe2O5 could be given in terms of presence of α-Fe2O3 phase on as-synthesized ZrFe2O5. This phase helps to produce cationic sites around the particles of ZrFe2O5 after addition to water. ARB being an acidic dye, it always has the tendency for ionic bonding with the cationic sites of the particles. The attraction of anionic dye molecule to a cationic site on the ZrFe2O5 essentially results in higher extent of adsorption of ARB. In view of large adsorption of ARB dye, ZrFe2O5 particles were added to dye solution just before the treatment so as to reduce the artifacts due to dye adsorption.
 |
| Fig. 9 Adsorption study of ARB and MB dyes onto ZrFe2O5 and TiO2 powders. | |
4.2 Decolorization experiments
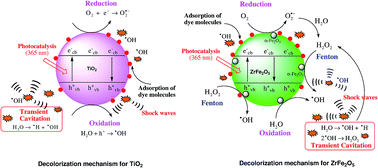
The summary of the experimental results of dye decolorization is given in Table 1 (for the ARB dye) and Table 2 (for the MB dye). The time trends of dye decolorization in different experimental categories employing either individual or hybrid AOP are shown in Fig. 10 and 11 for ARB and MB dye, respectively. The TOC removal in experiments employing with both ARB and MB dye is shown in Fig. 12 (individual as well as hybrid AOPs). Tables 1 and 2 also depict the pseudo 1st order kinetic constant fitted to the decolorization data. It should be noted, however, that the decolorization is non-uniform in time. Hence, the kinetic constant has been determined on the basis of decolorization obtained in first 30 min of treatment (although the total treatment time was 60 min), during which almost of the total decolorization was obtained. The degradation of the dye with the two catalysts can have different mechanisms on the basis of the properties of the catalysts. For TiO2, the possible mechanisms could be adsorption and photocatalysis. For ZrFe2O5, the possible mechanisms are adsorption, photocatalysis and Fenton reactions due to the presence of α-Fe2O3 phase. The net decolorization obtained in any protocol is a manifestation of the above mechanisms that can occur simultaneously as shown in Scheme 1. Some peculiar trends of decolorization could be identified from Tables 1 and 2 and Fig. 10 and 11. Given below are these trends along with discussion of possible underlying mechanism.
Table 1 Summary of experimental results on decolorization/degradation of Acid Red B (ARB)a
Experimental category |
Decolorization of ARB (η%) |
Note: US – ultrasound assisted, MS – assisted with mechanical stirring, η – decolorization efficiency (%), k – pseudo 1st order kinetic constant (s−1) calculated on the basis of initial 30 min of decolorization reaction data. |
1. Sonolysis (US) |
13.74 ± 2.23 |
k = 3.94 × 10⁻⁵ |
|
TiO2 |
ZrFe2O5 |
(ZrFe2O5 + H2O2) |
60 min |
k (s−1) |
60 min |
k (s−1) |
60 min |
k (s−1) |
2. Fenton (MS) |
— |
— |
— |
— |
60.19 ± 4.16 |
3.12 × 10⁻⁴ |
3. Photocatalysis (MS + UVA) |
55.38 ± 2.47 |
2.28 × 10⁻⁴ |
32.80 ± 1.91 |
1.58 × 10⁻⁴ |
— |
— |
4. US + Sat. |
34.83 ± 0.99 |
1.34 × 10⁻⁴ |
51.86 ± 1.35 |
2.28 × 10⁻⁴ |
67.57 ± 0.48 |
6.14 × 10⁻⁴ |
5. US + Unsat. |
37.52 ± 1.23 |
1.59 × 10⁻⁴ |
46.53 ± 1.66 |
1.56 × 10⁻⁴ |
70.46 ± 0.67 |
4.25 × 10⁻⁴ |
6. US + UVA + Sat. |
80.58 ± 0.69 |
4.80 × 10⁻⁴ |
59.10 ± 1.70 |
3.36 × 10⁻⁴ |
90.54 ± 2.28 |
1.40 × 10⁻³ |
7. US + UVA + Unsat. |
78.15 ± 0.94 |
4.01 × 10⁻⁴ |
53.73 ± 1.68 |
2.27 × 10⁻⁴ |
82.07 ± 0.59 |
5.46 × 10⁻⁴ |
Table 2 Summary of experimental results on decolorization/degradation of Methylene Blue (MB)a
Experimental category |
Decolorization of MB (η%) |
Note: US – ultrasound assisted, MS – assisted with mechanical stirring, η – decolorization efficiency (%), k – pseudo 1st order kinetic constant (s−1) calculated on the basis of initial 30 min of decolorization reaction data. |
1. Sonolysis (US) |
8.35 ± 1.24 |
k = 2.39 × 10⁻⁵ |
|
TiO2 |
ZrFe2O5 |
(ZrFe2O5 + H2O2) |
60 min |
k (s−1) |
60 min |
k (s−1) |
60 min |
k (s−1) |
2. Fenton (MS) |
— |
— |
— |
— |
40.76 ± 2.01 |
4.73 × 10⁻⁴ |
3. Photocatalysis (MS + UVA) |
34.07 ± 3.44 |
1.98 × 10⁻⁴ |
31.30 ± 3.61 |
2.77 × 10⁻⁴ |
— |
— |
4. US + Sat. |
32.12 ± 2.83 |
2.16 × 10⁻⁴ |
50.34 ± 1.35 |
4.65 × 10⁻⁴ |
53.19 ± 1.51 |
5.35 × 10⁻⁴ |
5. US + Unsat. |
32.49 ± 2.82 |
1.16 × 10⁻⁴ |
51.11 ± 1.16 |
4.68 × 10⁻⁴ |
51.69 ± 2.95 |
7.18 × 10⁻⁴ |
6. US + UVA + Sat. |
60.96 ± 2.14 |
2.31 × 10⁻⁴ |
57.78 ± 1.08 |
6.03 × 10⁻⁴ |
87.62 ± 1.21 |
6.75 × 10⁻⁴ |
7. US + UVA + Unsat. |
49.45 ± 2.79 |
1.85 × 10⁻⁴ |
49.30 ± 1.50 |
6.02 × 10⁻⁴ |
62.17 ± 2.52 |
5.88 × 10⁻⁴ |
 |
| Fig. 10 Time history of decolorization of ARB with various operating conditions: (A) individual AOPs, (B) hybrid AOPs (sonocatalysis and sono-Fenton), and (C) hybrid AOPs (sono-photocatalysis and sono-photo-Fenton process). Note: US – ultrasound, MS – mechanical stirring, ZrF – zirconium ferrite. | |
 |
| Fig. 11 Time history of decolorization of MB with various operating conditions: (A) individual AOPs, (B) hybrid AOP (sonocatalysis and sono-Fenton), and (C) hybrid AOPs (sono-photocatalysis and sono-photo-Fenton process). Note: US – ultrasound, MS – mechanical stirring, ZrF – zirconium ferrite. | |
 |
| Fig. 12 Total organic carbon (TOC) removal after 60 min of treatment of ARB and MB dyes with various operating conditions: (A) individual AOPs, (B) hybrid AOPs (sonocatalysis and sono-Fenton), and (C) hybrid AOPs (sono-photocatalysis and sono-photo-Fenton process). Note: US – ultrasound, MS – mechanical stirring, ZrF – zirconium ferrite. | |
 |
| Scheme 1 Schematic depicting the decolorization/degradation mechanisms with TiO2 and ZrFe2O5 catalysts. | |
(1) Least decolorization for both dyes is seen for the AOP of sonolysis. In this case, the dye decolorization occurs through the ˙OH radicals generated by cavitation bubbles. Due to rather low concentration of the dye solution, the probability of interaction between dye molecules and radicals is low, which is essentially reflected in lower decolorization. Comparing among the two dyes, sonolysis yields higher decolorization for the azo ARB dye. We attribute this result to the chemical structure of the ARB dye, in which the azo group (–N
N– linking the azo dye), which is susceptible to ˙OH radicals attack.
(2) ZrFe2O5 under Fenton treatment yields much higher decolorization for the ARB dye than MB dye. This result is a consequence of greater adsorption of the ARB dye on ZrFe2O5. Radicals generated through Fenton reaction of α-Fe2O3 phase in ferrite have high probability of interaction with the adsorbed dye molecules. Being extremely unstable, these radicals do not diffuse into the medium. Hence, the extent of adsorption of dye onto the catalyst surface is also a crucial mechanism in overall decolorization. Consequently, higher decolorization was seen for the ARB dye that has higher extent of adsorption.
(3) Under the individual AOP of photocatalysis, TiO2 yields higher decolorization for both dyes than ZrFe2O5. This is an anomaly as the band gap for ZrFe2O5 is much lower than TiO2, as revealed in the DRS analysis, and hence, the photoactivity of ZrFe2O5 is expected to be higher. We explain this anomaly as follows on the basis of a similar study by Xia and Yin on photocatalytic activity of core–shell structured α-Fe2O3/TiO2 nanocomposites:50 Under the UV light irradiation, electron–hole pairs are produced in the conduction and valence bands of ZrFe2O5 and as a result, a heterojunction is formed between ZrFe2O5 and α-Fe2O3. The α-Fe2O3 present in the ZrFe2O5 powders could act as a recombination center of the photogenerated electrons and holes. Also, α-Fe2O3 present in ZrFe2O5 may absorb most of the electromagnetic irradiation and promote favorable conditions for the presence of hole–electron recombination centers, so that ZrFe2O5 catalyst exhibits lower photocatalytic activity even after having the lower band gap energy than the TiO2.
The temperature of calcination determines the concentration of α-Fe2O3 phase. The concentration of α-Fe2O3 phase in ZrFe2O5 grows with temperature of calcination. Therefore, additional decolorization experiments were performed using ZrFe2O5 particles calcined at lower temperature of 650 °C, with techniques of photocatalysis (MS + UVA) and Fenton process (MS + Fe2+ + H2O2). These results were compared with decolorization obtained with ZrFe2O5 calcined at 900 °C. The photo-activity of the two catalysts was revealed to be almost equal. However, the Fenton activity of ZrFe2O5 calcined at 650 °C was significantly lower. The details of these experiments are given in ESI† provided with the manuscript.
It should be noted that photo-chemically generated radicals are utilized mainly for the decolorization of adsorbed dye molecules. Thus, the extent of dye adsorption on catalyst surface also contributes to overall mechanism of decolorization. Although ZrFe2O5 is a stronger adsorbent than TiO2, the net decolorization with ZrFe2O5 is lower as a consequence of its inferior photocatalytic activity.
(4) The saturation level of the medium has no effect on dye decolorization for both dyes under the protocol of sonocatalysis, as almost similar decolorization has been obtained for both dyes, with saturated as well as unsaturated medium.
(5) Under the protocol of sonocatalysis (in which the catalyst is added to the dye solution but no external UV source is provided), an interesting manifestation of Fenton active α-Fe2O3 phase of ZrFe2O5 is seen. In this case, the role of catalyst is merely that of an adsorbent that creates higher local concentration of dye on its surface. Although the adsorption of MB dye on both TiO2 & ZrFe2O5 is similar, higher decolorization is seen for ZrFe2O5. We attribute this result to Fenton-reactions occurring in the solution due to the H2O2 generated in situ by the recombination of ˙OH radicals generated from transient cavitation. A similar trend is also seen for the ARB dye, however, contribution of higher adsorption of the ARB dye to higher extent of decolorization cannot be ruled out. Addition of external H2O2 to the medium further enhances the Fenton reactions and extent of dye decolorization. We would like to point out that there are many possible routes through which H2O2 can degrade the dyes. One mechanism is evaporation of H2O2 in cavitation bubbles and decomposition of this H2O2 to produce higher ˙OH radicals during transient collapse of bubbles, which can degrade the dye. Alternately, H2O2 itself is an oxidant which can degrade the dyes. However, results of our previous study have clearly distinguished the relative contributions of these mechanisms in comparison to the Fenton-mechanism.51 Our previous results confirm that contribution of first two mechanisms is relatively trivial and the oxidation of the textile dye in presence of H2O2 is predominantly affected through the Fenton mechanism. Therefore, rise in extent of decolorization of dyes with addition of H2O2 is attributed to Fenton type reactions induced by the α-Fe2O3 (or hematite phase) of the ferrite catalyst.
The contribution of adsorption in overall decolorization is more pronounced in this protocol. Significantly higher decolorization with external addition of H2O2 is seen for the ARB dye than MB dye. Due to higher adsorption, the probability of interaction of the ARB dye molecules with the ˙OH radicals generated through heterogeneous Fenton reaction is higher, which essentially results in greater decolorization.
(6) Under the protocol of sono-photocatalysis, where an external UV source is employed, marked enhancement in decolorization is seen. TiO2 yields high decolorization (∼80%) for ARB, while relatively lesser decolorization is seen for MB. The decolorization for the ZrFe2O5 catalyst is relatively lesser as a result of reduced photoactivity due to presence of α-Fe2O3 phase. However, with addition of H2O2 initiates the Fenton activity of the α-Fe2O3 phase of the catalyst to give the hybrid AOP of sono-photo-Fenton, and the extent of decolorization shows marked rise.
In the protocols of sono-photocatalysis and sono-photo-Fenton, the negative effect of unsaturation of the medium is evident. For both dyes, the decolorization reduces by ∼10–15% with unsaturation. We attribute this result to intensification of the transient cavitation with unsaturation of the medium.52 As a result, the intensity of the shock waves generated by bubbles also increases these shock waves are responsible for desorption of the dye molecules from the surface of ZrFe2O5.22 This phenomenon reduces the probability of interaction of dye molecules with ˙OH radicals generated either through heterogeneous Fenton reaction between H2O2 and α-Fe2O3 phase of ZrFe2O5 or through the photocatalysis.
The reduction in total organic carbon (TOC) of the reaction solution with individual as well as hybrid AOPs employed in this study is depicted in Fig. 12. The typical trends in TOC removal are essentially same as that for the decolorization. Among the individual AOPs, highest TOC removal is seen for sono-Fenton (US + ZrFe2O5 + H2O2), while among the hybrid AOPs, highest TOC removal is seen for sono-photo-Fenton with ZrFe2O5. If we compare the performance of two catalysts for TOC removal in individual and hybrid AOPs, we find that TiO2 gives better performance in AOPs where external UV source was used (sono-photocatalysis). ZrFe2O5, on the other hand, gives better performance in protocols where H2O2 was added to the medium (viz. sono-Fenton or sono-photo-Fenton). The former result is a consequence of higher photo-activity of TiO2 (which overwhelms the moderate adsorption capacity), while the latter result is a consequence of utilization both photo as well as Fenton activity of the ZrFe2O5 catalyst.
4.3 Effect of UV source for mineralization
Wu et al.53 and Le et al.54 have given a general mechanism of the photo-degradation and mineralization of textile dyes. As per hypothesis of Wu et al.53 and Le et al.,54 the dye molecule is excited in presence of UV light irradiation and injects/transfers an electron to the conduction band of the photocatalyst and get converted itself to a cationic dye radical. This radical has different fates in presence of a photocatalyst or Fenton reagent (Fe3+). In presence of photocatalyst (either ZrFe2O5 or TiO2), the dye radical can generate cation radical species Dye˙+ and an electron in the conduction band.54 The electron can combine with dissolved oxygen to generate superoxide anion radical (O2˙−), while the Dye˙+ species can react with OH− ions to generate ˙OH radicals. Both ˙OH and O2˙− species can cause degradation of the dye molecules leading to their mineralization. In presence of Fenton reagent, the dye cation radical species can react with Fe3+ to generate Fe2+,53 which further reacts with H2O2 through Fenton reactions to generate ˙OH radical species, which can degrade the dye molecules into numerous intermediate species, finally leading to mineralization. In the context of present study, the former mechanism applies for the hybrid AOP sono-photocatalysis, while the latter mechanism applies for sono-photo-Fenton process.
In order to assess the effect of UV light sources, we have conducted experiments under with either UVA or combined with UVA + UVC light. Fig. 13 shows the result of this study. Comparison of the decolorization results with single UV source of UVA and combined source UVA + UVC revealed that extent of dye decolorization does not change appreciably with application of UVC source in addition of UVA. However, the extent of TOC removal shows marked enhancement with simultaneous application of UVC with UVA (∼40% enhancement for ARB dye and ∼65% enhancement for MB dye). This essentially means that UVC photo emission (with peak emission at 254 nm which assists photolysis of H2O2 to generate ˙OH radicals) mainly contributes to further degradation of the intermediates/byproducts of dye degradation, which results in higher mineralization of the organic carbon.
 |
| Fig. 13 (A) Time history of decolorization under hybrid AOP (sono-photo-Fenton reaction) assisted with different UV light sources. (B) Effect of UV irradiation sources for TOC removal with hybrid AOP (sono-photo-Fenton reaction). | |
4.4 Distinguishing among contributions of oxidizing species
The degradation of textile dye is effected by three oxidizing species, viz. h+ (hole), O2˙− (superoxide radical) and ˙OH (hydroxyl radical). These species are generated through different mechanisms in either individual or hybrid AOPs as discussed in previous sections.
In order to determine the individual contributions of these oxidizing species to degradation of dyes, experiments were conducted with radical scavengers. The experiments were performed in presence of 2 mM ethylenediaminetetraacetic acid (EDTA), 2 mM benzoquinone (BQ), and 5 mM isopropyl alcohol (i-PrOH) that act as the scavengers for h+, O2˙− and ˙OH, respectively. The results of decolorization/degradation of ARB and MB dyes in photo-catalysis process with different scavengers are shown in Fig. 14. The decolorization profiles with addition of scavengers have been compared against the decolorization profile for either (ZrFe2O5 + UVA) or (TiO2 + UVA) with mechanical agitation. The experimental results for both dyes showed that the addition of EDTA in the reaction solution in presence of ZrFe2O5 or TiO2 significantly lowers degradation efficiency of ARB (32.7% with ZrFe2O5 and 25% with TiO2) and MB (32.5% with ZrFe2O5 and ∼34.5% with TiO2). Addition of BQ and i-PrOH in the reaction mixture results in moderate reduction in degradation efficiency as follows: (1) MB + i-PrOH: 17.2% and 25.6% reduction, for ZrFe2O5 and TiO2 respectively; (2) ARB + i-PrOH: 6% and 15.9% reduction, for ZrFe2O5 and TiO2 respectively; (3) MB + BQ: 27.3% and 7.7% reduction, for ZrFe2O5 and TiO2 respectively; and (4) ARB + i-PrOH: 17.2% and 25.6% reduction, for ZrFe2O5 and TiO2 respectively. These numbers clearly indicate that the reduction in degradation with addition of either BQ or i-PrOH is not as marked as that for EDTA addition. Recently, Xiang et al.41 have studied the photo-catalysis process with Ag3PO4 for degradation of MB and reported that MB degradation is greatly affected in presence of EDTA as hole (h+) scavenger, which is the consequence of the present study of decolorization. In another study by Su et al.,42 it has been reported that hole (h+) does not play any important role in degradation pathway of Acid Orange-II dye, and the degradation occurs mainly through ˙OH radicals generated from photo-catalysis process on the surface of mesoporous Zn-ferrite (ZnFe2O4) nanoparticles. Moreover, Xiang et al.41 have not observed any effect of ˙OH radical in degradation of MB with graphene-modified Ag3PO4. This result is in contradiction to the results by Su et al.42 This essentially indicates that the predominant degradation pathway of dye is specific to the reaction conditions, and no general conclusions could be drawn. However, in the context of present study, the experimental results reported in Fig. 14 reveal that all oxidizing species, viz. h+, ˙OH and O2˙− contribute to degradation of ARB and MB dyes. On a relative basis, the significant contribution to oxidation is by h+ and O2˙− species.
 |
| Fig. 14 Photocatalytic activity of ZrFe2O5 and TiO2 in presence of different scavengers. (A) ARB dye and (B) MB dye. | |
4.5 Synergy effect
As noted earlier, for any particular protocol, several mechanisms occur simultaneously which contribute to the overall decolorization. The positive/negative synergies between these mechanisms result in enhanced/reduced decolorization in any hybrid AOP. Fig. 15 depicts the synergies in the hybrid AOPs. In this section, we have attempted to determine the synergy between these mechanisms. The synergy effect in hybrid advanced oxidation processes (HAOPs) has been calculated with following formula:
 |
| Fig. 15 Synergism of hybrid AOPs: (A) synergistic effect for decolorization of ARB (azo dye), and (B) synergistic effect for decolorization of MB (non-azo dye). Note: while calculation of the synergies, the extent of adsorption of the dye onto the photocatalyst (after total reaction time of the advanced oxidation treatment) has been accounted. | |
The highest synergies are seen for both catalysts and both dyes in the hybrid AOP of sonocatalysis. As noted earlier, in sonocatalysis protocols, the catalyst mainly acts as an adsorbent that creates high localized concentration of dye molecules, which essentially increases the probability of interaction between dye molecules and oxidizing radicals generated through transient cavitation bubbles. Small negative synergies are seen for ZrFe2O5 catalyst in protocol of sono-photocatalysis and sono-photo-Fenton. In both of these protocols, the oxidizing radicals generated at the surface of catalyst either photo-chemically or through heterogeneous Fenton reaction (of α-Fe2O3 phase) interaction with dye molecules adsorbed on the catalyst surface. The acoustic waves generated by transient cavitation cause desorption of the dye molecules which hampers their interaction probability with radicals. This phenomenon renders negative synergy between individual mechanism of sonolysis, photocatalysis and Fenton reactions.
5. Conclusions
In this paper, we have reported sonochemical synthesis and characterization of zirconium ferrite (ZrFe2O5), which has potential application as catalyst in AOPs. The efficacy of ZrFe2O5 in degradation of the recalcitrant organic pollutants has been assessed with decolorization/degradation of azo and non-azo textile dyes as yardstick using various individual and hybrid AOPs. The results have been compared against the conventional photocatalyst of TiO2. The characterization of ZrFe2O5 reveals that it has lower band gap energy than TiO2. However, it also possesses α-Fe2O3 (hematite) phase. This phase has adverse effect on the photo-activity of the ZrFe2O5 due to which the effective photo-activity of ZrFe2O5 reduces despite the lower band gap energy. However, in the context of degradation of recalcitrant pollutants, this adverse effect is compensated by the Fenton activity of α-Fe2O3 (hematite) phase. Moreover, sonochemically synthesized ZrFe2O5 also has high adsorption capacity that promotes the Fenton- and photo-activity. As a result of these facets, ZrFe2O5 is revealed to be a better catalyst for hybrid AOPs than TiO2. Experimental results of dye decolorization have revealed that Fenton-activity of ZrFe2O5 has higher contribution to decolorization than photo-activity. The most efficient protocol for dye decolorization is revealed to be sono-photo-Fenton, in which both photo- and Fenton- activities of ZrFe2O5 are utilized. The analysis of decolorization experiments has also provided interesting mechanistic insight into interactions between different competing mechanisms of hybrid AOPs, which could be useful for further research in hybrid advanced oxidation processes.
Acknowledgements
Authors acknowledge the analytical facilities provided by Central Instruments Facility (CIF), I.I.T. Guwahati. The use of XRD facility (procured through FIST grant no. SR/FST/ETII-028/2010 from Department of Science and Technology, Government of India) at Department of Chemical Engineering, I.I.T. Guwahati is also acknowledged.
References
- Y. Adewuyi, Ind. Eng. Chem. Res., 2001, 40, 4681–4715 CrossRef CAS.
- Y. Adewuyi, Environ. Sci. Technol., 2005, 39, 3409–3420 CrossRef CAS.
- Y. Adewuyi, Environ. Sci. Technol., 2005, 39, 8557–8570 CrossRef CAS.
- P. R. Gogate and A. B. Pandit, Adv. Environ. Res., 2004, 8, 501–551 CrossRef CAS.
- P. R. Gogate and A. B. Pandit, Adv. Environ. Res., 2004, 8, 553–597 CrossRef CAS.
- Y. L. Pang and A. Z. Abdullah, J. Hazard. Mater., 2012, 235–236, 326–335 CrossRef CAS PubMed.
- Y. L. Pang and A. Z. Abdullah, Appl. Catal., B, 2013, 129, 473–481 CrossRef CAS PubMed.
- M. Guo, J. Zhao, X. Xu, W. Yu and X. Wang, Mater. Lett., 2013, 111, 93–96 CrossRef CAS PubMed.
- H. Yamashita, M. Harada, J. Misaka, M. Takeuchi, B. Neppolian and M. Anpo, Catal. Today, 2003, 84, 191–196 CrossRef CAS.
- C. M. Ng, P.-C. Chen and M. Sivakumar, Appl. Catal., A, 2012, 433–434, 75–80 CrossRef CAS PubMed.
- V. Etacheri, R. Roshan and V. Kumar, ACS Appl. Mater. Interfaces, 2012, 4, 2717–2725 CAS.
- Z. Yao, F. Jia, S. Tian, C. X. Li, Z. Jiang and X. Bai, ACS Appl. Mater. Interfaces, 2010, 2, 2617–2622 CAS.
- P. S. Satishkumar, R. Sivakumar, S. Anandan, J. Madhavan, P. Maruthamuthu and M. Ashokkumar, Water Res., 2008, 42, 4878–4884 CrossRef PubMed.
- S. R. Shirsath, D. V. Pinjari, P. R. Gogate, S. H. Sonawane and A. B. Pandit, Ultrason. Sonochem., 2013, 20, 277–286 CrossRef CAS PubMed.
- J. Reszczyńska, T. Grzyb, J. W. Sobczak, W. Lisowski, M. Gazda, B. Ohtani and A. Zaleska, Appl. Catal., B, 2015, 163, 40–49 CrossRef PubMed.
- H. Qin, W. Li, Y. Xia and T. He, ACS Appl. Mater. Interfaces, 2011, 3, 3152–3156 CAS.
- L.-P. Zhu, L.-L. Wang, N.-C. Bing, C. Huang, L.-J. Wang and G.-H. Liao, ACS Appl. Mater. Interfaces, 2013, 5, 12478–12487 CAS.
- D. Lang, T. Shen and Q. Xiang, ChemCatChem, 2015, 7, 943–951 CrossRef CAS PubMed.
- R. Vinu and G. Madras, Environ. Sci. Technol., 2009, 43, 473–479 CrossRef CAS.
- M. Ahmad, E. Ahmed, Z. L. Hong, W. Ahmed, A. Elhissi and N. R. Khalid, Ultrason. Sonochem., 2014, 21, 761–773 CrossRef CAS PubMed.
- Y. L. Min, K. Zhang, Y. C. Chen and Y. G. Zhang, Ultrason. Sonochem., 2012, 19, 883–889 CrossRef CAS PubMed.
- S. Chakma and V. S. Moholkar, Ultrason. Sonochem., 2015, 22, 287–299 CrossRef CAS PubMed.
- M. V. Bagal and P. R. Gogate, Ultrason. Sonochem., 2014, 21, 1035–1043 CrossRef CAS PubMed.
- P. S. Sathishkumar, R. V. Mangalaraja, H. D. Mansilla, M. A. Gracia-Pinilla and S. Anandan, Appl. Catal., B, 2014, 160–161, 692–700 CrossRef CAS PubMed.
- Y. Segura, F. Martínez, J. A. Melero, R. Molina, R. Chand and D. H. Bremner, Appl. Catal., B, 2012, 113–114, 100–106 CrossRef CAS PubMed.
- S. Chakma and V. S. Moholkar, Ind. Eng. Chem. Res., 2014, 53, 6855–6865 CrossRef CAS.
- J. B. Bhasarkar, S. Chakma and V. S. Moholkar, Ind. Eng. Chem. Res., 2013, 52, 9038–9047 CrossRef CAS.
- M. Sivakumar, A. Towata, K. Yasui, T. Tuziuti and Y. Iida, Curr. Appl. Phys., 2006, 6, 591–593 CrossRef PubMed.
- M. Sivakumar, A. Towata, K. Yasui, T. Tuziuti, T. Kozuka, Y. Iida, M. M. Maiorov, E. Blums, D. Bhattacharya, N. Sivakumar and M. Ashok, Ultrason. Sonochem., 2012, 19, 652–658 CrossRef CAS PubMed.
- B. R. Reddy, T. Sivasankar, M. Sivakumar and V. S. Moholkar, Ultrason. Sonochem., 2010, 17, 416–426 CrossRef CAS PubMed.
- H. A. Choudhury, A. Choudhary, M. Sivakumar and V. S. Moholkar, Ultrason. Sonochem., 2013, 20, 294–302 CrossRef CAS PubMed.
- P. P. Goswami, H. A. Choudhury, S. Chakma and V. S. Moholkar, Ind. Eng. Chem. Res., 2013, 52, 17848–17855 CrossRef CAS.
- M. Toyoda, Y. Nanbu, Y. Nakazawa, M. Hirano and M. Inagaki, Appl. Catal., B, 2004, 49, 227–232 CrossRef CAS PubMed.
- D. He and F. Lin, Mater. Lett., 2007, 61, 3385–3387 CrossRef CAS PubMed.
- A. A. Sattar, H. M. El-Sayed, W. R. Agami and A. A. Ghani, Am. J. Appl. Sci., 2007, 4, 89–93 CrossRef CAS.
- F. B. Li, X. Z. Li, C. S. Liu and T. X. Liu, J. Hazard. Mater., 2007, 149, 199–207 CrossRef CAS PubMed.
- C. Lin, C. Zhang and J. Lin, J. Phys. Chem. C, 2007, 111, 3300–3307 CAS.
- J. R. De la Rosa, A. Hernandez, F. Rojas and J. J. Ledezma, Colloids Surf., A, 2008, 315, 147–155 CrossRef CAS PubMed.
- C. Aydın, M. S. A. El-sadek, K. Zheng, I. S. Yahia and F. Yakuphanoglu, Opt. Laser Technol., 2013, 48, 447–452 CrossRef PubMed.
- K. S. W. Sing, D. H. Everett, R. A. W. Haul, L. Moscou, R. A. Pierotti, J. Rouquerol and T. Siemieniewska, Pure Appl. Chem., 1985, 57, 603–619 CrossRef CAS.
- Q. Xiang, D. Lang, T. Shen and F. Liu, Appl. Catal., B, 2015, 162, 196–203 CrossRef CAS PubMed.
- M. Su, C. He, V. K. Sharma, M. A. Asi, D. Xia, X.-Z. Li, H. Deng and Y. Xiong, J. Hazard. Mater., 2012, 211–212, 95–103 CrossRef CAS PubMed.
- E.-Y. Kim, D. S. Kim and B.-T. Ahn, Bull. Korean Chem. Soc., 2009, 30, 193–196 CrossRef CAS.
- J. Y. Cho, W. H. Nam, Y. S. Lim, W.-S. Seo, H.-H. Park and J. Y. Lee, RSC Adv., 2012, 2, 2449–2453 RSC.
- M. Gao, Z. Zeng, B. Sun, H. Zou, J. Chen and L. Shao, Chemosphere, 2012, 89, 190–197 CrossRef CAS PubMed.
- S.-J. Xia, X.-B. Zhou, W. Shi, G.-X. Pan and Z.-M. Ni, J. Mol. Catal. A: Chem., 2014, 392, 270–277 CrossRef CAS PubMed.
- Z. Yu and S. S. C. Chuang, Appl. Catal., B, 2008, 83, 277–285 CrossRef CAS PubMed.
- A. Houas, H. Lachheb, M. Ksibi, E. Elaloui, C. Guillard and J.-M. Herrmann, Appl. Catal., B, 2001, 31, 145–157 CrossRef CAS.
- X. Wang, L. Mei, X. Xing, L. Liao, G. Lv, Z. Li and L. Wu, Appl. Catal., B, 2014, 160–161, 211–216 CrossRef CAS PubMed.
- Y. Xia and L. Yin, Phys. Chem. Chem. Phys., 2013, 15, 18627–18634 RSC.
- S. Chakma and V. S. Moholkar, AIChE J., 2013, 59, 4303–4313 CrossRef CAS PubMed.
- V. S. Moholkar and M. Warmoeskerken, Chem. Eng. Sci., 2004, 59, 299–311 CrossRef CAS PubMed.
- K. Q. Wu, Y. D. Xie, J. C. Zhao and H. S. Hidaka, J. Mol. Catal. A: Chem., 1999, 144, 77–84 CrossRef CAS.
- H. A. Le, L. T. Linh, S. Chin and J. Jurng, Powder Technol., 2012, 225, 167–175 CrossRef CAS PubMed.
Footnote |
† Electronic supplementary information (ESI) available: The details experimental results of decolorization with ZrFe2O5 calcined at lower (650 °C) and higher temperature (900 °C) is given with this manuscript. See DOI: 10.1039/c5ra06148b |
|
This journal is © The Royal Society of Chemistry 2015 |
Click here to see how this site uses Cookies. View our privacy policy here.