Controlled synthesis of LiNi0.5Mn1.5O4 cathode materials with superior electrochemical performance through urea-based solution combustion synthesis†
Chunyu Zhu*,
Cheng-gong Han and
Tomohiro Akiyama
Center for Advanced Research of Energy & Materials, Hokkaido University, Sapporo 060-8628, Japan. E-mail: chunyu6zhu@gmail.com; chunyu6zhu@eng.hokudai.ac.jp; Fax: +81-11-726-0731; Tel: +81-11-706-6842
First published on 29th May 2015
Abstract
High-voltage LiNi0.5Mn1.5O4 cathode materials were synthesized using urea-based solution combustion synthesis combined with a calcination treatment. The morphology and particle size distribution of the products were considerably dependent on the amount of urea fuel. The electrochemical characterization illustrated that the sample that was produced with a fuel ratio of ϕ = 0.5 had a homogenous particle size distribution of approximately 8 μm, and showed the best cycling and rate performance. LiNi0.5Mn1.5O4 with two different structures of disordered Fd![[3 with combining macron]](https://www.rsc.org/images/entities/char_0033_0304.gif) m and ordered P4332 were obtained by controlling the calcination process. The samples, which were calcined at 800 °C with fast cooling, presented a disordered structure of Fd
m and ordered P4332 were obtained by controlling the calcination process. The samples, which were calcined at 800 °C with fast cooling, presented a disordered structure of Fd![[3 with combining macron]](https://www.rsc.org/images/entities/char_0033_0304.gif) m, and the samples, which were calcined at 800 °C with slow cooling and reannealing at 600 °C, demonstrated an ordered structure of P4332. The sample with a disordered structure exhibited a better electrochemical performance than the sample with an ordered structure. The disordered sample produced at ϕ = 0.5 presented a discharge capacity of 130.73 mA h g−1 and a capacity retention of 98.43% after 100 cycles at 1 C. Even at a higher current rate of 3 C, the sample still showed a high discharge capacity of 117.79 mA h g−1 and a capacity retention efficiency of 97.63% after 300 cycles.
m, and the samples, which were calcined at 800 °C with slow cooling and reannealing at 600 °C, demonstrated an ordered structure of P4332. The sample with a disordered structure exhibited a better electrochemical performance than the sample with an ordered structure. The disordered sample produced at ϕ = 0.5 presented a discharge capacity of 130.73 mA h g−1 and a capacity retention of 98.43% after 100 cycles at 1 C. Even at a higher current rate of 3 C, the sample still showed a high discharge capacity of 117.79 mA h g−1 and a capacity retention efficiency of 97.63% after 300 cycles.
1. Introduction
Over the past few decades, lithium ion batteries (LIBs) have been considered to be the most attractive power source for mobile electronics, hybrid electric vehicles (HEVs), electric vehicles (EVs), and smart grids.1–3 However, it is necessary to further increase the energy density of the present LIBs, especially at high charge–discharge rates, in order to meet the requirements of EVs and smart grids. The energy density of present commercial LIBs can be greatly increased by employing high-voltage cathode materials. Among the various cathode materials, spinel LiNi0.5Mn1.5O4 (LNMO) is considered to be one of the most promising 5 V cathode materials for LIBs because of its high operation voltage, the low cost of its raw material, its non-toxicity, and environmental friendliness. The high operating voltage of approximately 4.7 V vs. Li/Li+ enables the LNMO to deliver a high energy density of 650 W h kg−1, while the conventional 4 V cathode materials of layered LiCoO2 and olivine LiFePO4 demonstrate values of 540 W h kg−1 and 500 W h kg−1, respectively.4–6It is essential to synthesize LNMO with high purity, high crystallinity, and a uniform morphology; otherwise, its electrochemical performance will be considerably impaired by the presence of impurities and irregular particles.7 Several synthesis approaches have been used to produce LNMO. These include the solid state method,8,9 co-precipitation method,10–12 hydrothermal method,13 and solution combustion synthesis.14,15 Among them, solution combustion synthesis (SCS) is a promising method for the production of highly homogenous oxide particles. This method uses a highly exothermic and self-sustaining redox reaction by heating an aqueous mixture of metal nitrates and a suitable organic fuel (glycine, urea). In this process, all the reagents are mixed at an atomic or molecular level, which enables the uniform (homogeneous) distribution of elements. Furthermore, the particle size is carefully controlled within a narrow distribution.16–18 The characteristics of the SCS-derived oxides, including their size, purity, and structure, are dominated by several synthetic parameters, such as the species of fuel, the fuel-to-nitrate ratio, and the subsequent sintering treatment following the SCS. These characteristics accordingly affect the electrochemical performance of LNMO as a cathode material in LIBs.
As a simple and low-cost organic compound, urea has been studied as a precipitation agent,19,20 but few studies on its use as a combustion agent in the nitrate–urea combustion synthesis of a LNMO system have been reported. Therefore, in this study, we synthesized spinel LiNi0.5Mn1.5O4 cathode materials by employing a nitrate–urea-based combustion synthesis method. The effect of the urea–nitrate ratio and the post-sintering treatment on the morphologies, sizes, structures, and electrochemical performances of the products were investigated.
2. Experimental section
2.1 Urea-based solution combustion synthesis
During the synthesis, lithium nitrate, nickel nitrate, and manganese nitrate at a molar ratio of Li/Ni/Mn = 1.05/0.5/1.5 (5% Li excess) were required to prepare 3 g of LNMO. These chemicals were dissolved in distilled water, and subsequently mixed with urea fuel to achieve the fuel to nitrate ratios (ϕ), of 0.2, 0.5, 1.0 and 1.5. Here, ϕ is the ratio between the total valencies of the fuel and the total valencies of the nitrate oxidizers, as described in previous studies.16,21 The obtained solutions containing metal nitrates and urea were heated to a temperature of 80 °C in order to evaporate excess water and to form gels. The gels were used for combustion synthesis within a lab-made apparatus.17,18,22 The combusted ash products were collected and roughly hand-milled using a mortar–pestle. To obtain a final product with well-crystallined LNMO, the SCSed powders were subsequently calcined at a temperature of 800 °C for 24 h in an ambient atmosphere and naturally cooled in the electronic furnace. The natural cooling in the electronic furnace resulted in a cooling rate of approximately 5–10 °C min−1, which will be referred to as the quenching/fast-cooling treatment of the sintered products. Alternatively, the SCSed powders were calcined at a temperature of 800 °C for 24 h, and subsequently cooled to 600 °C at cooling rate of 0.5 °C min−1. They were maintained at this temperature for 5 h and were subsequently naturally cooled to room temperature; this condition will be referred to as slow cooling and low temperature annealing.The samples were denoted as f0.2-800C24h, f0.5-800C24h, f1.0-800C24h, f1.5-800C24h, and f0.5-800C24h-600C5h based on their synthetic conditions. Here, the f-value indicates the fuel ratio of ϕ, and 800C24h indicates that the sample was calcined at 800 °C for 24 h, and so forth.
2.2 Material characterization
The as-prepared products were characterized by powder X-ray diffraction (XRD, Rigaku Miniflex, CuKα) and scanning electron microscopy (SEM, JEOL, JSM-7400F) in order to determine their crystalline structures and morphologies. A laser particle size distribution analyzer (HORIBA, LA-950) was used to characterize the particle size distribution of the products. The Raman spectra of the samples were acquired from a RENISHAW Raman spectrometer using an excitation wavelength of 532 nm.2.3 Electrochemical measurements
The electrochemical performance was measured using a two-electrode Swagelok cell.23,24 The cell assembly was conducted within an Ar-filled glove-box. To produce the working electrode, the as-prepared active material, conductive carbon (acetylene black), and a polyvinylidene fluoride (PVDF) binder were prepared with a weight ratio of 80![[thin space (1/6-em)]](https://www.rsc.org/images/entities/char_2009.gif) :
:![[thin space (1/6-em)]](https://www.rsc.org/images/entities/char_2009.gif) 10
10![[thin space (1/6-em)]](https://www.rsc.org/images/entities/char_2009.gif) :
:![[thin space (1/6-em)]](https://www.rsc.org/images/entities/char_2009.gif) 10; this was coated onto an Al foil current collector using N-methylpyrrolidone (NMP) as a solvent. A lithium disk was used as the counter and reference electrode. A 1 M solution of LiPF6 dissolved in a 50
10; this was coated onto an Al foil current collector using N-methylpyrrolidone (NMP) as a solvent. A lithium disk was used as the counter and reference electrode. A 1 M solution of LiPF6 dissolved in a 50![[thin space (1/6-em)]](https://www.rsc.org/images/entities/char_2009.gif) :
:![[thin space (1/6-em)]](https://www.rsc.org/images/entities/char_2009.gif) 50 (v/v) mixture of ethylene carbonate (EC) and dimethyl carbonate (DMC) was used as the electrolyte, and a Celgard glass fiber was used as the separator. The galvanostatic discharge–charge measurements were performed using an Arbin battery tester (MSTAT) with a potential range between 3.3 and 4.9 V versus Li/Li+, at a constant temperature of 25 °C. The cyclic voltammetry (CV) analysis was conducted using a potentiostat/galvanostat apparatus (Autolab, PGSTAT128N) at a potential scanning rate of 0.1 mV s−1 with a voltage range of 3.3–4.9 V.
50 (v/v) mixture of ethylene carbonate (EC) and dimethyl carbonate (DMC) was used as the electrolyte, and a Celgard glass fiber was used as the separator. The galvanostatic discharge–charge measurements were performed using an Arbin battery tester (MSTAT) with a potential range between 3.3 and 4.9 V versus Li/Li+, at a constant temperature of 25 °C. The cyclic voltammetry (CV) analysis was conducted using a potentiostat/galvanostat apparatus (Autolab, PGSTAT128N) at a potential scanning rate of 0.1 mV s−1 with a voltage range of 3.3–4.9 V.
3. Results and discussion
3.1 Preparation of nonstoichiometric LiNi0.5Mn1.5O4−δ and property characterization
LNMO usually has two different structures, namely nonstoichiometric LiNi0.5Mn1.5O4−δ and stoichiometric LiNi0.5Mn1.5O4, which belong to the crystallographic groups of disordered Fd![[3 with combining macron]](https://www.rsc.org/images/entities/char_0033_0304.gif) m and ordered P4332, respectively, depending on the Ni ordering in the lattice.25–27 The disordering of LNMO is related to the formation of oxygen vacancies that occurs when the sample is annealed at elevated temperatures greater than 700 °C. However, the ordered phase can be produced by applying very slow cooling and/or reannealing at temperatures lower than 700 °C. It has been reported that the disordered LNMO often demonstrates a better rate and cycling performance than the ordered LNMO.25–27
m and ordered P4332, respectively, depending on the Ni ordering in the lattice.25–27 The disordering of LNMO is related to the formation of oxygen vacancies that occurs when the sample is annealed at elevated temperatures greater than 700 °C. However, the ordered phase can be produced by applying very slow cooling and/or reannealing at temperatures lower than 700 °C. It has been reported that the disordered LNMO often demonstrates a better rate and cycling performance than the ordered LNMO.25–27
At the beginning of our experiment, the SCSed precursors were calcined at a temperature of 800 °C for 24 h and subsequently quenched in order to obtain LNMO products with a disordered spinel structure (with oxygen vacancies). Owing to the difficulties in the identification of the disordered Fd![[3 with combining macron]](https://www.rsc.org/images/entities/char_0033_0304.gif) m and ordered P4332 structures by X-ray diffraction,26,28 Raman spectroscopy was used to investigate the Ni/Mn ordering. Fig. 1 shows the Raman spectra of the samples that were obtained with fast cooling. These spectra were characterized with both few and weak peaks, which is indicative of the disordered Fd
m and ordered P4332 structures by X-ray diffraction,26,28 Raman spectroscopy was used to investigate the Ni/Mn ordering. Fig. 1 shows the Raman spectra of the samples that were obtained with fast cooling. These spectra were characterized with both few and weak peaks, which is indicative of the disordered Fd![[3 with combining macron]](https://www.rsc.org/images/entities/char_0033_0304.gif) m structure. In particular, the typical bands at 160 and 405 cm−1 were not observed, which are characteristic peaks for the ordered structure.29 The detailed comparison of these two structures is shown in section 3.3.
m structure. In particular, the typical bands at 160 and 405 cm−1 were not observed, which are characteristic peaks for the ordered structure.29 The detailed comparison of these two structures is shown in section 3.3.
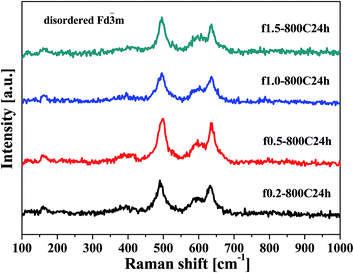 | ||
| Fig. 1 Raman spectra of the samples obtained at different fuel ratios and calcined at 800 °C for 24 h with fast cooling. | ||
The XRD patterns of the fast-cooled samples are shown in Fig. 2. All the samples present similar patterns that can be assigned to the cubic spinel structure of LNMO, and the diffraction peaks are in accordance with the standard powder diffraction card (PDF-80-2162) of the Fd![[3 with combining macron]](https://www.rsc.org/images/entities/char_0033_0304.gif) m group. There was no obvious peak that exhibited characteristics for the presence of the rock-salt LixNi1−xO impurity phase, i.e. close to the (400) peak of the nominal spinel structure of LNMO, observed in these samples. This impurity phase has been frequently observed during the synthesis of LNMO by the solid state method and other methods.8,11,30
m group. There was no obvious peak that exhibited characteristics for the presence of the rock-salt LixNi1−xO impurity phase, i.e. close to the (400) peak of the nominal spinel structure of LNMO, observed in these samples. This impurity phase has been frequently observed during the synthesis of LNMO by the solid state method and other methods.8,11,30
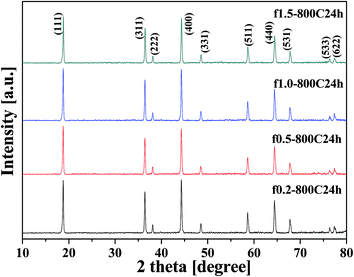 | ||
| Fig. 2 XRD patterns of the samples obtained at different fuel ratios and calcined at 800 °C for 24 h with fast cooling. | ||
Fig. 3 presents the SEM images of the LNMO samples obtained at different fuel ratios. The particle size of the products tends to increase as the amount of fuel increases. The f0.2-800C24h and f0.5-800C24h samples exhibit particles with an irregular morphology. They have a homogeneous particle size of several microns. The f1.0-800C24h sample exhibits spherical particles with diameters that range from several microns to larger than 10 microns; additionally, this sample demonstrates a larger size distribution than that of the f0.2-800C24h and f0.5-800C24h samples. Very interestingly, the spherical particles exhibit multi core–shell structure, as indicated by the images of some of the broken particles. The f1.5-800C24h sample exhibits large agglomerates with an irregular shape; their size is in the order of several tens of microns.
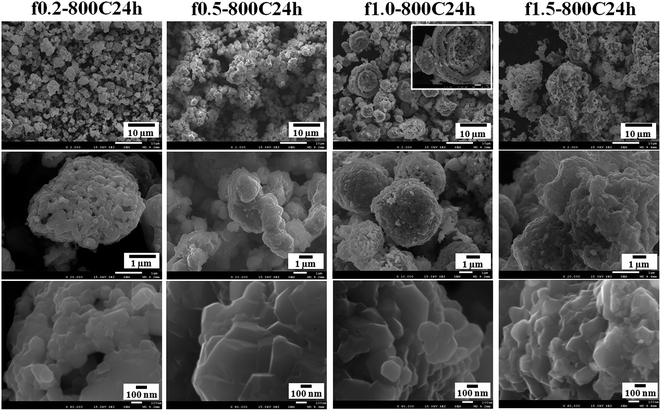 | ||
| Fig. 3 SEM images of the samples obtained with different fuel ratios and calcined at 800 °C for 24 h with fast cooling. | ||
The particle size distribution of the obtained samples was further measured using a laser diffraction particle size analyzer, as shown in Fig. S1 (ESI†). It is evident that the size distributions for the four samples are quite different. The particle size for the f0.2-800C24h sample demonstrates a narrow distribution, ranging from 1 μm to around 16 μm, with a single peak diameter of 5.5 μm. The particle sizes for the f0.5-800C24h sample show a broad distribution from 1.5 μm to around 30 μm, with a single peak diameter of 8.2 μm. The particle sizes for the f1.0-800C24h sample also demonstrates a broad distribution, ranging from 0.5 μm to around 30 μm; however, this sample displays two peak diameters with a main peak diameter at 8.3 μm and a weak peak diameter at 1.2 μm. The particles of the f1.5-800C24h sample exhibits a very broad size distribution from 0.5 μm to greater than 150 μm, and the sample has two typical peak diameters at 10.3 μm and 72.4 μm. Table S1 (ESI†) summarizes the typical particle diameters of the products, including the average diameter, median diameter, modal diameter, and geometric mean diameter, to represent the characteristics of the particle size distribution for the four samples.
In conclusion, these results indicate that the morphologies and particle size distributions of the SCSed samples are controlled by the fuel-to-nitrate ratios, which will significantly influence their electrochemical performance. Therefore, it is important to optimize the fuel condition in order to produce a LNMO cathode material with the best electrochemical properties.
3.2 Electrochemical performance of the LNMO with disordered structure
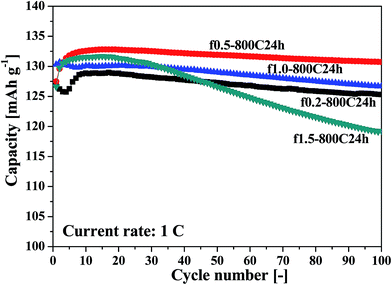
The lithium extraction/insertion behavior of the cathode materials were characterized by galvanostatic charging/discharging cycling in a voltage range of 3.3–4.9 V. Fig. 4 shows the cycling performance at a current rate of 1 C (1 C = 140 mA g−1), and Fig. S2 (ESI†) presents the corresponding charge–discharge curves from various cycles. It is apparent that the f0.5-800C24h sample exhibits the best cycling performance among the four samples, demonstrating a discharge capacity of 130.73 mA h g−1 and a capacity retention efficiency of 98.43% after 100 cycles. The charge–discharge curves, as shown in Fig. S2,† reversibly indicate two distinguishable pseudo-plateaus at around 4.70 V, and a small steep plateau at 4.0 V. Both the higher plateaus are associated with the Ni2+/Ni3+ and Ni3+/Ni4+ redox reactions, while the smaller plateau is related to the Mn3+/Mn4+ redox reaction, indicating that the LNMO materials obtained by fast cooling possess a disordered Fd![[3 with combining macron]](https://www.rsc.org/images/entities/char_0033_0304.gif) m structure.
m structure.
The lithium extraction/insertion behaviors of these samples were also characterized by CV analysis at a scan rate of 0.1 mV s−1, as shown in Fig. S3 (ESI†). For both the cathodic and anodic runs, two peaks are observed at approximately 4.5–4.85 V, corresponding to the redox reactions of Ni2+/Ni3+ and Ni3+/Ni4+. Additionally, a pair of weak and broad current bands can also be observed at around 4.0 V; this is because of the Mn3+/Mn4+ redox couple. This implies that a small fraction of Mn3+ was present in the nonstoichiometric LNMO with the Fd![[3 with combining macron]](https://www.rsc.org/images/entities/char_0033_0304.gif) m structure. It is known that the CV curves of a sample that exhibits good electrochemical performance should demonstrate great symmetry in the anodic and cathodic peaks, and upon cycling, the curves should be highly reproducible. Based on this, it is obvious that the f0.5-800C24h sample demonstrates the best performance. The potential values of the anodic and cathodic peaks were carefully investigated, and the potential difference between the anodic peaks (A1 and A2) and cathodic peaks (C1 and C2) at approximately 4.7 V are listed in Table S2 (ESI†). Here, the smaller values of these potential differences suggest that there is lower polarization between the oxidation/reduction processes, and hence a good electrochemical performance can be achieved. Here, the f0.5-800C24h sample demonstrates the smallest potential differences.
m structure. It is known that the CV curves of a sample that exhibits good electrochemical performance should demonstrate great symmetry in the anodic and cathodic peaks, and upon cycling, the curves should be highly reproducible. Based on this, it is obvious that the f0.5-800C24h sample demonstrates the best performance. The potential values of the anodic and cathodic peaks were carefully investigated, and the potential difference between the anodic peaks (A1 and A2) and cathodic peaks (C1 and C2) at approximately 4.7 V are listed in Table S2 (ESI†). Here, the smaller values of these potential differences suggest that there is lower polarization between the oxidation/reduction processes, and hence a good electrochemical performance can be achieved. Here, the f0.5-800C24h sample demonstrates the smallest potential differences.
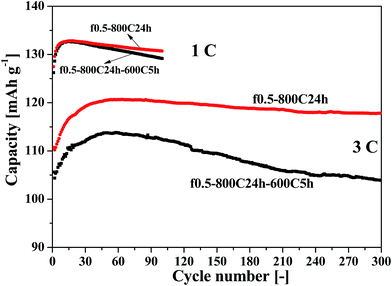
To further investigate the electrochemical characteristics of the LNMO cathodes, cycling measurements were also carried out at a higher current rate of 3 C and at varying current rates. Fig. S4 (ESI†) shows the cycling performance at a current rate of 3 C, and Fig. S5 (ESI†) presents the corresponding charge–discharge curves for the various cycles. Fig. S6 (ESI†) shows the cycling performance at varying current rates from 1 C to 5 C. The same conclusion can be obtained from these measurements; the f0.5-800C24h sample illustrates the best cycling performance. This sample demonstrates a discharge capacity of 117.79 mA h g−1 and a capacity retention efficiency of 97.63% following 300 cycles at a high current rate of 3 C.
The results of the charging–discharging cycling performance measured at 1 C and 3 C are summarized in Table 1.
| Sample | Q1st/discharge (mA h g−1); Coulombic efficiency | Qmax (mA h g−1) and cycle no. | Q100th (mA h g−1) | Capacity retention (%); Q100th/Qmax | Q1st/discharge (mA h g−1); Coulombic efficiency | Qmax (mA h g−1) and cycle no. | Q300th (mA h g−1) | Capacity retention (%); Q300th/Qmax |
|---|---|---|---|---|---|---|---|---|
| 1 C | 3 C | |||||||
| f0.2-800C24h | 126.91; 89.87% | 128.99; 17th | 125.30 | 97.14 | 124.40; 90.93% | 124.40 1st | 73.95 | 59.46 |
| f0.5-800C24h | 127.48; 91.88% | 132.82; 16th | 130.73 | 98.43 | 110.71; 91.61% | 120.65; 57th | 117.79 | 97.63 |
| f1.0-800C24h | 130.30; 89.93% | 130.60; 2nd | 126.69 | 97.01 | 101.73; 91.03% | 109.82; 69th | 97.59 | 88.86 |
| f1.5-800C24h | 126.62; 90.45% | 131.69; 15th | 119.24 | 90.55 | 102.22; 87.67% | 108.53; 14th | 76.78 | 70.75 |
| f0.5-800C24h-600C5h | 126.24; 91.43 | 132.72; 16th | 129.17 | 97.33 | 105.62; 91.03% | 113.82; 58th | 103.89 | 91.28 |
When compared with several pioneering reports on LNMO materials, it was found that our samples exhibit an excellent rate and cycling performance. For example, Zhu Z. et al.31 reported on the oxalic acid-pretreated solid-state method for synthesizing LNMO, which demonstrated an initial capacity of 136.9 mA h g−1 and a capacity retention of 93.4% after 300 cycles under 0.3 C. Liu H. et al.32 synthesized LNMO using a modified oxalate co-precipitation method, and the sample showed a capacity of around 136 mA h g−1 at 0.2 C, with a capacity retention of more than 98% after 50 cycles. Spherical hierarchical LNMO was produced by a novel composite co-precipitation method,7 and the sample delivered an initial capacity of 136.3 mA h g−1 with a retention efficiency of 94.4% after 200 cycles at 1 C.
3.3 Comparison of the electrochemical performance of the ordered and disordered LNMO
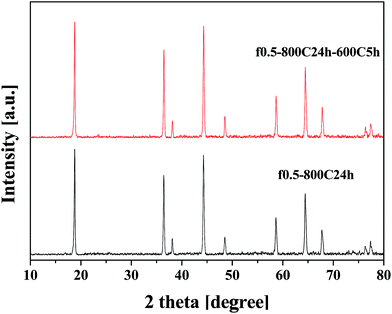
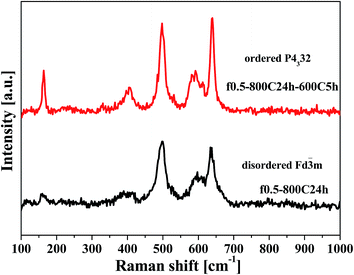
Fig. 5 shows the XRD patterns for the f0.5-800C24h-600C5h and f0.5-800C24h samples which were prepared under different heat treatments. The samples present the typical spinel structure of LNMO, which are the same as those shown in Fig. 2. The Ni ordering state of these samples was further identified by Raman spectroscopy, and Fig. 6 presents the Raman spectra of these two samples. The f0.5-800C24h-600C5h sample shows much more intense and sharper peaks than the f0.5-800C24h sample. In addition, the characteristic peaks at 160 and 405 cm−1, which are indicative of an ordered structure,27,29 were observed for the slowly cooled and reannealed f0.5-800C24h-600C5h sample. Therefore, the formation of ordered LNMO was achieved by combination of slow cooling and reannealing the sample at a lower temperature of 600 °C.The electrochemical performance of the ordered and disordered LNMO was compared.
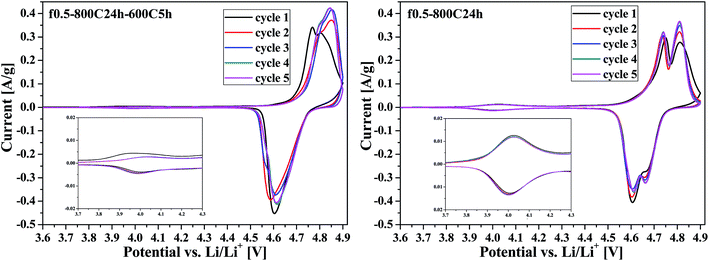
Fig. 7 exhibits the CV curves of the f0.5-800C24h-600C5h and f0.5-800C24h samples. In general, the ordered LNMO with a P4332 space group only shows a strong oxidation peak at around 4.75 V and a strong reduction peak at around 4.6 V, corresponding to the Ni2+/Ni4+ redox couple. However, for the disordered LNMO of Fd![[3 with combining macron]](https://www.rsc.org/images/entities/char_0033_0304.gif) m space group, the oxidation or reduction peak was split into two separate peaks at around 4.7 V, illustrating the redox reaction of Ni2+/Ni3+ and Ni3+/Ni4+. Additionally, the enlarged peaks at around 4.0 V, which represent the Mn3+/Mn4+ redox couple, were compared for these two structures. The peaks at 4.0 V for the ordered sample are significantly weaker than those of the disordered sample, confirming that the f0.5-800C24h-600C5h sample has a good Ni ordering structure.
m space group, the oxidation or reduction peak was split into two separate peaks at around 4.7 V, illustrating the redox reaction of Ni2+/Ni3+ and Ni3+/Ni4+. Additionally, the enlarged peaks at around 4.0 V, which represent the Mn3+/Mn4+ redox couple, were compared for these two structures. The peaks at 4.0 V for the ordered sample are significantly weaker than those of the disordered sample, confirming that the f0.5-800C24h-600C5h sample has a good Ni ordering structure.
Fig. 8 shows the cycling performance of the f0.5-800C24h-600C5h and f0.5-800C24h samples at current rates of 1 C and 3 C. The ordered f0.5-800C24h-600C5h sample demonstrated a capacity of 129.17 mA h g−1 and a capacity retention of 97.33% after 100 cycles at 1 C, as compared with the disordered f0.5-800C24h sample that demonstrated a capacity of 130.73 mA h g−1 and a retention efficiency of 98.43%. At a higher current rate of 3 C, the ordered sample presented a capacity of 103.89 mA h g−1 and a capacity retention of 91.28% after 300 cycles, while the disordered sample showed a capacity of 117.79 mA h g−1 and a capacity retention of 97.63%. These electrochemical performance results are summarized in Table 1.
Fig. S7 (ESI†) presents the charge–discharge curves for the f0.5-800C24h-600C5h sample at different cycles, which were cycled at current rates of 1 C and 3 C. The results are considerably different from the discharge–charge curves, as shown in Fig. S2 (ESI) and S5 (ESI†), for the disordered samples that present two distinguishable high voltage plateaus at around 4.70 V and a small steep plateau at 4.0 V. The ordered f0.5-800C24h-600C5h sample showed a single high voltage plateau at around 4.70 V and the low voltage plateau at 4.0 V was almost negligible. These results are consistent with those of the CV measurements.
According to the above electrochemical measurements, it can be summarized that the ordered LNMO exhibited a worse cycling performance than the disordered LNMO. This conclusion is the same as previous reports.28,33 According to these literatures, the poor cycling performance of the P4332 spinels is primarily due to two reasons: (a) the decreased electrical conductivity because of the suppressed Mn3+ content, and (b) the delayed two-phase transformation that occurs during the Li-intercalation process. In consideration of the electron hopping in solid ionic materials, the electrical conductivity of materials is strongly affected by the structure ordering. In the ordered spinels, the electron hopping between Mn3+ and Ni2+ is suppressed because of the good Ni and Mn ordering, and the electron transfer is dominated by “Ni2+/3+ → Ni3+/4+”. However, in disordered spinels, two additional electron hopping paths, including “Ni2+/3+ → Mn4+ → Ni3+/4+” and “Ni2+/3+ → Mn4+ ↔ Mn3+ → Ni3+/4+”, are produced because of the Ni and Mn disordering. These electron hopping paths contribute to superior electron transfer ability, therefore enhancing the electrochemical performance.
4. Conclusions
In this study, LiNi0.5Mn1.5O4 cathode materials were prepared by a urea-based solution combustion synthesis followed by calcination treatment. The morphology and particle size distribution of the products were considerably dependent on the amount of urea fuel. Furthermore, the crystal structure of the products was influenced by the calcination process. The samples calcined at 800 °C under an air atmosphere with fast cooling exhibited an disordered structure of Fd![[3 with combining macron]](https://www.rsc.org/images/entities/char_0033_0304.gif) m, while the samples calcined at 800 °C with slow cooling and reannealing at 600 °C exhibited an ordered structure of P4332. The electrochemical characterization illustrated that the sample with disordered structure demonstrated a better cycling performance than the sample with an ordered structure. The disordered sample produced at a fuel ratio of ϕ = 0.5, which had a homogenous particle size distribution of around 8 μm, demonstrated the best cycling and rate performance. This sample presented a discharge capacity of 130.73 mA h g−1 and a capacity retention efficiency of 98.43% following 100 cycles at 1 C. Even at a higher current rate of 3 C, the sample still showed a high discharge capacity of 117.79 mA h g−1 and a capacity retention efficiency of 97.63% following 300 cycles.
m, while the samples calcined at 800 °C with slow cooling and reannealing at 600 °C exhibited an ordered structure of P4332. The electrochemical characterization illustrated that the sample with disordered structure demonstrated a better cycling performance than the sample with an ordered structure. The disordered sample produced at a fuel ratio of ϕ = 0.5, which had a homogenous particle size distribution of around 8 μm, demonstrated the best cycling and rate performance. This sample presented a discharge capacity of 130.73 mA h g−1 and a capacity retention efficiency of 98.43% following 100 cycles at 1 C. Even at a higher current rate of 3 C, the sample still showed a high discharge capacity of 117.79 mA h g−1 and a capacity retention efficiency of 97.63% following 300 cycles.
Acknowledgements
This work was financially supported partially by the Japan Society for Promotion of Science (JSPS) and Japan Science and Technology Agency (JST).References
- J. B. Goodenough and K.-S. Park, J. Am. Chem. Soc., 2013, 135, 1167–1176 CrossRef CAS PubMed.
- M. M. Thackeray, C. Wolverton and E. D. Isaacs, Energy Environ. Sci., 2012, 5, 7854–7863 CAS.
- M. K. Devaraju, Q. D. Truong, T. Tomai and I. Honma, RSC Adv., 2014, 4, 27452–27470 RSC.
- A. Manthiram, K. Chemelewski and E.-S. Lee, Energy Environ. Sci., 2014, 7, 1339–1350 CAS.
- D. Liu, W. Zhu, J. Trottier, C. Gagnon, F. Barray, A. Guerfi, A. Mauger, H. Groult, C. M. Julien, J. B. Goodenough and K. Zaghib, RSC Adv., 2014, 4, 154–167 RSC.
- X. Xu, S. Lee, S. Jeong, Y. Kim and J. Cho, Mater. Today, 2013, 16, 487–495 CrossRef CAS PubMed.
- Z. Zhu, Q. Lu, D. Zhang and H. Yu, Electrochim. Acta, 2014, 115, 290–296 CrossRef CAS PubMed.
- Y.-Z. Lv, Y.-Z. Jin, Y. Xue, J. Wu, X.-G. Zhang and Z.-B. Wang, RSC Adv., 2014, 4, 26022–26029 RSC.
- X.-W. Gao, Y.-F. Deng, D. Wexler, G.-H. Chen, S.-L. Chou, H.-K. Liu, Z.-C. Shi and J.-Z. Wang, J. Mater. Chem. A, 2015, 3, 404–411 CAS.
- Z. Liu, Y. Jiang, X. Zeng, G. Xiao, H. Song and S. Liao, J. Power Sources, 2014, 247, 437–443 CrossRef CAS PubMed.
- T.-F. Yi, Z.-K. Fang, Y. Xie, Y.-R. Zhu and L.-Y. Zang, Electrochim. Acta, 2014, 147, 250–256 CrossRef CAS PubMed.
- X. Li, W. Guo, Y. Liu, W. He and Z. Xiao, Electrochim. Acta, 2014, 116, 278–283 CrossRef CAS PubMed.
- Y. Liu, M. Zhang, Y. Xia, B. Qiu, Z. Liu and X. Li, J. Power Sources, 2014, 256, 66–71 CrossRef CAS PubMed.
- G. Liu, X. Kong, H. Sun and B. Wang, Ceram. Int., 2014, 40, 14391–14395 CrossRef CAS PubMed.
- C. Zhu and T. Akiyama, Electrochim. Acta, 2014, 127, 290–298 CrossRef CAS PubMed.
- C. Zhu, A. Nobuta, I. Nakatsugawa and T. Akiyama, Int. J. Hydrogen Energy, 2013, 38, 13238–13248 CrossRef CAS PubMed.
- C. Zhu, N. Sheng and T. Akiyama, RSC Adv., 2015, 5, 21066–21073 RSC.
- C. Zhu, G. Saito and T. Akiyama, J. Alloys Compd., 2015, 633, 424–429 CrossRef CAS PubMed.
- K. Du, C. Hua, C. Tan, Z. Peng, Y. Cao and G. Hu, J. Power Sources, 2014, 263, 203–208 CrossRef CAS PubMed.
- Z. Wang, S. Huang, B. Chen, H. Wu and Y. Zhang, J. Mater. Chem. A, 2014, 2, 19983–19987 CAS.
- C. Zhu, A. Nobuta, Y.-W. Ju, T. Ishihara and T. Akiyama, Int. J. Hydrogen Energy, 2013, 38, 13419–13426 CrossRef CAS PubMed.
- C. Zhu, A. Nobuta, G. Saito, I. Nakatsugawa and T. Akiyama, Adv. Powder Technol., 2014, 25, 342–347 CrossRef CAS PubMed.
- C. Zhu, G. Saito and T. Akiyama, J. Mater. Chem. A, 2013, 1, 7077–7082 CAS.
- C. Zhu and T. Akiyama, RSC Adv., 2014, 4, 10151–10156 RSC.
- J.-H. Kim, A. Huq, M. Chi, N. P. W. Pieczonka, E. Lee, C. A. Bridges, M. M. Tessema, A. Manthiram, K. A. Persson and B. R. Powell, Chem. Mater., 2014, 26, 4377–4386 CrossRef CAS.
- G. Liu, K.-S. Park, J. Song and J. B. Goodenough, J. Power Sources, 2013, 243, 260–266 CrossRef CAS PubMed.
- J. Song, D. W. Shin, Y. Lu, C. D. Amos, A. Manthiram and J. B. Goodenough, Chem. Mater., 2012, 24(15), 3101–3109 CrossRef CAS.
- Y.-C. Jin, C.-Y. Lin and J.-G. Duh, Electrochim. Acta, 2012, 69, 45–50 CrossRef CAS PubMed.
- X. Zhu, X. Li, Y. Zhu, S. Jin, Y. Wang and Y. Qian, Electrochim. Acta, 2014, 121, 253–257 CrossRef CAS PubMed.
- Y. Xue, Z. Wang, F. Yu, Y. Zhang and G. Yin, J. Mater. Chem. A, 2014, 2, 4185–4191 CAS.
- Z. Zhu, H. Yan, D. Zhang, W. Li and Q. Lu, J. Power Sources, 2013, 224, 13–19 CrossRef CAS PubMed.
- H. Liu, G. Zhu, L. Zhang, Q. Qu, M. Shen and H. Zheng, J. Power Sources, 2015, 274, 1180–1187 CrossRef CAS PubMed.
- J. H. Kim, S. T. Myung, C. S. Yoon, S. G. Kang and Y. K. Sun, Chem. Mater., 2004, 16, 906–914 CrossRef CAS.
Footnote |
| † Electronic supplementary information (ESI) available. See DOI: 10.1039/c5ra06109a |
| This journal is © The Royal Society of Chemistry 2015 |

