Highly sensitive detection of 2,4,6-trinitrophenol (TNP) based on lysozyme capped CdS quantum dots

Weidan Na, Xiaotong Liu, Shu Pang and Xingguang Su*
Department of Analytical Chemistry, College of Chemistry, Jilin University, Changchun, 130012, China. E-mail: suxg@jlu.edu.cn; Tel: +86-431-85168352

Received 6th April 2015 , Accepted 26th May 2015

First published on 27th May 2015


Abstract

This work presents a novel method for nitroaromatic compound detection using lysozyme-capped CdS quantum dots (Lys-CdS QDs). Cd2+ can react with S2− to generate fluorescent CdS QDs in the presence of lysozyme. The Lys-CdS QDs can bind to 2,4,6-trinitrophenol (TNP) in water via an acid–base pairing interaction between the electron-rich amino ligands and the electron-deficient aromatic ring of TNP. The electrons in the QDs transfer to the TNP molecules, leading to fluorescence quenching. The fluorescence decreases with an increase in TNP concentration and the fluorescence intensity is negatively proportional to the TNP concentration in the range from 0.5 μmol L−1 to 15 μmol L−1 with a detection limit of 0.1 μmol L−1. The newly-developed fluorescence probe shows excellent resistance to the interference of metal ions, such as Cu2+, Fe3+, and Pb2+, when compared with other fluorescence probes. The present method is cost-effective, convenient, and does not require any complicated synthetic procedures.

1. Introduction

Nitroaromatic compounds are produced on a large scale in the chemical industry. They are used in the manufacture of pesticides, dyes, and pharmaceuticals, and are used as raw materials in the preparation of explosives. They present a high toxicity and have been proved to be potential carcinogens and mutagens.1,2 Among the different nitroaromatic compounds, 2,4,6-trinitrophenol (TNP) is the most common and powerful explosive, as well as capable of explosion without any triggers.3 Due to its higher water solubility, it contaminates groundwater and causes irritation to the skin, eyes and respiratory system.4,5 Due to its contamination in the environment and the risk to human health, selective and ultra-sensitive detection of TNP has attracted increasing attention.

A wide variety of materials and strategies have been developed for detecting nitroaromatic compounds. Among them, the fluorescence-quenching of materials is an effective and intriguing method for the determination of nitroaromatic compounds. To date, considerable effort has been devoted to the development of fluorescence-sensing materials to detect nitroaromatic compounds. The most popular fluorescence-sensing materials are conjugated polymers and luminescent dyes such as fluoranthene,6 poly(acrylic acid)–poly(pyrene methanol) (PAA–PM)7 and poly(p-phenylene ethynylene)s (PPEs),8 which can sense electron-deficient nitroaromatic compounds in solution via directional bonding. Venkatramaiah et al. prepared a novel fluoranthene-based fluorescent chemosensor for the detection of picric acid.6 Niamnont et al. successfully prepared a series of triphenylamine-based fluorophores, which show variable fluorescence quenching sensitivity towards nitroaromatic compounds and are useful for identifying different nitroaromatic compounds.9 Olley et al. investigated a series of branched fluorescent chromophores for the detection of nitroaromatic compounds in solution via a collisional process.10 The sensitivity of this method based on these materials is satisfactory. However, these materials rely mainly on complicated synthesis and usually are hydrophobic, which make the assay procedures time-consuming and complex.

Recently, quantum dots have been widely used as fluorescent materials for the analysis of biological molecules and environmental contaminants because of their novel optical properties and sensitive response to these analytes. Liu et al. designed a near-infrared fluorescence probe for the determination of TNP based on bovine serum albumin (BSA) coated CuInS2 QDs.11 Wang et al. prepared MoS2 QDs using cysteine as precursors to detect TNP based on the fluorescence quenching of the MoS2 QDs.12 Chen et al. reported a sensitive method for TNT detection using water-soluble L-cysteine-capped CdTe QDs as the fluorescence probe via the formation of Meisenheimer complexes between TNT and cysteine. Cysteine is used both as the stabilizer for the QDs and the primary amine provider.13 However, most QDs involved are pre-synthesized QDs, which need to be synthesized ahead of time via complicated synthetic procedures. The assay systems are frequently limited by high background signals caused by the non-specific adsorption of decorated QDs on surfaces or poor quenching of the donor couples.14

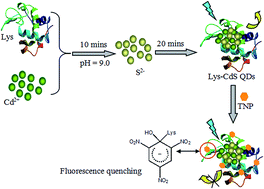
The operating mechanism in our assay system is represented in Scheme 1. In this study, the fluorescent CdS QDs could be generated in the presence of Cd2+ and S2− with lysozyme as the stabilizer. The lysozyme was employed to render the CdS QDs stable against aggregation and water-soluble. It is well known that the fluorescence properties of QDs have a close connection to the composition of the surface-capped layers. Abundant amino groups exist on lysozyme and can effectively bind TNP via the formation of Meisenheimer complexes between the electron-rich amino groups of lysozyme and the electron-deficient nitroaromatic rings of TNP.15,16 TNP bound to the surface of lysozyme can lead to fluorescence quenching through electron transfer from the conductive band of the CdS QDs to the lowest unoccupied molecular orbital of TNP.17,18 The new generation of CdS QDs in situ can avoid some drawbacks of pre-synthesized QDs in relevant analytical systems by decreasing the background signal. Therefore, we have developed a novel fluorescence probe for the rapid and highly sensitive detection of explosive TNP molecules.


image file: c5ra06101f-s1.tif
Scheme 1 The schematic illustration of the novel Lys-CdS QDs probe for the detection of TNP.

2. Experimental

2.1 Materials

All the reagents were of at least analytical grade. The water used in all the experiments had a resistivity higher than 18 MΩ cm−1. Cadmium(II) chloride (CdCl2), sodium hydroxide (NaOH), sodium sulfide nonahydrate (Na2S·9H2O), trihydroxymethyl aminomethane (Tris) and hydrochloric acid were purchased from Shanghai Qingxi Technology Co., Ltd. Phenol, TNP, dinitrotoluene (DNT), 4-nitrophenol (4-NP) and 2-nitrophenol (2-NP) were purchased from Sigma-Aldrich Corporation. Lysozyme was purchased from Dingguo Corporation. 0.1 mol L−1 Tris–HCl buffered solution (pH 9.0) was used as the medium for the detection process.

2.2 Apparatus

The fluorescence spectra were obtained using a Shimadzu RF-5301 PC spectrofluorophotometer equipped with a xenon lamp using right-angle geometry. UV-vis absorption spectra were obtained using a Varian GBC Cintra 10e UV-vis spectrometer. In both the experiments, a 1 cm path-length quartz cuvette was used. FT-IR spectra were recorded with a Bruker IFS66V FT-IR spectrometer equipped with a DGTS detector. All the pH measurements were made with a PHS-3C pH meter (Tuopu Co., Hangzhou, China). Transmission electron microscopy (TEM) experiments were performed on a Philips Tecnai F20 TEM operating at an acceleration voltage of 200 kV. The fluorescence lifetime and the quantum yield were obtained using an FLS 920 Fluorescence spectrometer.

2.3 Preparation of Lys-CdS QDs

Lys-CdS QDs were synthesized in an aqueous solution. 300 μL of 5 mmol L−1 lysozyme solution, 120 μL of 50 mmol L−1 CdCl2 solution and 150 μL of 0.1 mol L−1 Tris–HCl buffer (pH 9.0) were added into a 2 mL calibrated test tube and shaken thoroughly for 10 minutes. Subsequently, 90 μL of 30 mmol L−1 Na2S solution was added to the test tube and diluted to 1500 μL with deionized water followed by thorough shaking and equilibration for 20 minutes. 100 μL of the Lys-CdS QDs solution was diluted to 1500 μL with deionized water. The fluorescence spectra were recorded from 405 nm to 650 nm with an excitation wavelength of 340 nm. The slit widths for excitation and emission were both 10 nm.

2.4 The detection process

The Lys-CdS QDs solution (100 μL), 0.1 mol L−1 Tris–HCl buffer (pH 9.0, 150 μL), and different amounts of TNP or other nitroaromatic compounds (DNT, 4-NP, and 2-NP) and phenol were successively added to a 2.0 mL calibrated test tube. Then, the solution was diluted to 1500 μL with deionized water followed by thorough shaking and equilibration for 3 min until the solution was completely mixed. The fluorescence spectra were recorded from 405 nm to 650 nm with an excitation wavelength of 340 nm. The slit widths for excitation and emission were both 10 nm. The fluorescence (FL) intensity of the maximum emission peak was used for the quantitative analysis of the target molecules.

3. Results and discussion

3.1. Spectral characterization of the Lys-CdS QDs

As shown in Fig. 1, there was an increased absorption below 400 nm and a shoulder around 365 nm, which was the result of the 1Sh–1Se excitonic transition characteristic of CdS QDs.19 The fluorescence emission spectra of the Lys-CdS QDs showed a fluorescent peak with a maximum emission wavelength of 533 nm, which arised from the excitonic emission of the CdS QDs.20,21 Furthermore, the size and shape of the synthesized Lys-CdS QDs were studied by TEM and shown in Fig. 2. It could be seen that the synthesized particles are nearly spherical and the average size of the Lys-CdS QDs varies from 4 to 7 nm.22–24
image file: c5ra06101f-f1.tif
Fig. 1 The UV-vis absorption (dash line) and fluorescence emission spectra (solid line) of the Lys-CdS QDs.

image file: c5ra06101f-f2.tif
Fig. 2 TEM image of the Lys-CdS QDs (0.29 mg L−1).

The interactions between the CdS QDs and lysozyme molecules are mainly through interactions between the surface Cd2+ ions and lysozyme. If there is no lysozyme molecule as stabilizer in the assay system, the Cd2+ and S2− would generate some yellow precipitate and the fluorescence signal of CdS QDs is barely observed. The FT-IR spectra of the CdS crystals with and without lysozyme as stabilizers were compared to confirm the coordination of the lysozyme on the surface of the CdS QDs. As shown in Fig. S1 curve (b), the majority of lysozyme functional groups could be clearly found through the stretching vibration of N–H (3330 cm−1), the amide I band (1660 cm−1), amide II (1530 cm−1) band and amide III (1400–1200 cm−1) for the –CONH group,22 which were the characteristic peaks of lysozyme in the Lys-CdS QDs.25 In addition, these characteristic peaks were not observed in the FT-IR spectra of the uncapped CdS crystals (Fig. S1 curve (a)), which indicated the successful capping of lysozyme on the surface of the CdS QDs.

3.2 The effect of pH value and incubation time

To optimize the TNP detection conditions, the pH and reaction time were further examined. We systematically investigated the influence of pH on the fluorescence intensity of the Lys-CdS QDs and TNP–Lys-CdS system. As shown in Fig. 3, it could be seen that when the pH was changed from 6.6 to 9.0, the fluorescence intensity of the Lys-CdS QDs solution and TNP–Lys-CdS system both increased gradually and the fluorescence intensity ratio F0/F (F0 and F are the fluorescence intensity of the Lys-CdS QDs in the absence and presence of 10 μmol L−1 TNP, respectively) at pH 9.0 reached its maximum value. The effect of incubation time was also studied. Fig. S2 shows the temporal evolution of the fluorescence intensity of the Lys-CdS QDs solution after the addition of 2.5 μmol L−1 TNP. It could be seen that the fluorescence intensity of Lys-CdS QDs rapidly decreased after the addition of TNP and reached equilibrium in 3 minutes. Therefore, pH 9.0 and a reaction time of 3 minutes were selected for the detection process.
image file: c5ra06101f-f3.tif
Fig. 3 Fluorescence intensity of the Lys-CdS QDs (1.45 mg L−1) assay system without TNP (curve (a)) and with 10 μmol L−1 TNP (curve (b)) in different pH environments (pH 6.6–9.0).

3.3 The interactions between TNP and Lys-CdS QDs

A linear Stern–Volmer relationship may be observed if either a static or dynamic quenching process is dominant. The fluorescence lifetime measurements can help us to distinguish between the static and dynamic processes. With static quenching, the fluorescence decay lifetime of a material will remain unchanged as the concentration of analyte is increased. However, dynamic quenching provides an additional relaxation pathway for the excited molecules and therefore results in a decrease in the average fluorescence lifetime.26,27 Fig. 4 shows the fluorescence decay curves for the Lys-CdS QDs in the absence and presence of TNP and the related data is given in Table 1. The decay curves for the Lys-CdS QDs with and without TNP fitted well to the tri-exponential function.28,29 The average lifetime of the Lys-CdS QDs was 72.41 ns. After introducing TNP to the Lys-CdS QDs, the average lifetime reduced from 72.41 to 57.75 ns, indicating that the dynamic quenching process was dominant for the quenching mechanism. TNP is a typically electron-deficient compound due to the strong electron-withdrawing effect of the three nitro groups.30 Organic amino ligand modified nanocrystals utilized as the receptors for nitroaromatic compounds have been mentioned in some previous studies.12,17,31 In the case of Lys-CdS QDs, the electron-rich lysozyme can absorb the electron-deficient TNP on the surface of the Lys-CdS QDs through the formation of TNP–lysozyme Meisenheimer complexes. In addition, the electron transfer from the amino groups in the Lys-CdS QDs to TNP leads to the dynamic fluorescence quenching of the Lys-CdS QDs.32 The fluorescence quantum yield of Lys-CdS QDs was 28.98%.
image file: c5ra06101f-f4.tif
Fig. 4 Black curves represent the fluorescence decay curve for (1) Lys-CdS QDs and (2) Lys-CdS QDs after the addition of TNP. The excitation wavelength was tuned to 360 nm. Fluorescence emission was collected at 535 nm. The green curves represent the decay fit for (1) Lys-CdS QDs and (2) Lys-CdS QDs after the addition of TNP. The concentration of Lys-CdS QDs and TNP was 1.45 mg L−1 and 1 μmol L−1, respectively.
Table 1 Fitting parameters for the Lys-CdS QDs and Lys-CdS QDs/TNPa
Sample α1 α2 α3 τ1 τ2 τ3 τav
a τ = lifetime in nanoseconds, τav = average lifetime in nanoseconds, α = amplitude.
Lyz-CdS QDs 10.85 24.75 64.40 1.59 16.86 105.69 72.41
Lyz-CdS QDs/TNP 11.11 24.08 64.81 1.21 11.53 84.62 57.75


Fig. 5 shows the evolution of the fluorescence spectra of Lys-CdS QDs with increasing TNP concentration. It can be seen that the fluorescence intensity of Lys-CdS QDs obviously decreased with an increase in TNP concentration from 0 to 30 μmol L−1. Furthermore, the inset in Fig. 5 shows that there was a good linear relationship between the fluorescence intensity ratio F0/F (F0 and F are the fluorescence intensity of the Lys-CdS QDs before and after the addition of TNP, respectively) and the TNP concentration in the range from 0.5 μmol L−1 to 15 μmol L−1. The regression equation was

F0/F = 0.91222 + 0.32996[TNP], μmol L−1


image file: c5ra06101f-f5.tif
Fig. 5 The fluorescence spectra of Lys-CdS QDs (1.45 mg L−1) upon the addition of different concentrations of TNP in the range from 0 to 30 μmol L−1 (0, 0.5, 1.0, 2.0, 5.0, 7.5, 10, 15, 20 and 30 μmol L−1). Inset: Stern–Volmer plots for the Lys-CdS QDs at 533 nm in the presence of TNP; 10 mmol L−1 pH 9.0 Tris–HCl buffer solution, incubation for 3 minutes.

The correlation coefficient was R2 = 0.999 and the detection limit for TNP was 0.1 μmol L−1, which were calculated following the 3σ IUPAC criteria. A comparison between the proposed method and some other techniques for TNP detection in LOD and the linear range are reported in Table S1.12,33–36 Compared with conventional methods, our present method offered a comparable detection limit and linear range. We established a novel method for TNP detection based on the dynamic quenching of the Lys-CdS QDs. Our method could significantly reduce the time and costs related with TNP assays.

3.4 The interactions between TNP, DNT, 4-NP, 2-NP or phenol and Lys-CdS QDs

To check the selectivity of the Lys-CdS QDs towards TNP, we also performed the abovementioned fluorescence quenching experiment with other compounds such as DNT, 4-NP, 2-NP and phenol. The structure, full name and abbreviation of the analytes are shown in Fig. S3. Compared to the fluorescence intensity of the blank sample (F0), the four nitroaromatic compounds and phenol showed noticeably different quenching behaviors for the Lys-CdS QDs. As shown in Fig. 6A, the fluorescence quenching was in the order of TNP > DNT > 4-NP > 2-NP > phenol, which was related to the number of nitro groups in the corresponding aromatic ring and irrespective of the presence of intramolecular hydrogen bonds. Both 4-NP and 2-NP molecules had two nitro groups. However, 4-NP had a stronger quenching ability to the Lys-CdS QDs than 2-NP. 2-NP was prone to form an intramolecular hydrogen bond between the hydroxyl and nitro group, which would weaken the electron-withdrawing ability of the nitro group.
image file: c5ra06101f-f6.tif
Fig. 6 (A) The fluorescence quenching ratios F/F0 for the Lys-CdS QDs (1.45 mg L−1) after the addition of 12.5 μmol L−1 TNP, DNT, 4-NP, 2-NP and phenol. F0 and F were the fluorescence intensity of Lys-CdS QDs before and after the addition of 12.5 μmol L−1 nitroaromatic compound and phenol, respectively. (B) Stern–Volmer plots for the Lys-capped CdS QDs with an increasing concentration of TNP, DNT, 4-NP, 2-NP and phenol; 10 mmol L−1 Tris–HCl buffer solution, incubation for 3 minutes.

A Stern–Volmer plot was used to evaluate the relative affinities of the Lys-CdS QDs to the nitroaromatic compounds and phenol[4]. F0 and F are fluorescence intensity before and after the addition of nitroaromatic compounds or phenol, respectively. KSV is the Stern–Volmer constant (M−1) and [A] is the molar concentration of analytes added.10,37

(F0/F) − 1 = KSV[A]

As shown in Fig. 6B, the linear Stern–Volmer relationships were observed for TNP, DNT, 4-NP, 2-NP and phenol in a concentration range of 0.5–15 μM. The KSV values for the Lys-CdS QDs fluorescence quenching with TNP, DNT, 4-NP, 2-NP and phenol were 32[thin space (1/6-em)]880, 12[thin space (1/6-em)]320, 5000, 1980 and 158 M−1, respectively. The affinity between the Lys-CdS QDs and the nitroaromatic compounds corresponding to the KSV follows the order of TNP > DNT > 4-NP > 2-NP > phenol. It is observed that the KSV values for TNP are considerably larger than those for the other nitroaromatic compounds and phenol, suggesting a very predominant selectivity for TNP from the other compounds. The fluorescence dynamic quenching process mainly results in photoinduced electron transfer (PET) mechanisms. During the PET mechanism, electrons are first excited from the HOMO energy levels of the Lys-CdS QDs to its LUMO energy levels and then transferred to the LUMO energy levels of the electron-deficient nitroaromatic compounds, causing fluorescence quenching. The energy gap between the LUMOs of the donor fluorophore (Lys-CdS QDs) and the acceptor nitroaromatic compounds is the main driving force for this transition.38,39 TNP has the lowest LUMO energy level,4 which results in the high selectivity of the Lys-CdS QDs towards TNP.

3.5 Interference study

In this work, we studied the effect of a series of foreign metal ions and organic molecules on the fluorescence of the Lys-CdS QDs before and after the addition of 2.5 μM TNP. From Fig. 7, it can be seen that the fluorescence intensity of both the Lys-CdS QDs and TNP–Lys-CdS QDs system show a high tolerance to most common metal ions and organic molecules. The fluorescence intensity of the Lys-CdS QDs decreased dramatically with 2.5 μM TNP and kept stable even in the presence of 25 μmol L−1 heavy metal ions such as Cu2+, Fe3+, and Pb2+. These results indicate that the lysozyme layers prevented these metal ions from being adsorbed on the surface of the CdS QDs. In addition, other common organic molecules, such as hydroquinone, tartaric acid, and pyridine, do not induce the fluorescence quenching of the Lys-CdS QDs under the same conditions. Therefore, this method has a high selectivity and excellent resistance to these interferences.
image file: c5ra06101f-f7.tif
Fig. 7 The fluorescence intensity of Lys-CdS QDs (1.45 mg L−1) before and after adding 2.5 μmol L−1 TNP in the presence of 25 μmol L−1 metal cations and other organic molecules. (1) Blank, (2) K+, (3) Ca2+, (4) Na+, (5) Mg2+, (6) Ba2+ (7) Fe3+, (8) Zn2+, (9) Cu2+, (10) Pb2+, (11) sodium citrate, (12) tartaric acid, (13) resorcinol, (14) hydroquinone, (15) dimethylformamide, (16) acetonitrile, (17) pyridine, (18) furan and (19) acetic acid; 10 mmol L−1 pH 9.0 Tris–HCl buffer solution, incubation for 3 minutes.

3.6 Analytical applications

To further investigate the potential practical applications of this method, the detection of TNP in tap and spring water samples was carried out. The water samples were filtered several times through qualitative filter paper. The results showed that TNP was not detected in the abovementioned samples, and the results obtained by the standard addition method are listed in Table 1. From Table 2, we could see that the RSD was lower than 3.8% and the average recoveries of TNP in the real samples was in the range of 98–110%, indicating that this method has potential in environmental applications for TNP detection.
Table 2 Results for TNP determination in real water samples
Sample Added (μmol L−1) Found (μmol L−1) Recovery (%) RSD (n = 3) (%)
Tap water 0.5 0.52 104 3.3
2 2.20 110 3.8
Spring water 0.5 0.49 98 2.7
2 2.01 101 2.6


4. Conclusions

In summary, we have successfully utilized lysozyme as a stabilizer to prepare the Lys-CdS QDs for the detection of TNP. The fluorescence of Lys-CdS QDs was quenched by TNP through a dynamic quenching mechanism. This method is highly sensitive to detect TNP to as low as 0.1 μM and selective to TNP over other nitroaromatic compounds (TNP, DNT, 4-NP and 2-NP), which is dependent on the electron-accepting ability. The proposed method was simple, convenient and had more resistance to the interference of heavy metal ions and other organic molecules. The one-pot synthesized aptamer-functionalized CdS QDs have been developed as a new class of fluorophores that could be applied for the detection of various analytes based on different signal-transducing mechanisms.

Acknowledgements

This work was financially supported by the National Natural Science Foundation of China (no. 21075050, no. 21275063) and the science and technology development project of Jilin province, China (no. 20110334).

References

  1. Y. H. Lee, H. Liu, J. Y. Lee, S. H. Kim, S. K. Kim, J. L. Sessler, Y. Kim and J. S. Kim, Chem.–Eur. J., 2010, 16, 5895–5901 CrossRef CAS PubMed.
  2. L. Fan, Y. Hu, X. Wang, L. Zhang, F. Li, D. Han, Z. Li, Q. Zhang, Z. Wang and L. Niu, Talanta, 2012, 101, 192–197 CrossRef CAS PubMed.
  3. F. Zhang, L. Luo, Y. Sun, F. Miao, J. Bi, S. Tan, D. Tian and H. Li, Tetrahedron, 2013, 69, 9886–9889 CrossRef CAS PubMed.
  4. D. Dinda, A. Gupta, B. K. Shaw, S. Sadhu and S. K. Saha, ACS Appl. Mater. Interfaces, 2014, 6, 10722–10728 CAS.
  5. F. Chu, G. Tsiminis, N. A. Spooner and T. M. Monro, Sens. Actuators, B, 2014, 199, 22–26 CrossRef CAS PubMed.
  6. N. Venkatramaiah, S. Kumar and S. Patil, Chem. Commun., 2012, 48, 5007–5009 RSC.
  7. X. Wang, C. Drew, S.-H. Lee, K. J. Senecal, J. Kumar and L. A. Samuelson, Nano Lett., 2002, 2, 1273–1275 CrossRef CAS.
  8. D. Zhao and T. M. Swager, Macromolecules, 2005, 38, 9377–9384 CrossRef CAS.
  9. N. Niamnont, N. Kimpitak, K. Wongravee, P. Rashatasakhon, K. K. Baldridge, J. S. Siegel and M. Sukwattanasinitt, Chem. Commun., 2013, 49, 780–782 RSC.
  10. D. A. Olley, E. J. Wren, G. Vamvounis, M. J. Fernee, X. Wang, P. L. Burn, P. Meredith and P. E. Shaw, Chem. Mater., 2011, 23, 789–794 CrossRef CAS.
  11. S. Liu, F. Shi, L. Chen and X. Su, Talanta, 2013, 116, 870–875 CrossRef CAS PubMed.
  12. Y. Wang and Y. Ni, Anal. Chem., 2014, 86, 7463–7470 CrossRef CAS PubMed.
  13. Y. Chen, Z. Chen, Y. He, H. Lin, P. Sheng, C. Liu, S. Luo and Q. Cai, Nanotechnology, 2010, 21, 125502 CrossRef PubMed.
  14. G. Garai-Ibabe, M. Möller and V. Pavlov, Anal. Chem., 2012, 84, 8033–8037 CrossRef CAS PubMed.
  15. E. R. Goldman, I. L. Medintz, J. L. Whitley, A. Hayhurst, A. R. Clapp, H. T. Uyeda, J. R. Deschamps, M. E. Lassman and H. Mattoussi, J. Am. Chem. Soc., 2005, 127, 6744–6751 CrossRef CAS PubMed.
  16. X. Li, S. Liu, Z. Wu and J. Jiang, Acta Chim. Sin., 2014, 72, 563–568 CrossRef CAS.
  17. R. Tu, B. Liu, Z. Wang, D. Gao, F. Wang, Q. Fang and Z. Zhang, Anal. Chem., 2008, 80, 3458–3465 CrossRef CAS PubMed.
  18. Y. Ma, H. Li, S. Peng and L. Wang, Anal. Chem., 2012, 84, 8415–8421 CrossRef CAS PubMed.
  19. H. Matsumoto, T. Sakata, H. Mori and H. Yoneyama, J. Phys. Chem., 1996, 100, 13781–13785 CrossRef CAS.
  20. S. Liu, W. Na, S. Pang and X. Su, Biosens. Bioelectron., 2014, 58, 17–21 CrossRef CAS PubMed.
  21. G. Garai-Ibabe, L. Saa and V. Pavlov, Anal. Chem., 2013, 85, 5542–5546 CrossRef CAS PubMed.
  22. M. A. Ali, S. Srivastava, M. K. Pandey, V. V. Agrawal, R. John and B. D. Malhotra, Anal. Chem., 2014, 86, 1710–1718 CrossRef CAS PubMed.
  23. L. Saa, A. Virel, J. Sanchez-Lopez and V. Pavlov, Chem.–Eur. J., 2010, 16, 6187–6192 CrossRef CAS PubMed.
  24. H. B. Ren and X. P. Yan, Talanta, 2012, 97, 16–22 CrossRef CAS PubMed.
  25. S. Chinnathambi, D. Velmurugan, N. Hanagata, P. R. Aruna and S. Ganesan, J. Lumin., 2014, 151, 1–10 CrossRef CAS PubMed.
  26. E. Kavery, N. Nagarajan, G. Paramaguru and R. Renganathan, Spectrochim. Acta, Part A, 2015, 146, 13–23 CrossRef CAS PubMed.
  27. T. Funada, T. Hirose, N. Tamai and H. Yao, Phys. Chem. Chem. Phys., 2015, 17, 11006–11013 RSC.
  28. J. Debgupta, S. Mandal, H. Kalita, M. Aslam, A. Patra and V. Pillai, RSC Adv., 2014, 4, 13788–13795 RSC.
  29. D. Lu, L. Liu, F. Li, S. Shuang, Y. Li, M. F. Choi and C. Dong, Spectrochim. Acta, Part A, 2014, 121, 77–80 CrossRef CAS PubMed.
  30. P. G. Rieger, V. Sinnwell, A. Preuß, W. Franke and H. J. Knackmuss, J. Bacteriol., 1999, 181, 1189–1195 CAS.
  31. T. Pazhanivel, D. Nataraj, V. P. Devarajan, V. Mageshwari, K. Senthil and D. Soundararajan, Anal. Methods, 2013, 5, 9–10 RSC.
  32. D. K. Singha and P. Mahata, RSC Adv., 2015, 5, 28092–28097 RSC.
  33. O. Pinrat, K. Boonkitpatarakul, W. Paisuwan, M. Sukwattanasinitt and A. Ajavakom, Analyst, 2015, 140, 1886–1893 RSC.
  34. H.-Y. Chen, L.-W. Ruan, X. Jiang and L.-G. Qiu, Analyst, 2015, 140, 637–643 RSC.
  35. L. Lin, M. Rong, S. Lu, X. Song, Y. Zhong, J. Yan, Y. Wang and X. Chen, Nanoscale, 2015, 7, 1872–1878 RSC.
  36. J. Pan, F. Tang, A. Ding, L. Kong, L. Yang, X. Tao, Y. Tian and J. Yang, RSC Adv., 2015, 5, 191–195 RSC.
  37. Y. Long, H. Chen, H. Wang, Z. Peng, Y. Yang, G. Zhang, N. Li, F. Liu and J. Pei, Anal. Chim. Acta, 2012, 744, 82–91 CrossRef CAS PubMed.
  38. J. C. Sanchez, A. G. D. Pasquale, A. L. Rheingold and W. C. Trogler, Chem. Mater., 2007, 19, 6459–6470 CrossRef CAS.
  39. H. Xu, F. Liu, Y. Cui, B. Chen and G. Qian, Chem. Commun., 2011, 47, 3153–3155 RSC.

Footnote

Electronic supplementary information (ESI) available. See DOI: 10.1039/c5ra06101f

This journal is © The Royal Society of Chemistry 2015