Competitive biosorption of Cr(VI) and Zn(II) ions in single- and binary-metal systems onto a biodiesel waste residue using batch and fixed-bed column studies

Shanmugaprakash Muthusamy*a and Sivakumar Venkatachalamb
aDownstream Processing Laboratory, Department of Biotechnology, Kumaraguru College of Technology, Coimbatore 641 049, India. E-mail: sunbioin@gmail.com; Fax: +91 422 266 9406; Tel: +91 422 266 1100
bDepartment of Chemical Engineering, A.C. Tech, Anna University, Chennai-600 025, India

Received 3rd April 2015 , Accepted 13th May 2015

First published on 13th May 2015


Abstract

A feasible biosorption process for the removal of Cr(VI) and Zn(II) ions from single and binary solutions onto a defatted pongamia oil cake (DPOC) was investigated. The maximal biosorption capacities of Cr(VI) and Zn(II) ions in single metal solutions were found to be 166.60 mg g−1 and 123.45 mg g−1, respectively. Due to the internal competition effect, the biosorption capacity of Cr(VI) and Zn(II) ions in the binary system was reduced to 125.10 mg g−1 and 83.30 mg g−1, respectively. Experimental data were well described by Freundlich isotherm. Kinetic studies were also preformed and the rate kinetics was followed with pseudo-second order model. Thermodynamic parameters such as Gibbs free energy (ΔG°), entropy (ΔS°) and enthalpy (ΔH°), were estimated in both single and binary systems, which showed that biosorption on the DPOC was of exothermic nature. In the column study, biosorption of metals using single and binary solutions was fitted well by the Thomas model.

Introduction

Modern day scientific advancements have led to the release of huge quantities of aqueous effluents containing highly toxic pollutants such as heavy metals, dyes and radio-nucleotides into the environment. Also in recent years, water contamination due to heavy metals has been reported as a major concern. Chromium and zinc are among the widely employed heavy metals in several electroplating, leather, tanning, textile, dyeing and metal finishing industries.1 In aqueous water, chromium generally exists in two different oxidative forms (Cr(III) and Cr(VI)).2 Cr(VI) in particular possesses human toxicity properties causing skin irritation, lung cancer etc.3 Zinc at lower concentrations is an essential element for humans stimulating a number of biochemical reactions within the cell and it also plays a vital role in the immune system. However, higher concentrations of both chromium and zinc in the body elicits toxic effects.4 According to the U.S. Environmental Protection Agency (EPA), the permissible limits for Cr(VI) and Zn(II) ions in drinking water should not exceed 0.05 mg L−1 and 5.0 mg L−1.5

In recent years, many physical and chemical methods like adsorption, chemical electro coagulation, precipitation, filtration, electro-dialysis, membrane-based separation etc. have been employed for the removal of heavy metals from effluents.6 Despite different limitations such as high separation costs and problems related to residual metal sludge disposal, some of these techniques have been reported to be effective.7 Keeping in mind the contemporary scenario, the need to search for more optimal technologies involving local resources like plant-based agro-wastes for the removal of metals from effluents has arised.8 Biosorption is an active non-metabolic natural process based upon the capacity of biological materials to remove metals by employing methods of ion exchange, micro-precipitation, adsorption and coordination.9 Economic viability studies indicate that biosorption has greater advantages over other existing technologies such as ion exchange or activated carbon adsorption owing to the facts that biosorbents are economical, easily subjected to chemical surface modification leading to increased efficiency, exposed to lesser environmental interferences, capable of recovering precious metals and also easily adaptive to existing continuous systems.10 These biosorbents endow reductive and adsorptive characteristics on the different functional groups present on the surface. It is evident from existent literature that various agro-based bio-products have already been employed as low-cost biosorbents as observed in the cases of fertilizer industrial waste,11 orange peel waste,12 soya bean meal waste,13 tea factory waste,14 seaweed,15 Jatropha oil cake16 etc.

One of the major problems in demonstrating metal ion biosorption from industrial effluent is that it contains more than one metal ion in aqueous solution. Hence, it is necessary to focus on sorption of multi-component system.17 However, literature pertaining to simultaneous biosorption of Cr(VI) and Zn(II) using plant-based derivatives in multi-component systems is quite scarce. Therefore, the objective of the present study undertaken was to investigate the biosorption of Cr(VI) and Zn(II) ions onto DPOC from both single and binary metal solutions in batch as well as continuous systems. Related biosorption isotherms, kinetics and thermodynamics were studied in detail for a better understanding of metal adsorption characteristics. Finally, the structural and surface functional groups of the biosorbent (DPOC) were analysed using FTIR and SEM-EDAX.

Materials and methods

Preparation of biosorbent and characterization

Pongamia oil cake (POC) used in the study was sourced from local oil mills. The collected oil cakes were dried under the sun and impurities removed manually. The dried biosorbent was powdered using a mortar and pestle. The biosorbent was then sieved to obtain uniform sizes of 250 μm and further dried at 110 °C for 24 h in an oven. The resultant biosorbent was then defatted using hexane in a soxhlet extractor (model no. 212, Sigma Instruments Ltd., Chennai, India) to eliminate the residual oil present in the oil cakes. The defatted biosorbent (DPOC) stock was stored in air-tight containers for future experimental purpose.19 Fourier Transformed Infra red Spectroscopy (FTIR) analysis was performed using a Shimadzu spectrophotometer to identify various functional groups present on the surface of the DPOC preceding and following biosorption under different experimental conditions (KBr technique). Spectra in the range of 400–4000 cm−1 was recorded. For SEM and Energy dispersive X-ray analysis, samples were gold/carbon coated and vacuumed (10–15 minutes) for electron reflection prior to analysis using a JEOL-JSM 6400 scanning electron microscope.

Batch biosorption studies

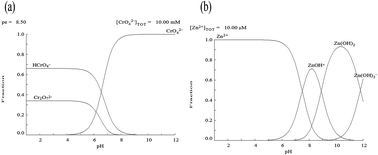
A stock solution (1000 mg L−1) of Cr(VI) and Zn(II) ions was prepared by dissolving appropriate quantities of potassium dichromate and zinc sulphate salts in suitable buffers to maintain a constant pH throughout the study. All the chemicals used in this research were of analytical reagent grade and purchased from Himedia Ltd., India. The speciation distribution of the heavy metal ions studied was calculated using the MEDUSA computer program developed by the Royal Institute of Technology (KTH), Sweden.18 The experimental procedure and conditions adopted were based on our previous study.19 To study the effect of pH, the pH of the solution was adjusted between 1.0 to 9.0 using 0.1 mol L−1 NaOH or 0.1 mol L−1 HCl accompanied by a pH meter (LI 120 Elico Ltd., Hyderabad, India). The pH experiments were conducted by maintaining 100 mL metal solutions of variable pH at 298 K for 120 min along with 0.6 g of DPOC. Isothermal and kinetic studies were also performed at 298 K. 0.6 g of DPOC was kept constant in 100 mL volumes of metal solutions of different concentrations (100–500 mg L−1) at different time intervals (0–240 min) at corresponding pH. Similarly, the binary metal solution experiments were performed as described above with the pH value optimized to 3.

Column biosorption studies

The fixed-bed studies were performed to assess the effect of flow rate and bed height on the biosorption of Cr(VI) and Zn(II) ions on the DPOC in both single and binary metal solutions. Column studies were carried out in a glass column (45 × 2.0 cm), filled with a known quantity of DPOC. In the column, 0.5 mm stainless steel mesh and 1.0 cm glass beads were kept at the bottom and the top, to support the biosorbent in the column and also to ensure a closely packed arrangement. A 2.0 cm high layer of glass beads (1.0 mm in diameter) was placed at the column base, in order to provide a uniform inlet flow of the solution into the column. The metal solution was pumped through a peristaltic pump (model no. 4651, Miclins, India) connected at the bottom of the column in an upward direction. The treated metal solution was collected from the top with the same flow rate as the feed stream and analysed for the metal concentration. All experiments were performed in duplicate at 298 K and pH 3.0 under room atmospheric pressure. The breakthrough curves were obtained by plotting the ratio of (C/Co) of metal concentration (C) at any time t to initial metal concentration (Co) versus time (t) at different flow rates.

Analytical methods

The residual Cr(VI) ion present in the supernatant was determined by DPC (1,5-diphenyl carbazide) method. The residual Cr(VI) ions were then determined from the standard calibration graph. The total chromium and Zn(II) ions concentration in the samples were estimated by using atomic adsorption spectroscopy (SL 159, Elico Ltd, Hyderabad, India).

The removal efficiency R (%) of metal ions was then calculated for each run as

 
image file: c5ra05962c-t1.tif(1)
where Co and Cf are the initial and the final concentrations of the metal ions present in the residual solution (in milligram per litre), respectively.4 The biosorption capacity (qe) of a biosorbent, which is obtained from the mass balance on the adsorbate in a system with solution volume V, is often used to acquire the experimental adsorption isotherms. Under experimental conditions, the adsorption capacities of the biosorbent for each concentration of metal ions at equilibrium were calculated as
 
image file: c5ra05962c-t2.tif(2)
where Co and Ce are the initial and equilibrium concentrations of metal ions (in milligram per litre) in the test solution, respectively. V is the volume of solution (in litre) and M is the mass of biosorbent (in grams) used for the experiment. For column studies, the volume of the effluent, Vef (in millilitre) was calculated using the following equation:
 
Veff = Qttotal (3)
where ttotal is total time (in minute) and Q is the volumetric flow rate of the metal solution inside the column (in millilitre per minute).

The total amount of metal solution that passes through the column (Mtotal) was calculated by

 
image file: c5ra05962c-t3.tif(4)
where Co is initial metal concentration (in milligram per millilitre), F is the volumetric flow rate (in millilitre per minute) and te is exhaustion time (in minute).14

The total removal of metal ions with respect to the flow volume was calculated as follows

 
image file: c5ra05962c-t4.tif(5)
where Mad is the concentration of the adsorbed metal ions, (in milligrams per litre).

Results and discussion

Speciation of metal ions in aqueous system

The speciation of aqueous metal ions significantly influences their interaction with the surface of the adsorbents.20 The theoretical distribution of the predominant chemical ions of Cr(VI) and Zn(II) in aqueous solution versus pH is represented in Fig. 1(a) & (b). It is found that at low pH, Cr(III) and Zn(II) species are present totally in ionic states while they precipitate as hydroxides at a high pH. From Fig. 1(a), Cr(III) species diagram, it is found that Cr(III) ions predominately exist at a pH of about 2.0, whereas Cr(OH)4 ions begin to form above pH 3.0. Between pH 2.0 and 4.0, the free cation concentration continuously decreases and insoluble hydroxide precipitates of Cr(OH)2+ begin to form. From pH 4.0 to 6.0, the amount of insoluble hydroxides increases while the concentration of the hydroxide complexes decreases.12 The Zn(II) species distribution is represented in Fig. 1(b) and the free cation Zn(II) is the predominant species upto pH 6.0 while the hydroxides Zn(OH)+ begin to form at higher pH values (pH > 6.0). Between pH 6.0 and 8.0, the concentration of hydroxide ions increases while the free cation decreases. Also at this stage, another hydroxide Zn(OH)3+ begins to form. At pH 8.0, the single hydroxide (Zn(OH)+) complex is prevalent accounting to a concentration of about 75% and the other hydroxide (Zn(OH)2) complex contributes about 25%.
image file: c5ra05962c-f1.tif
Fig. 1 Species distribution diagrams versus pH for (a) 10 mM potassium di chromate (b) 10 mM zinc sulphate.

pH dependence on Cr(III) and Zn(II) ion removal in single system

One of the prime factors affecting the biosorption of metal ions is pH of the solution, which influences surface charge of the biosorbent, the degree of ionization of the species present in the solution, the dissociation of functional groups on the active sites of biosorbent, and the solution metal chemistry.20 In the present work, the influence of pH on Cr(VI) and Zn(II) adsorption was studied by varying the pH of the solution from 2.0–7.0, while keeping all other parameters constant in single metal solution. In fact, considering the species distribution diagram (SDD) for Cr(VI), between pH 1 and 5, Cr(VI) occurs in solution as negative species: HCrO4 and Cr2O72−. In addition, at pH 2, the pH where the authors found the maximum adsorption of Cr(VI), the main chemical binding groups of the biomass surfaces are protonated.21 As a consequence, the surface of biosorbent will be surrounded by H+ ions which enhance the Cr(VI) interaction with binding sites of the biosorbent due to electrostatic forces.22,23 The results obtained by the authors are in agreement with similar results obtained by other authors.23,24 In the single system, the maximum Cr(VI) adsorption was obtained at an acidic pH of 2.0 which decreases with an increase in pH value as shown in Fig. 2. This is due to the surface charge of the DPOC which was more protonated under acidic pH and competitive negative metal ion adsorption takes place between positive surface and free chromate ions.25 In aqueous solution, Cr(VI) exists as HCrO4, Cr2O72−, at optimum sorption pH (pH > 2.0). Among those, the predominant form of hexavalent chromium at acidic pH is HCrO4, which arises from the hydrolysis reaction of the dichromate ion (Cr2O72−) and the increase in pH shifts the concentration of HCrO4 to Cr2O72− and other forms such as CrO4. Moreover, the optimum pH of total chromium removal from aqueous solution was also found to be 2.0.
image file: c5ra05962c-f2.tif
Fig. 2 Effect of pH on the biosorption of Cr(VI) and Zn(II) ions from single and binary solutions [initial metal concentration Co = 100 mg L−1 (single system), Co = (100 mg Cr(VI) + 100 mg Zn(II))/L (binary system) T: 298 K, biosorbent dosage: 6 g L−1, contact time: 300 min, agitation speed: 120 rpm].

However, in the case of Zn(II), the adsorption increased sharply with the increase in pH and attained the maximum at pH 4.0 and then decreased slowly. At low pH values the surface of the DPOC becomes more positively charged, reducing the attraction between Zn(II) ions and functional groups on the adsorbent. In contrast, higher pH results in facilitation of the metal biosorption, since the DPOC is more negatively charged. As the pH is increased to 4, more functional groups with a negative charge such as carboxyl or hydroxyl become exposed with a subsequent increase in attraction sites to positively charged ions (since pHZPC = 5.0), and thus enhances the biosorption capacity.16,26 The decrease in biosorption at a higher pH might be attributed to the speciation of other metal species, such as the occurrence of Zn(OH)3 ions as a result of the dissolution of Zn(OH)2. Similar results were also observed for the binary system. In the binary system, due to the high degree of competition on active site between the two metal ions, the biosorption capacities of Cr(VI) and Zn(II) were maximum at pH 3 and thereby gets decreased in higher pH. Also from Fig. 2, it was observed that Cr(VI) ions is the dominant species in binary mixtures at lower pH and maximal removal efficiency was attained for Cr(VI) ions compared to Zn(II) ions. Therefore, all biosorption experiments were performed at pH 2 and 4 for Cr(VI) and Zn(II) ions, respectively in single systems and for the binary system, an optimum pH of 3.0 was chosen for subsequent experiments.

Effect of metal ion concentration on single and binary components

Fig. 3 illustrates the time profiles of biosorption of Cr(VI) and Zn(II) ion in single and binary systems where the initial concentration of each metal ranges from 100–500 mg L−1 and adsorbent dosage of 6 g L−1. The biosorption of Cr(VI) and Zn(II) ions onto the DPOC is faster in the first 50 min and attains equilibrium in 60 min for both cases. From Fig. 3, it is concluded that the metal biosorption involves 2 phases; (i) a very rapid initial biosorption, followed by a long period of a much slower uptake. Similar kinetic behaviors can also been seen in a binary system where the sorption of Cr(VI) predominates that of Zn(II) ions. During the initial stage of biosorption, a large number of vacant active sites are available for biosorption of Cr(VI) and Zn(II). Moreover, the active sites almost get saturated with metal ions during initial stages of biosorption. Furthermore, the metal ions have to pass through farther and deeper into the pores exhibiting much resistance.27 This results in the reduction of biosorption rate during the late period of biosorption. A similar observation was also reported by Liu et al., (2009).20
image file: c5ra05962c-f3.tif
Fig. 3 Effect of contact time on the biosorption of Cr(VI) and Zn(II) ions from single and binary solutions [pH: 2.0 for Cr(VI) (single), 4.5 for Zn(II) (single) and 3.0 (binary), initial metal concentration Co = 100 mg L−1 (single system), Co = (100 mg Cr(VI) + 100 mg Zn(II))/L (binary system), T: 298 K, biosorbent dosage: 6 g L−1, contact time: 300 min; agitation speed: 120 rpm].

Effect of biosorption capacity on single and binary systems

An experimental study was carried out to investigate the effect in the biosorption capacity (qmax) for various single and binary systems. In single metal systems (Fig. 4(a)), the biosorption capacity of Cr(VI) and Zn(II) ions was found to vary from (18.63–70.11 mg g−1) and (15.93–57.03 mg g−1). However, in the binary system it was found that the individual biosorption capacity of Cr(VI) and Zn(II) decreases at every concentration range when compared with the single biosorption system (Fig. 4(b)). These results represent an inhibitory effect of the metal ions among them, thereby resulting in a lower sorption yield. However, the overall adsorption capacities of the adsorbent were higher as compared with the single sorption system. This is due to the saturation of different active sites that are favourable for different metals ions.17,25 In the single sorption system, Cr(VI) and Zn(II) ions could be adsorbed on the surface of the DPOC by internal competition (competition between ions of the same metals) and they were in competition with H+ for adsorption sites.27 But, in the binary system, there was an internal competition and competition among themselves for precipitation and for adsorption sites. In general, three possible types of biosorption behaviours are exhibited: (1) synergism (the effect of the mixture is greater than that of each of the individual adsorbates in mixture (qmin/qmax > 1)) (ii) antagonism (the effect of the mixture is less than that of each of the individual adsorbates in mixture (qmin/qmax < 1)) and (iii) non-interaction (the mixture has no effect on the adsorption of each of the adsorbates (qmin = qmax)). From Table 1, it is observed that the binary system of Cr(VI)–Zn(II) ions was found to be antagonistic. It has been said that in general, the greater the atomic weight, electronegativity, electrode potential and ionic size, the greater will be the affinity for sorption.28 It is evident from Table S1 that atomic radii and van der Waals radii are dominant factors for the biosorption of Cr(VI) ion onto the DPOC when compared with Zn(II) ions. The order of biosorption is Cr(VI) > Zn(II) onto the DPOC, was consistent with the physicochemical properties of metal ions under study. Thus, the binary biosorption of Cr(VI) ions is more competitive than Zn(II) ions in solution and those sorbed onto the surface of the DPOC. A similar observation was found by Anandkumar and Mandal (2012).25
image file: c5ra05962c-f4.tif
Fig. 4 Competitive biosorption of single and binary metal ions onto DPOC [reaction temperature: 298 K, pH: 2.0 for Cr(VI) (single), 4.5 for Zn(II) (single) and 3.0 (binary), biosorbent dosage: 6 g L−1; reaction time: 240 min [Cr(VI) and 180 min (Zn(II)].
Table 1 Biosorption isotherm parameters of metal biosorption in the single and binary system
Metal solution in single and binary system Langmuir Freundlich Temkin Halsey
Qo (mg g−1) b (L mg−1) qmin/qmax R2 KF ((mg g−1) (L mg−1)1/n) n (L mg−1) R2 bT (J mol−1) AT (L mg−1) R2 n KH R2
a Ref. 39.
Cr(VI) (qmax)a 166.6 2.65 × 10⁻³ 1.00 0.93 1.07 1.38 0.99 90.84 0.0387 0.96 1.38 1.25 0.99
Cr(VI) (with Zn(II) (qmin)) 125.10 1.06 × 10⁻³ 0.75 0.78 0.24 1.17 0.98 155.69 1.48 0.98 0.85 5.45 0.98
Zn(II) (qmax) 123.45 0.0122 1.00 0.88 5.8 1.96 0.97 22.54 5.9 0.88 1.96 31.52 0.96
Zn(II) (with Cr(IV) (qmin) 83.30 1.5 × 10⁻³ 0.67 0.90 0.29 1.27 0.99 187.57 0.764 0.98 0.79 4.82 0.99


Equilibrium modelling of isotherm for single and binary biosorption

To evaluate the designing of biosorption system, the equilibrium data of Cr(VI) and Zn(II) ion in both single and binary systems were analysed using Langmuir, Freundlich, Temkin and Halsey isotherms.

Langmuir isotherms assume that the adsorbed layer is a homogenous surface by monolayer sorption and all active sites are equal, resulting in equal energies and enthalpies of adsorption.29

The linearised form of Langmuir can be expressed as

 
image file: c5ra05962c-t5.tif(6)
where Ce is the equilibrium concentration of adsorbate (in milligrams per litre), qe is the amount of metal adsorbed per gram at equilibrium (in milligrams per gram), Qo is the maximum monolayer adsorption capacity (in milligrams per gram) and b is a constant relating the rate of the reaction (in litre per milligram). From Table 1, it is clear that the maximum sorption capacity for Cr(VI) and Zn(II) was 166.60 and 123.45 (in milligrams per gram) in the single sorption system and 125.10 and 83.30 (in milligrams per gram) in the binary sorption system, respectively. The decrease in the sorption capacity while using the binary system is due to the internal competition between the Cr(VI) and Zn(II) ions. Similar results have been reported by other researchers also.28

The Freundlich isotherm model proposes a multilayer sorption with a heterogeneous energetic distribution of active sites, accompanied by interaction between sorbed molecules.30 The general form of the model is represented as

 
image file: c5ra05962c-t6.tif(7)
where Kf stands for Freundlich constant related to adsorption capacity ((in milligrams per gram) (in litre per milligram))1/n and n stands for heterogeneous factor related to adsorption intensity. The Freundlich equation is expressed linearly as
 
image file: c5ra05962c-t7.tif(8)

The values of Kf and n were obtained from the linear plot of ln[thin space (1/6-em)]qe and ln[thin space (1/6-em)]Ce.

For Cr(VI) and Zn ions, the Freundlich values (n) are 1.38 and 1.17 in single and binary systems. According to Table 1, the adsorption of an adsorbate is favourable when n > 1.0. Our results clearly indicate that the DPOC can be effectively employed for the removal of Cr(VI) and Zn(II) ions from aqueous solution. Based on the Kf values, metal binding affinity of the DPOC was in the order of Cr(VI) > Zn(II) ion.

The Temkin isotherm model contains a factor that specifically takes into account only the adsorbent–adsorbate interactions by neglecting the extremely low and high values of concentration and it is assumed that, the fall in the heat of sorption is more linear than logarithmic, as implied in the Freundlich equation.31

The linearised form of Temkin equation is expressed by the following equation:

 
image file: c5ra05962c-t8.tif(9)
where R is the universal gas constant (8.314 J mol−1 K−1), T is the absolute temperature (in Kelvin), bT represents Temkin isotherm constants (in Joule per mol), AT represents Temkin isotherm equilibrium binding constant (in litre per gram). AT and bT were determined from the slope and intercepts of the plots obtained by plotting qe versus ln[thin space (1/6-em)]Ce and the calculated parameters at 303 K are listed in Table 1 for single and binary systems. Higher R2 values indicate the interaction between metals ions and DPOC.

The Halsey isotherm32 is usually used for multilayer adsorption systems and it is linearly expressed as

 
image file: c5ra05962c-t9.tif(10)
where kh and 1/n are the Halsey constant and exponent, respectively. The values of kh and 1/n were obtained by plotting ln[thin space (1/6-em)]qe and image file: c5ra05962c-t10.tif and the values are given in Table 1. The good linear fitting by higher correlation coefficients indicates the heteroporosity of DPOC.26 Based on the linear regression coefficient value (R2), the equilibrium data could well be interpreted by the Freundlich isotherms followed by Langmuir, Temkin and Halsey isotherms.

Biosorption kinetics

Kinetics is of paramount importance in determining the rate of adsorption and also in describing the solute uptake rate which reflects the resistance time of the adsorption process. In the present study, two kinetic models namely, the pseudo first-order and pseudo second-order models at different metal ion concentrations have been tested in order to predict the adsorption data of Cr(VI) and Zn(II) ions onto the DPOC as a function of time. Adsorption kinetics is expressed as the amount of metal adsorbed on the surface at equilibrium qe (in milligram per gram) and the fitness of the model is accredited by R2 value.

The pseudo first-order model assumes that a metal ion gets adsorbed on one active site of the sorbent surface and is represented by the following scheme:

 
image file: c5ra05962c-t11.tif(11)
where Ad is the active site present on the surface of the sorbent and it was proposed by Lagergren33 and is expressed as follows:
 
ln(qeqt) = ln[thin space (1/6-em)]qek1t (12)
where k1 is the rate constant (minutes−1), qe and qt are the amounts of metal ions adsorbed on the surface at equilibrium (in milligrams per gram) and at any time t (in minutes).

A plot of ln(qeqt) versus time was drawn, and the values of k1 and the calculated qe was determined from the slope and intercept respectively and values are given in Table 2.

Table 2 First-order kinetic constants of Cr(VI) and Zn(II) biosorption in single and binary system onto DPOC
Metal solution System Initial metal ion concentration (mg L−1) qe (exp) (mg g−1) qe (cal) (mg g−1) k1,Ad (minute−1) R2
Cr(VI) Single 100 47.86 46.85 0.0299 0.87
Cr(VI) + Zn(II) Binary 100 26.06 26.66 0.0251 0.88
Zn(II) Single 100 40.63 40.12 0.0483 0.84
Zn(II) + Cr(VI) Binary 100 22.57 23.27 0.0345 0.85


Similarly, the pseudo second-order model assumes that one metal ion is adsorbed onto two active sites, as represented by the following equation

 
image file: c5ra05962c-t12.tif(13)

Mathematical expression of second-order equation is given as follows:34

 
image file: c5ra05962c-t13.tif(14)
where, k2 (in gram per milligram per minute) is the pseudo second-order rate constant which was determined from the plot between t/qt against time. The pseudo first-order constant (k1), pseudo second-order rate constants (k2), the calculated qe values and the corresponding linear regression correlation coefficient values are listed in Table 2 and 3, for both Cr(VI) and Zn(II) ions, respectively. The value of R2 for the pseudo first-order kinetics for both Cr(VI) and Zn(II) ions indicates that this model had failed to predict the value of qe Meanwhile, the second-order kinetics could describe the adsorption of Cr(VI) and Zn(II) ions with high correlation coefficient (R2) highlighting that the rate-controlling mechanism is the chemical adsorption process, which is a complex in nature. Similar observation was observed by other researchers also.2,25,26

Table 3 Second-order kinetic constants of Cr(VI) and Zn(II) biosorption in single and binary system onto DPOC
Metal solution System Initial metal ion concentration (in milligram per litre) qe (exp) (in mg g−1) qe (cal) (in mg g−1) k2,Ad (g mg−1 min−1) R2
Cr(VI) Single 100 37.03 32.22 1.42 × 10⁻³ 0.99
Cr(VI) + Zn(II) Binary 100 18.18 16.27 2.99 × 10⁻³ 0.99
Zn(II) Single 100 30.025 21.27 1.036 × 10⁻³ 0.99
Zn(II) + Cr(VI) Binary 100 16.94 15.012 3.66 × 10⁻³ 0.99


Thermodynamic parameters of biosorption of Cr(VI) and Zn(II) in single and binary systems

Thermodynamic parameters explain the feasibility and spontaneous nature of the biosorption process. The thermodynamic parameter such as k value obtained from the Langmuir isotherm model was used to evaluate the standard Gibbs Free energy (ΔG°) parameters of each single and binary system for Cr(VI) and Zn(II) ions respectively. As depicted in Table 4, the changes in the negative values of ΔG° at all temperatures confirm the feasibility of the biosorption process and high affinity of single and binary adsorption onto the DPOC [293 to 323 K]. As the temperature increased, the values of Gibbs free energy decreased suggesting that better adsorption occurs at higher temperatures. This could be attributed to the interaction between the metal ions on the solid surface, the non-equal competition which attributes to the heterogeneity of adsorbent surface and the system gained energy from an external source at high temperatures.35 The enthalpy changes of the biosorption of Cr(VI) and Zn(II) ions (ΔH°) in single and binary systems onto the DPOC were found to be −16.747, 24.89, −34.22 and −39.63 (in kilo Joule per mole). As depicted in Table 4, the negative value of ΔH° suggests that the process is exothermic in nature and adsorption is possible through strong binding between single and binary systems of Cr(VI) ions and sorbent whereas positive ΔH° values indicates that the single and binary Zn(II) ions by the DPOC are endothermic. The positive values of ΔS° reflects the increased randomness at the adsorbate–adsorbent interface during the biosorption of Zn(II) ions in both single and binary systems.36 The order of biosorption heat of these heavy metal ions is as follows: binary Cr(VI) > single Cr(VI) and binary Zn(II) > single Zn(II) system. The biosorption of Cr(VI) with high enthalpy changes represents that the systems are very temperature-sensitive whereas the biosorption of Zn(II) in the binary system having low-enthalpy changes suggests that the systems are relatively temperature insensitive in nature.37
Table 4 Thermodynamic parameters of the Cr(VI) and Zn(II) ion biosorption in the single and binary system
Metal solution ΔH° (kJ mol−1) ΔS° (J mol−1 K−1) −ΔG° (J mol−1)
303 K 313 K 323 K
Cr(VI) single system −16.744 −45.178 2986.04 2763.32 2072.48
Cr(VI) (with Zn(II) ion) −34.22 −108.58 1349.38 181.19 18.89
Zn(II) single system 24.89 78.75 1007.03 299.1 570.91
Zn(II) (with Cr(VI) ion) 39.63 120.63 3298.02 1373.12 915.55


Fixed-bed column studies

The breakthrough curves are very important characteristics for determining and evaluating the sorbents for continuous treatment of the metal-laden effluents on an industrial scale operation. The breakthrough time (tb) shows the time at which the outlet metal concentration reached the initial concentration, and the exhaustion time (te) represents the time at which the outlet heavy metal concentration exceeded 95% of the inlet metal concentration. The breakthrough curves were obtained for the biosorption of Cr(VI) and Zn(II) ions onto the DPOC from single and binary solutions by varying the flow rate [(10, 15, and 20)] (in millilitre per minute) using a constant bed height (5 cm) and having inlet metal concentration of 100 mg L−1. From Table 5, it is clear that as the flow rate is increased, the metal adsorption capacity, the breakthrough and exhaustion time were reduced, for both single and binary systems. This may be due to the unavailability of a sufficient retention time for the heavy metal molecule within the bed at higher flow rates and the limited diffusivity of the solute into the sorptive sites or pores of the biomass.38,39 Slower flow rate is favoured, if intraparticle mass transfer controls the process and higher flow rate is favoured, if external mass transfer controls the process.35
Table 5 Column parameters for the Single and binary metal biosorption onto DPOC at 30 °C
Metal solution Flow rate (mL min−1) Uptake rate (mg g−1) tb (min) te (min) Thomas model constants
KTH × 10−5 (L mg−1 min−1) qo (mg g−1) R2
Cr(VI) single system 10 43.55 120 600 1.0 43.64 0.992
15 40.42 90 450 2.0 40.53 0.991
20 37.52 60 300 2.4 37.74 0.994
Cr(VI) (with Zn(II) ion) 10 30.14 100 510 1.1 30.75 0.972
15 28.88 75 360 2.3 28.92 0.981
20 28.14 40 270 2.3 28.16 0.995
Zn(II) single system 10 45.21 60 390 1.8 45.33 0.978
15 43.16 50 300 2.2 43.09 0.975
20 33.28 45 120 3.1 33.08 0.973
Zn(II) (with Cr(VI) ion) 10 34.25 45 280 2.6 34.12 0.982
15 28.65 30 270 2.9 28.12 0.992
20 22.58 30 240 3.5 22.30 0.975


The Thomas model40 is one of the widely applied models for continuous flow systems, which can be represented as

 
image file: c5ra05962c-t14.tif(15)

The Thomas model constants KTH and qo were determined by plotting image file: c5ra05962c-t15.tif versus time t, at a given flow rate. The Thomas model assumes Langmuir kinetics of adsorption–desorption, plug flow behaviour and second-order reversible reaction kinetics. The above model is suitable for adsorption processes where external and internal diffusion limitations are absent. From Table 5, it is observed that as the flow rate increases, the value of KTH was also increased which represents that the mass transfer resistance present on the surface of the DPOC could be decreased. The Thomas model gave good fit for the given experimental and theoretical data, at the flow rate examined and as presented in Fig. 5.


image file: c5ra05962c-f5.tif
Fig. 5 Breakthrough curves for the Biosorption of Cr(VI) and Zn(II) ions from single and binary solutions [flow rate = 1 mL min−1, inlet metal concentration Co = 100 mg L−1 (single system), Co = (100 mg Cr(VI) + 100 mg Zn(II))/L (binary system), bed height = 10 cm, pH = 3.0, biosorbent dosage = 13.45 g].

FT-IR and SEM-EDX analyses of biosorbent

FTIR analysis was used to describe the nature of the bonds present and allows the identification of different functional groups present on the surface of the DPOC. The FTIR spectra were plotted with wavenumber ranging from 400–4500 cm−1 in the x-axis and %transmittance on the y-axis (Fig. S1). The DPOC showed the typical bands attributing to cellulose, hemicellulose and lignin, which was indicative of the ligneous nature of DPOC. The prominent bands in the pristine DPOC were at 3425.56 cm−1 (O–H stretching vibration of cellulose), 2924.09 cm−1 (C–H stretching in lignin), 2854.65 cm−1 (C–H stretching in lignin), 2376.30 cm−1 (C–O stretch in primary alcohols), 1658.78 cm−1 (C–H stretch), 1442.75 cm−1 (O–H in plane bending), 1242.16 cm−1 (aromatic ring vibration), 1157.29 cm−1 (C–O–C asymmetrical stretching), 1026.13 cm−1 (C–O, C[double bond, length as m-dash]C, and C–C–O stretching), and 879.54 cm−1 (glycosidic linkage in hemicellulose).11 After biosorption of Cr(VI) and Zn(II) from both single and binary systems, there is a change in band intensity and frequency of the IR signals of some functional groups onto the DPOC. Shifts in the band position of 3425.58 cm−1, 2376.30 cm−1, 1242.16 cm−1, 1157.29 cm−1 and 879.54 cm−1 to 3410.15 cm−1, 2384.02 cm−1, 1249.21 cm−1, 1149.57 cm−1, 1018.41 cm−1 and 864.11 cm−1, respectively were indicative of Cr(VI) and Zn(II) ions binding to these functional groups during biosorption process.16 This may be due to the interaction between ionized functional groups present on the surface of the DPOC with protons or metal ions present in the aqueous solutions.25 Notably, the shift in 3425.58 cm−1 in Cr(VI)–Zn(II) adsorbed on the DPOC indicates the O–H group involvement in the metal binding through electrostatic interaction.

The SEM and EDAX micrographs of the pristine DPOC system, are as shown in Fig S2(a) and (b), respectively. The raw DPOC has a number of pores on the surface of DPOC which get decreased after treating with metal solution. This may be due to the significant possibility of the chromium and zinc ions adsorbed onto the pores and the remaining trapped Fig. S2(c). Energy dispersive X-ray (EDAX) analysis was carried out to evaluate the adsorption of Cr(VI) and Zn(II) ions onto the DPOC. EDAX spectrum for the pristine DPOC represents the presence of Cl, K, S and O in the structure but did not have any characteristic signal of Cr(VI) and Zn(II) ions on the surface of the raw DPOC (Fig. S2(b)). An EDAX spectrum was also recorded for the Cr(VI) and Zn(II) ions-adsorbed DPOC after treating with binary mixtures (100 mg L−1 of Cr(VI) and 100 mg L−1 of Zn(II)) solution (Fig. S2(d)). The EDAX spectrum gives characteristics peaks for both Cr(VI) and Zn(II) ions at 5.5 and 6.0 and 1.0 and 8.5, respectively, which confirms the binding of the Cr(VI) and Zn(II) ions to the surface of the DPOC.

Conclusions

In conclusion, we have utilised the DPOC as biosorbent to remove the Cr(VI) and Zn(II) ions from single and binary solutions in batch and continues mode. In batch system, the biosorption efficiency was greatly influenced by pH, dosage, time and temperature. The biosorption behaviour onto the DPOC was fitted well with the Freundlich isotherm and pseudo second-order kinetics models. Column experiments showed that the breakthrough time and exhaustion time decreased with an increasing flow rate. To the best of our knowledge, there have not been any reports concerning with biosorption of Cr(VI) and Zn(II) ions from binary system.

Acknowledgements

One of the authors (Shanmugaprakash M) is thankful to the management of Kumaraguru College of Technology, Coimbatore, Tamilnadu, India for having provided research facilities.

References

  1. S. A. Katz and H. Salem, The Biological and Environmental Chemistry of Chromium, VCH Publishers, Inc, New Jersey, USA, 1994 Search PubMed.
  2. M. Shanmugaprakash, S. Venkatachalam, J. PrasanaManikandaKartick and R. Nandusha, Environ. Sci. Pollut. Res., 2014, 1, 593–608 Search PubMed .
  3. H. J. Gibb, P. S. J. Lees, P. F. Pinsky and B. C. Rooney, Am. J. Ind. Med., 2011, 38, 115–126 CrossRef .
  4. U. K. Garg, M. P. Kaur, V. K. Garg and D. Sud, J. Hazard. Mater., 2007, 140, 60–68 CrossRef CAS PubMed .
  5. EPA, Cincinnati, US, 1990.
  6. J. Febrianto, A. N. Kosasih, J. Sunarso, Y. H. Ju, N. Indraswati and S. Ismadji, J. Hazard. Mater., 2009, 162, 616–645 CrossRef CAS PubMed .
  7. N. R. Bishnoi, M. Bajaj, N. Sharma and A. Gupta, Bioresour. Technol., 2004, 91, 305–307 CrossRef CAS .
  8. V. M. Nurchi and I. Villaescusa, Coord. Chem. Rev., 2008, 252, 1178–1188 CrossRef CAS PubMed .
  9. A. B. Albadarin, C. Mangwandi, G. M. Walker, S. J. Allen, M. N. M. Ahmad and M. Khraisheh, J. Environ. Manage., 2013, 114, 190–201 CrossRef CAS PubMed .
  10. B. Volesky, Sorption and biosorption, BV Sorbex, 2003 Search PubMed .
  11. V. K. Gupta, A. Rastogi and A. Nayak, J. Colloid Interface Sci., 2010, 342, 135–141 CrossRef CAS PubMed .
  12. V. Lugo-Lugo, C. Barrera-Diaz, F. Urena-Nunez, B. Bilyeu and I. Linares-Hernandez, J. Environ. Manage., 2012, 112, 120–127 CrossRef CAS PubMed .
  13. A. Witek-Krowiak and D. Harikishore Kumar Reddy, Bioresour. Technol., 2013, 127, 350–357 CrossRef CAS PubMed .
  14. E. Malkoc and Y. Nuhoglu, J. Hazard. Mater., 2006, 135, 328–336 CrossRef CAS PubMed .
  15. V. Murphy, H. Hughes and P. McLoughlin, Chemosphere, 2008, 70, 1128–1134 CrossRef CAS PubMed .
  16. S. Muthusamy, S. Venkatachalam, P. M. K. Jeevamani and N. Rajarathinam, Environ. Sci. Pollut. Res., 2014, 21, 593–608 CrossRef CAS PubMed .
  17. C. Mahamadi and T. Nharingo, Bioresour. Technol., 2010, 101, 859–864 CrossRef CAS PubMed .
  18. W. D. Schecher and D. C. McAvoy, Environmental Research Software, 2001 Search PubMed .
  19. M. Shanmugaprakash and V. Sivakumar, Bioresour. Technol., 2013, 148, 550–559 CrossRef CAS PubMed .
  20. C. C. Liu, M. K. Wang, C. S. Chiou, Y. S. Li, C. Y. Yang and Y. A. Lin, J. Hazard. Mater., 2009, 171, 386–392 CrossRef CAS PubMed .
  21. A. E. Martell and R. M. Smith, Critical stability constants of metal complexes database, US Department of Commerce, National Institute of Standards and Technology, Gaithersburg, MD, 2004 Search PubMed.
  22. K. Parvathi and R. Nagendran, Sep. Sci. Technol., 2007, 42, 625–638 CrossRef CAS PubMed .
  23. A. Özer and D. Özer, J. Hazard. Mater., 2003, 100, 219–229 CrossRef .
  24. M. D. Machado, H. M. V. M. Soares and E. V. Soares, Water, Air, Soil Pollut, 2010, 212, 199–204 CrossRef CAS .
  25. J. Anandkumar and B. Mandal, J. Chem. Eng., 2012, 7, 928–939 CAS .
  26. B. Kiran and A. Kaushik, Chem. Eng. J., 2008, 144, 391–399 CrossRef CAS PubMed .
  27. X.-F. Sun, S.-G. Wang, X.-W. Liu, W.-X. Gong, N. Bao and B.-Y. Gao, J. Colloid Interface Sci., 2008, 324, 1–8 CrossRef CAS PubMed .
  28. A. S. YesimBurak and T. Kutsal, Sep. Sci. Technol., 2002, 37, 279–309 CrossRef .
  29. I. Langmuir, J. Am. Chem. Soc., 1918, 40, 1361–1403 CrossRef CAS .
  30. H. M. F. Freundlich, J. Phys. Chem., 1906, 57, 1100–1107 Search PubMed .
  31. M. I. Temkin and V. Pyzhev, Acta Physicochim. URSS, 1940, 12, 217–222 Search PubMed .
  32. G. Halsey, Chem. Phys., 2004, 16, 931–937 Search PubMed .
  33. S. Lagergren, Kungliga Svenska Vetenskapsakademiens Handlingar., 1898, vol. 24, pp. 1–39 Search PubMed .
  34. Y. S. Ho and G. McKay, Process Saf. Environ. Prot., 1998, 76, 183–191 CrossRef CAS .
  35. N. Atar, A. Olgun, S. Wang and S. Li, J. Chem. Eng. Data, 2011, 56, 508–516 CrossRef CAS .
  36. Z. M. Aksu and F. Gonen, Sep. Purif. Technol., 2006, 49, 205–216 CrossRef CAS PubMed .
  37. G. L. Uslu and M. Tanyol, J. Hazard. Mater., 2006, 135, 87–93 CrossRef CAS PubMed .
  38. S. Qaiser, A. R. Saleemi and M. Umar, J. Hazard. Mater., 2009, 166, 998–1005 CrossRef CAS PubMed .
  39. M. Shanmugaprakash, V. Sivakumar, M. Manimaran and J. Aravind, Environ. Prog. Sustainable Energy, 2014, 33(2), 342–352 CrossRef CAS PubMed .
  40. H. C. Thomas, Chem. Soc., 1944, 66, 1664–1666 CrossRef CAS .

Footnote

Electronic supplementary information (ESI) available. See DOI: 10.1039/c5ra05962c

This journal is © The Royal Society of Chemistry 2015
Click here to see how this site uses Cookies. View our privacy policy here.