
Aminonaphthalimide-based pyridinium probes for selective fluorescence sensing of maltose in aqueous media and living cells†
De-Hui Wang*,
Zhe Gong,
Ran Sun,
De-Zhi Zhao and
Zhan-Xu Yang
College of Chemistry, Chemical Engineering and Environmental Engineering, Liaoning Shihua University, Fushun, 113001, China. E-mail: dhuiwang@aliyun.com
First published on 7th May 2015
Abstract
New aminonaphthalimide-based pyridinium podands as “turn-on” fluorescent probes were designed and synthesised for selectively sensing maltose in aqueous media and living cells.
The design of artificial carbohydrate sensors operating via non-covalent interactions remains a subject of research, due to their broad utility in wide-ranging applications from the food and cosmetic industries to medicinal and academic arenas.1 While advances in these areas have resulted from insightful intervention in biologically important recognition phenomena and have facilitated the development of therapeutic chemosensors, challenges still remain in developing probes for saccharides that meet the criteria necessary for applications in real-world settings.2 To realize the applications of these sensors in an industrial setting, their uses need to include the quality control of food and dietary products, and monitoring the fermentation of beverages and extracts.3 Also, they must be relatively easy to synthesize, operate at constant physiological pH in aqueous media, and target multiple saccharides and its derivatives with high selectivity.4
Difficulties in developing saccharide sensors also arise from the lack of a spectroscopic handle, such as a chromophore or fluorophore, whose modulation could be harnessed in a sensing scheme.5 While fluorescence sensing by means of reversible formation of covalent bonds from diol units and boronic acid has been relatively successful and exhibits good selectively between disaccharides,6 there are few effective systems for luminescence sensing of natural saccharides by using non-covalent bonds relevant to biological carbohydrate recognition.7 As a continuation of our research on the tripodal receptors,8 we herein report the syntheses and carbohydrate-binding properties of a new pyridinium-based receptor, in which a 1,8-naphthalimide fluorophore is incorporated onto pyridinium-based tripodands,9 in order to use fluorescence to discriminate natural saccharides in aqueous media. Interestingly, the green light region (λ ∼ 540–550 nm), with its high quantum yields (Φf),10 and visible-light excitation of aminonaphthalimide groups provided an opportunity to use luminescence to image natural saccharides in living cells.
TPAs were synthesized by the reaction of 4-(piperidin-1-yl)-N-(pyridin-3-yl)-1,8-naphthalimide with, respectively, two- and three-arm bromomethylbenzene derivatives, followed by an anion exchange reaction with NaB(C6H5)4. ESI-MS spectra of TPA1 (1 mM) exhibited an intense peak at an m/z of about 410.22, corresponding to the trivalent TPA1 receptor species, confirming the formation of the tripodal pyridinium-based receptor (see ESI†). 1H NMR spectra of TPA1 (1 mM) agreed well with the simulated chemical shifts. Interestingly, 2D NOESY of TPA1 exhibited significant cross peaks corresponding to H4–H7 and H5–H6 (Fig. 1), demonstrating the possible intramolecular and/or intermolecular stacking interactions between these 1,8-naphthalimide groups. But no obvious Nuclear Overhauser Effect (NOE) signal could be observed from the 2D NOESY spectra of TPA2 (Fig. S10, ESI†).
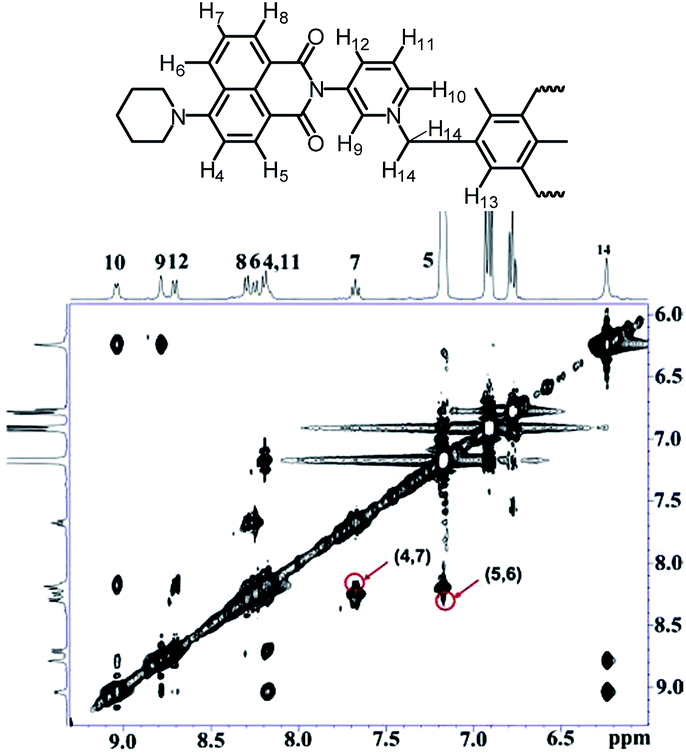 | ||
| Fig. 1 Partial 1H–1H NOESY spectrum of TPA1 (1 mM) in DMSO-d6 showing the possible intramolecular and/or intermolecular interactions between H4 and H7, H5 and H6 (marked in red circles). | ||
The TPAs exhibited a characteristic 1,8-naphthalimide absorption band centered at a wavelength of 425 nm (log![[thin space (1/6-em)]](https://www.rsc.org/images/entities/char_2009.gif) ε = 5.33) in a CH3CN:H2O (9:1/v:v) solution. Upon excitation at 468 nm, TPA2 and TPA1 exhibited emissions at 570 nm and 590 nm, respectively (Fig. 2). The higher energy band in the solution of TPAs was confidently ascribed to an aminonaphthalimide emission,11 whereas the obvious red-shift of the emission bands with an increasing number of arms might be attributed to the possible excimer emission caused by the intramolecular and/or intermolecular interactions of the luminophores (Scheme 1).12
ε = 5.33) in a CH3CN:H2O (9:1/v:v) solution. Upon excitation at 468 nm, TPA2 and TPA1 exhibited emissions at 570 nm and 590 nm, respectively (Fig. 2). The higher energy band in the solution of TPAs was confidently ascribed to an aminonaphthalimide emission,11 whereas the obvious red-shift of the emission bands with an increasing number of arms might be attributed to the possible excimer emission caused by the intramolecular and/or intermolecular interactions of the luminophores (Scheme 1).12
 | ||
| Fig. 2 Fluorescence spectra of TPA2 (30 μM) and TPA1 (20 μM) in a CH3CN:H2O (9:1/v:v) solution. Excitation at 468 nm. | ||
 | ||
| Scheme 1 Structures of TPA1 and TPA2. | ||
Upon addition of maltose to the solution containing TPA1 (20 μM), a fluorescence enhancement of the characteristic 1,8-naphthalimide emission was observed (Fig. 3). And the titration curve showed a steady and smooth increase until a plateau was reached (Φf = 0.15).13 The nonlinear fitting of the titration curve suggested a 2:3 stoichiometry of the host–guest complexation species with the association constant (logKass)14 calculated as 12.76 (Fig. S11, ESI†). Under the same conditions, no significant fluorescence enhancements of TPA1 were observed in the presence of a variety of tested saccharides (0.15 mM) (D-galactose, erythrose, mannose, fructose, xylose, glucose, lactose, sucrose, and maltose). These results suggest that TPA1 is a useful probe for the selective fluorescence sensing of maltose (Fig. 4).
 | ||
| Fig. 3 Emission spectra and visual change (insert) of TPA1 (20 μM) upon addition of different concentrations of maltose in CH3CN:H2O = 9:1 (v:v), up to 0.25 mM, excitation at 468 nm. | ||
 | ||
| Fig. 4 Fluorescence responses (576 nm) of TPA1 (20 μM) upon the addition of 0.2 mM of saccharides in a CH3CN:H2O (9:1/v:v) solution. Excitation at 468 nm. | ||
ESI-MS of TPA1 in the presence of maltose exhibited new peaks at m/z of about 524.66, 638.71 and 752.77, assignable to [TPA1 + Mal]3+, [TPA1 + 2Mal]3+ and [TPA1 + 3Mal]3+, respectively (Fig. 5), supporting the formation of a Mal–TPA1 host–guest complexation species. 1H NMR spectra of the receptor TPA1 (1 mM) upon addition of maltose (3 mM) exhibited small but significant downfield shifts of these hydroxyl protons (Fig. S10, ESI†), suggesting the possible interactions corresponding to these hydroxyl groups. Most importantly, besides the fluorescence enhancement of TPA1, the addition of maltose also caused a significant blue-shift (by about 15 nm) of the emission band, such that the emission spectrum of the Mal–TPA1 host–guest complex was quite similar to that of free TPA2 (Fig. 2). And no obvious changes of the emission spectrum of TPA2 were observed upon addition of maltose in the same conditions (Fig. S3, ESI†).
 | ||
| Fig. 5 Mass spectrum of TIA1 + nMaltose in a CH3CN:H2O (9:1/v:v) solution. | ||
From a mechanistic point of view, the fluorescence enhancement with the blue-shift is partly due to the absence of efficient intramolecular interactions between these 1,8-naphthalimide groups in this podand system.15 In fact, the disappearance of H4–H7 and H5–H6 NOE signals (Fig. S9, ESI†) in the 2D NOESY of TPA1 in the presence of maltose agrees well with this hypothesis. At the same time, the selectivity of the response with maltose over other saccharides was ascribed to the suitable locations of hydrogen bonds of TPA1 and the special stair-type conformation of maltose. Since the maltose binding did not change the absorbance spectra significantly (Fig. S2, ESI†), the maintenance of the emission wavelength with the significant luminescence enhancement possibly suggests a PET mechanism (Scheme 2).16
 | ||
| Scheme 2 Presumptive binding scheme showing the 2:3 stoichiometry of the host–guest complexation species of TPA1 with maltose. | ||
We further investigated the biological application of TPA1 in cultured cells (HeLa cells). HeLa cells incubated with TPA1 (10 μM) for 30 minutes at room temperature showed a weak yellow green intracellular fluorescence, which suggests that TPA1 can pass through cell membranes (Fig. 6a). The cells remained viable and no apparent toxicity and side effects were observed throughout the imaging experiments. When cells stained with TPA1 were further incubated with maltose (1 mM) in phosphate-buffered saline (PBS) for 30 minutes and washed, a remarkable enhancement of the green fluorescence intensity (Fig. 6b) and a long-wavelength blue-shift phenomenon (corresponding to the fluorescence titration) were observed, suggesting the successful application in the maltose stain experiments.
 | ||
| Fig. 6 Blue emission (485–550 nm) images of HeLa cells incubated with TPA1 (10 μM) (a) and their images after further incubation with maltose (1 mM) (b). | ||
Conclusions
In summary, we have reported TPA1 as a new type of chemical sensor for maltose. TPA1 exhibits a “turn-on” fluorescence property that is selective for maltose over other saccharides in aqueous media. Fluorescence, NMR and MS spectra demonstrated that the strong binding property may be an important factor influencing the fluorescence response to maltose. The sensor was also successfully applied to the imaging of cells containing maltose.Acknowledgements
This work was supported by the NSF of China (no. 201401093); Scientific Research Foundation for Doctors of Science and Technology Department of Liaoning Province (no. 20131063).Notes and references
- (a) Y. Ferrand, M. P. Crump and A. P. Davis, Science, 2007, 318, 619–622 CrossRef CAS PubMed; (b) A. P. Davis and T. D. James, Functional Synthetic Receptors, ed. T. Schrader and A. D. Hamilton, Wiley-VCH, Weinheim, Germany, 2005, pp. 45–110 Search PubMed; (c) M. Mazik, Chem. Soc. Rev., 2009, 38, 935–956 RSC; (d) N. E. Zachara and G. W. Hart, Chem. Rev., 2002, 102, 431–438 CrossRef CAS PubMed; (e) T. K. Lindhorst, Essentials of Carbohydrate Chemistry and Biochemistry, Wiley-VCH, Weinheim, Germany, 2000 Search PubMed; (f) S. Striegler, Curr. Org. Chem., 2003, 7, 81–102 CrossRef CAS.
- (a) J. Wongkongkatep, Y. Miyahara, A. Ojida and I. Hamachi, Angew. Chem., Int. Ed., 2006, 45, 665–668 CrossRef CAS PubMed; (b) L. Osterlund, I. Gustafson, I. Vikholm-Lundin, F. Winquist, L. Lading, J. Gran, R. Westvik, I. Svagard and D. Ausen, Foresight Biomedical sensors, Nordic Innovation Centre, Press, Norway, 1997 Search PubMed; (c) R. Jelinek and S. Kolusheva, Chem. Rev., 2004, 104, 5987–6015 CrossRef CAS PubMed.
- N. Y. Edwards, T. W. Sager, J. T. McDevitt and E. V. Anslyn, J. Am. Chem. Soc., 2007, 129, 13575–13583 CrossRef CAS PubMed.
- (a) A. P. Davis, Org. Biomol. Chem., 2009, 7, 3629–3638 RSC; (b) C. Nativi, M. Cacciarini, O. Francesconi, A. Vacca, G. Moneti, A. Ienco and S. Roelens, J. Am. Chem. Soc., 2007, 129, 4377–4385 CrossRef CAS PubMed; (c) A. Vacca, C. Nativi, M. Cacciarini, R. Pergoli and S. Roelens, J. Am. Chem. Soc., 2004, 126, 16456–16465 CrossRef CAS PubMed; (d) S. Jiang, J. O. Escobedo, K. K. Kim, O. Alpturk, G. K. Samoei, S. O. Fakayode, I. M. Warner, O. Rusin and R. M. Strongin, J. Am. Chem. Soc., 2006, 128, 12221–12228 CrossRef CAS PubMed; (e) N. Y. Edwards, T. W. Sager, J. T. McDevitt and E. V. Anslyn, J. Am. Chem. Soc., 2007, 129, 13575–13579 CrossRef CAS PubMed.
- Y. Liu, X. Wu, C. He, Y. Jiao and C. Duan, Chem. Commun., 2009, 7554–7556 RSC.
- (a) T. D. James, K. R. A. Samankumara Sandanayake and S. Shinkal, Nature, 1995, 374, 345–347 CrossRef CAS PubMed; (b) T. D. James, K. R. A. Samankumara Sandanayake and S. Shinkal, Angew. Chem., Int. Ed., 1996, 35, 1910–1922 CrossRef PubMed; (c) J. Zhao, M. G. Davidson, M. F. Mahon, G. Kociok-Kohn and T. D. James, J. Am. Chem. Soc., 2004, 126, 16179–16186 CrossRef CAS PubMed.
- (a) J.-M. Fang, S. Selvi, J.-H. Liao, Z. Slanina, C.-T. Chen and P.-T. Chou, J. Am. Chem. Soc., 2004, 126, 3559–3566 CrossRef CAS PubMed; (b) J.-H. Liao, C.-T. Chen, H.-C. Chou, C.-C. Cheng, P.-T. Chou, J.-M. Fang, Z. Slanina and T. J. Chow, Org. Lett., 2002, 4, 3107–3110 CrossRef CAS PubMed.
- (a) Y. Bai, B.-G. Zhang, C.-Y. Duan, D.-B. Dang and Q.-J. Meng, New J. Chem., 2006, 30, 266–271 RSC; (b) D. Wang, X. Zhang, C. He and C. Duan, Org. Biomol. Chem., 2010, 8, 2923–2925 RSC.
- (a) M. H. Filby, S. J. Dickson, N. Zaccheroni, L. Prodi, S. Bonacchi, M. Montalti, M. J. Paterson, T. D. Humphries, C. Chiorboli and J. W. Steed, J. Am. Chem. Soc., 2008, 130, 4105–4113 CrossRef CAS PubMed; (b) K. J. Wallace, W. J. Belcher, D. R. Turner, K. F. Syed and J. W. Steed, J. Am. Chem. Soc., 2003, 125, 9699–9715 CrossRef CAS PubMed.
- (a) E. B. Veale and T. Gunnlaugsson, J. Org. Chem., 2008, 73, 8073–8076 CrossRef CAS PubMed; (b) X. Guo, X. Qian and L. Jia, J. Am. Chem. Soc., 2004, 126, 2272–2273 CrossRef CAS PubMed.
- (a) D. Srikun, E. W. Miller, D. W. Domaille and C. J. Chang, J. Am. Chem. Soc., 2008, 130, 4596–4597 CrossRef CAS PubMed; (b) K. Hanaoka, Y. Muramatsu, Y. Urano, T. Terai and T. Nagano, Chem.–Eur. J., 2010, 16, 568–572 CrossRef CAS PubMed.
- (a) S. K. Kim, S. H. Lee, J. Y. Lee, J. Y. Lee, R. A. Bartsch and J. S. Kim, J. Am. Chem. Soc., 2004, 126, 16499–16506 CrossRef CAS PubMed; (b) W. Lu, M. C. W. Chan, N. Zhu, C.-M. Che, C. Li and Z. Hui, J. Am. Chem. Soc., 2004, 126, 7639–7651 CrossRef CAS PubMed; (c) A. Diez, J. Fornies, C. Larraz, E. Lalinde, J. A. Lopez, A. Martin, M. T. Moreno and V. Sicilia, Inorg. Chem., 2010, 49, 3239–3251 CrossRef CAS PubMed; (d) Z. Zhao, J.-H. Li, X. Chen, P. Lu and Y. Yang, Org. Lett., 2008, 10, 3041–3044 CrossRef CAS PubMed.
- (a) R. Parkesh, T. C. Lee and T. Gunnlaugsson, Org. Biomol. Chem., 2007, 5, 310–317 RSC; (b) T. Gunnlaugsson, A. P. Davis, J. E. O'Briena and M. Glynna, Org. Biomol. Chem., 2005, 3, 48–56 RSC.
- K. A. Connors, Binding Constants, John Wiley, New York, 1987 Search PubMed.
- (a) Z. Xu, N. Jiten Singh, J. Lim, J. Pan, H. N. Kim, S. Park, K. S. Kim and J. Yoon, J. Am. Chem. Soc., 2009, 131, 15528–15533 CrossRef CAS PubMed; (b) W. Lu, B.-X. Mi, M. C. W. Chan, Z. Hui, C.-M. Che, N. Zhu and S.-T. Lee, J. Am. Chem. Soc., 2004, 126, 4958–4971 CrossRef CAS PubMed; (c) K. Balakrishnan, A. Datar, W. Zhang, X. Yang, T. Naddo, J. Huang, J. Zuo, M. Yen, J. S. Moore and L. Zang, J. Am. Chem. Soc., 2006, 128, 6576–6577 CrossRef CAS PubMed; (d) A. Pietrangelo, M. J. MacLachlan, M. O. Wolf and B. O. Patrick, Org. Lett., 2007, 9, 3571–3573 CrossRef CAS PubMed; (e) T. Nguyen, R. Martel, P. Avouris, M. L. Bushey, L. Brus and C. Nuckolls, J. Am. Chem. Soc., 2004, 126, 5234–5242 CrossRef CAS PubMed.
- P. Jiang and Z. Guo, Coord. Chem. Rev., 2004, 248, 205–229 CrossRef CAS PubMed.
Footnote |
| † Electronic supplementary information (ESI) available: Experimental details and additional spectroscopic data. See DOI: 10.1039/c5ra05867h |
| This journal is © The Royal Society of Chemistry 2015 |