A triphenylamine-based colorimetric and “turn-on” fluorescent probe for detection of cyanide anions in live cells

Shaodan Wanga, Hai Xua, Qingbiao Yang*a, Yan Song*b and Yaoxian Lia
aDepartment of Chemistry, Jilin University, Changchun 130021, P. R. China. E-mail: yangqb@jlu.edu.cn; Fax: +86-431-88499576; Tel: +86-431-88499576
bCollege of Materials Science and Engineering, Jilin University of Chemical Technology, Jilin 132022, P. R. China. E-mail: songyan199809@163.com; Fax: +86-432-63083094

Received 1st April 2015 , Accepted 18th May 2015

First published on 18th May 2015


Abstract

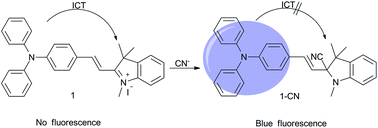
A colorimetric and “turn-on” fluorescent probe has been developed for the detection of cyanide anions. Cyanide was detected via the nucleophilic addition of cyanide to the indolium group of the probe, which resulted in a change from a purple colour to colourless and an enhancement in fluorescence. The probe showed a high sensitivity and selectivity for cyanide anions over other common anionic species in aqueous ethanol solution. The limit of detection was as low as 21 nM. A live cell imaging experiment demonstrated the practical value of this probe in tracing cyanide anions in biological systems.


1. Introduction

Anion recognition chemistry has received considerable attention as a result of the important role of these species in a wide range of biological, environmental and chemical applications.1 The cyanide anion (CN) is widely used in many industrial processes, including gold mining, electroplating, metallurgy and the resin industry.2 However, it is extremely toxic and can cause vomiting, convulsions, loss of consciousness and eventual death in humans.3 According to the World Health Organization, the maximum permissive level of cyanide in drinking water is as low as 1.9 μM.4 Therefore it is desirable to find efficient methods for the sensitive and selective detection of cyanide anions.

Various conventional methods based on spectrophotometric,5 electrochemical,6 voltammetric,7 titrimetric8 and other techniques9 have been developed for the quantitative determination of CN. However, as a consequence of their often complex and time-consuming nature and their reliance on instrumentation, the utilization of these methods is limited. A number of promising fluorescent probes and organic dyes have been constructed as optical sensors for CN.10 Among these, several sensor systems have been reported that involve the coordination of CN with metal ions,11 hydrogen-bonding interactions,12 boronic acid derivatives13 and deprotonation.14 Nucleophilic addition reactions of CN have also been used for sensing, including reactions with oxazine,15 pyrylium,16 indolium,17 pyridinium,18 acridinium,19 the dicyano-vinyl group,20 salicylaldehyde,21 trifluoroacetamide derivatives22 and other highly electron-deficient carbonyl groups.23 Despite their simple, inexpensive and convenient implementation, drawbacks still exist for most sensors. Some have high detection limits or display only moderate selectivity over other anions24 and, in some instances, cyanide cannot be detected in aqueous solution.25 Therefore colorimetric and fluorescent probes for CN in aqueous solution26 with a low limit of detection and high selectivity are still needed.

We report here a new fluorescent “turn-on” probe for the detection of CN in aqueous ethanol solution based on a triphenylamine–hemicyanine dye (Scheme 1). As its indolium 2-C atom is an effective target for nucleophilic addition, CN can easily combine with it, interrupting the conjugation between the indolium and aldehyde and resulting in spectrometric changes.27 On the addition of CN, the colour of the solution changed from purple to colourless, accompanied by an increase in the fluorescence, which achieved dual-channel sensing of CN. Importantly, probe 1 had a lower limit of detection28 and a higher selectivity29 than other reported probes.


image file: c5ra05807d-s1.tif
Scheme 1 Synthetic procedure and proposed cyanide-sensing mechanism of probe 1.

2. Experimental section

2.1. Materials and instruments

1,2,3,3-Tetramethyl-3H-indolium iodide and tetrabutylammonium salts were purchased from Sigma-Aldrich and used without further purification. 4-(Diphenylamino)benzaldehyde (compound 2) was prepared according to a previously reported procedure.30 Analytical-reagent grade materials and deionized water were used to prepare the solutions. Stock solutions of CN, F, Cl, Br and I were prepared from their tetrabutylammonium salts; NO3, HSO3, SCN, HPO42−, H2PO4, AcO, SO42−, HS and N3 were prepared by direct dissolution of the correct amount of the sodium salts. Aqueous Tris·HCl buffer (pH = 7.4, 10.0 mM) solution was used to maintain the pH of the test system.

1H-NMR and 13C-NMR spectra were measured on a Bruker AV-400 spectrometer. The absorption and fluorescence spectra were recorded on a Shimadzu UV 2100 PC UV-visible spectrophotometer and a Hitachi F-4500 fluorescence spectrometer, respectively. The pH values of the test solutions were measured with a glass electrode connected to a Mettler-Toledo Instrument DELTA 320 pH meter (Shanghai, China) and adjusted if necessary. All the measurement experiments were performed at room temperature.

2.2. Synthesis

2.2.1 Synthesis of (E)-2-(4-(diphenylamino)styryl)-1,3,3-trimethyl-3H-indol-1-ium iodide (probe 1). Probe 1 was conveniently prepared via the condensation of 4-(diphenylamino)benzaldehyde (2) with 1,2,3,3-tetramethyl-3H-indolium iodide (3) in ethanol. Compound 2 (0.828 g, 3.0 mmol), compound 3 (0.903 g, 3.0 mmol) and piperidine (0.3 ml, 3 mmol) were dissolved in 30 ml of ethanol. The reaction mixture was refluxed for 12 h under nitrogen with stirring. After cooling, the solid was collected, washed with anhydrous ethanol and then dried. The residue was purified by column chromatography on silica gel (CH2Cl2/ethanol, 20[thin space (1/6-em)]:[thin space (1/6-em)]1 v/v) to give 1 as a dark purple solid (1.25 g, yield 72.2%); 1H-NMR (400 MHz, CDCl3) δ 8.04 (dd, J = 18.8, 12.1 Hz, 3H), 7.62 (d, J = 15.8 Hz, 1H), 7.58–7.44 (m, 1H), 7.38 (t, J = 7.4 Hz, 4H), 7.26 (d, J = 4.6 Hz, 2H), 7.20 (d, J = 7.7 Hz, 4H), 7.01 (d, J = 8.4 Hz, 2H), 4.34 (s, 3H), 1.81 (s, 6H); 13C-NMR (101 MHz, DMSO) δ 181.27, 153.40, 152.71, 145.66, 143.61, 142.35, 133.42, 130.60, 129.34, 129.05, 126.92, 126.35, 123.28, 118.89, 114.99, 109.49, 52.06, 40.64, 40.43, 40.22, 40.02, 39.81, 39.60, 39.40, 34.54, 26.24; HRMS (positive mode, m/z): calculated 429.2325, found 429.5428 for [M + H]+.
2.2.2 Synthesis of (E)-2-(4-(diphenylamino)styryl)-1,3,3-trimethylindoline-2-carbonitrile (1-CN). The 1-CN product was conveniently synthesized via the condensation of 1 and 1.5 equiv. of (CH3CH2CH2CH2)4N(CN) in ethanol at room temperature and then purified by column chromatography on silica gel (CH2Cl2) (yield 80%). Note that the product is very unstable and will decompose when exposed to air. 1H-NMR (400 MHz, CDCl3) δ 7.34 (d, J = 7.8 Hz, 2H), 7.27 (t, J = 7.4 Hz, 4H), 7.17 (t, J = 7.6 Hz, 1H), 7.11 (d, J = 7.7 Hz, 4H), 7.06 (d, J = 5.4 Hz, 6H), 6.85 (t, J = 7.3 Hz, 1H), 6.59 (d, J = 7.8 Hz, 1H), 6.09 (d, J = 16.1 Hz, 1H), 2.78 (s, 3H), 1.53 (s, 3H), 1.19 (s, 3H); 13C-NMR (101 MHz, CDCl3) δ 148.68, 148.47, 147.35, 136.68, 135.65, 129.42, 129.06, 128.31, 127.90, 124.78, 123.44, 123.08, 121.81, 120.59, 120.31, 117.53, 108.89, 80.59, 77.40, 77.08, 76.76, 53.48, 49.14, 31.63, 24.56, 22.98; HRMS (positive mode, m/z): calculated 455.2361, found 456.2174 for [M + H]+.

2.3. Titration experiments of probe 1

Probe 1 was dissolved in ethanol to give a 1.0 mM stock solution, which was then diluted to 2 × 10⁻⁴ M. Tetrabutylammonium cyanide was dissolved in Tris·HCl buffer to give a 1.0 mM stock solution and then diluted to 10−4 M. We prepared a number of new solutions to give the titration spectra, in which each curve corresponds to a new independent solution. In this way, we were able to ensure that the real concentration of probe 1 was unchanged. The exact procedure was as follows: 0.1 ml of 2 × 10⁻⁴ M probe 1 solution was placed in a centrifuge tube and 1.5 ml of ethanol was added. Then a measured amount (x ml) of 10−4 M TBA cyanide solution and (2.4x) ml of Tris·HCl buffer were added. Finally, a solution of EtOH[thin space (1/6-em)]:[thin space (1/6-em)]Tris·HCl buffer = 4[thin space (1/6-em)]:[thin space (1/6-em)]6 (v/v) was used to adjust the total volume to 4.0 ml. Changes in the fluorescence intensity and absorption were recorded using a fluorescence spectrometer (λex = 345 nm, λem = 445 nm, slits 5 nm/2.5 nm) and a UV-visible spectrophotometer, respectively.

2.4. Test strip measurements

The test strips were prepared by immersing TLC plates (3 × 1 cm2) in the EtOH solution of probe 1 (1.0 mM) and drying in air. They were then exposed to various 1.0 mM solutions of individual anions.

3. Results and discussion

3.1. pH dependence of probe 1

We first investigated the effect of pH on the fluorescence spectra of probe 1 (5.0 μM). Fig. 1 shows that there was no apparent change in the fluorescence intensity at pH values < 3, regardless of the absence or presence of CN. This indicated that almost no reaction occurred between 1 and CN. This can be ascribed to the protonation of CN decreasing the actual concentration of CN in the sample solution. Between pH 5 and 10, 1 remained stable and responded to CN in a stable manner. However, at pH > 10, the fluorescent intensity of 1-CN decreased significantly. This could be attributed to the nucleophilic attack by OH on 1. The results indicate that 1 could be used to detect CN in a range of pH values (pH = 5–10). Considering the potential environmental and biological applications, we chose pH = 7.4 for the test system.
image file: c5ra05807d-f1.tif
Fig. 1 Fluorescence intensity at 445 nm of probe 1 (5.0 μM) in EtOH–H2O (4[thin space (1/6-em)]:[thin space (1/6-em)]6, v/v) in the absence and presence of CN measured as a function of pH. The pH was adjusted by dilute solutions of NaOH and HCl. λex = 345 nm, slits 5 nm/2.5 nm.

3.2. Absorption response of probe 1

The changes in the absorption spectra of 1 on titration with CN in an EtOH–Tris·HCl buffer solution (10.0 mM, pH = 7.4, 4[thin space (1/6-em)]:[thin space (1/6-em)]6, v/v) were recorded. Fig. 2 shows that probe 1 had a main absorption peak at 532 nm, which was ascribed to the typical intramolecular charge transfer (ICT) band of the triphenylamine–hemicyanine dye. The absorbance gradually decreased with increasing amounts of CN, with a new peak appearing at 345 nm until saturation after titration with 3.0 equiv. of CN.
image file: c5ra05807d-f2.tif
Fig. 2 Changes in the absorption spectra of 1 (5.0 μM) measured in EtOH–Tris·HCl buffer (10.0 mM, pH = 7.4, 4[thin space (1/6-em)]:[thin space (1/6-em)]6, v/v) with the addition of CN. Inset: colour change of probe 1 (5.0 μM) in the absence and presence of CN ((A), probe 1; (B), probe 1 with CN).

Simultaneously, an obvious change from a purple colour to colourless was clearly observed, suggesting that the ICT was turned off as a result of the nucleophilic attack of CN towards the indolium group of 1. The plot of (1 − A/A0), where A0 and A are the respective absorbance values at 532 nm in the absence and presence of CN, vs. the concentration was almost linear when the concentration of CN was in the range 2.5–11.5 μM (Fig. S7). There was a large colour change with CN (Fig. S8). Therefore this probe could potentially be used as a colorimetric probe for the detection of CN.

3.3. Fluorescence spectral titration of probe 1 towards CN

Fig. 3 shows the fluorescence titration of probe 1 (5.0 μM) with different amounts of CN (0–17.0 μM). The solution of probe 1 was almost non-emissive in the absence of CN. With the addition of CN, the fluorescence intensity at 445 nm gradually increased; the fluorescence intensity increased by almost 80 times when the concentration of CN reached 15.0 μM (Fig. 4A). A visible change in fluorescence from colourless to blue took place at the same time (Fig. S8).
image file: c5ra05807d-f3.tif
Fig. 3 Fluorescence spectra of 1 (5.0 μM) in the presence of different amounts of CN (from 0 to 17.0 μM) in EtOH–Tris·HCl buffer (10.0 mM, pH = 7.4, 4[thin space (1/6-em)]:[thin space (1/6-em)]6, v/v). Inset, photos of the solution of 1 (5.0 μM) in the (A) absence and (B) presence of CN (15.0 μM) under UV light (365 nm). λex = 345 nm, slits, 5 nm/2.5 nm.

image file: c5ra05807d-f4.tif
Fig. 4 (A) (I/I0 − 1) plots of probe 1 (5.0 μM) at 445 nm vs. concentration of CN, where I0 and I refer to the fluorescence intensity of an aqueous solution of 1 at 445 nm in the absence and presence of CN, respectively. (B) Linear relation between (I/I0 − 1) and the CN concentration in the range 3.5–12.5 μM.

The limit of detection (LOD) for probe 1 was also calculated based on the fluorescence titration. To determine the S/N ratio, the fluorescence intensity of 1 without CN was measured 10 times and the standard deviation of the blank measurements was determined to be 0.049. Under these conditions, [I/I0 − 1] varied almost linearly vs. the concentration of CN in the range 3.5–12.5 μM with R = 0.99692 (Fig. 4B). The LOD was then calculated with the equation:31 LOD = 3σbi/m, where σbi is the standard deviation of the blank measurements and m is the slope of [I/I0 − 1] versus the sample concentration. The LOD was 21 nM. This indicates that probe 1 was a highly sensitive fluorescent probe for CN.

3.4. Investigation of selectivity

Another important feature of probe 1 was its high selectivity towards CN over the other competitive anions. Changes in the absorption and fluorescence spectra of 1 (5.0 μM) were measured after the addition of CN and competitive species (including F, Cl, Br, I, NO3, SO42−, HS, AcO, N3, SCN, H2PO4, HPO42− and HSO3) in EtOH–Tris·HCl buffer (10.0 mM, pH = 7.4, 4[thin space (1/6-em)]:[thin space (1/6-em)]6, v/v). As shown in Fig. S9 and 5A, only the addition of CN resulted in a significant change in the UV-visible spectra and a large enhancement in the fluorescence. Colour changes visible to the naked eye also occurred. In contrast, other anions did not show any apparent interference (Fig. S10).
image file: c5ra05807d-f5.tif
Fig. 5 (A) Fluorescence spectra of 1 (5.0 μM) with various anions in EtOH–Tris·HCl buffer (10 mM, pH = 7.4, 4[thin space (1/6-em)]:[thin space (1/6-em)]6, v/v). (B) Variation in the relative fluorescence intensity at 445 nm of probe 1 (5.0 μM) in the presence of competitive anions (F, Cl, Br, I, NO3, SO42−, HS, AcO, N3, SCN, H2PO4, HPO42− and HSO3) and the fluorescence ratios of probe 1 (5.0 μM) to CN (3.0 equiv.) in the presence of 30 equiv. of the other competitive analytes. Black bar, 1 + anion; red bar, 1 + anion + CN. λex = 345 nm, slits, 5 nm/2.5 nm.

The detection of CN was also examined in the presence of competitive anions. The results showed that recognizable changes in the fluorescence signal were still observed after the addition of CN to the probe 1 solutions in the presence of various anions, indicating that the detection of CN using probe 1 in the presence of these interfering anions was still effective (Fig. 5B). The change in the fluorescence intensity of 1 was negligible after the addition of various metal ions (Fig. S11). All these investigations indicate that probe 1 was highly selectivity for CN.

3.5. Cyanide binding of probe 1

Scheme 1 shows that the sensing mechanism could be reasonably explained by the nucleophilic addition reaction of CN with the polarized C[double bond, length as m-dash]N bond of the indolium group. 1H-NMR spectra were used to examine this. Fig. 6 shows the 1H-NMR spectra of 1 before and after the addition of CN. All of the 1H-NMR signals were shifted up-field on the addition of CN. For example, the N-methyl protons (Ha) displayed an up-field shift from 4.34 ppm (3H, Ha) to 2.78 ppm (3H, Ha′). The singlet peak corresponding to protons in the two CH3 groups in probe 1 shifted from 1.81 ppm (6H, Hb) to 1.53 ppm (3H, Hb′) and 1.19 ppm (3H, Hb′′), forming two sets of singlet peaks. This observation clearly suggested the nucleophilic attack of CN on the indolium group of probe 1 and the formation of the 1-CN adduct, in which the electron-withdrawing character of the indolium group was weakened and, as a consequence, up-field shifts were generated. Job's plot (Fig. S13), evaluated from the fluorescence spectra, also proved the 1[thin space (1/6-em)]:[thin space (1/6-em)]1 binding stoichiometry between probe 1 and CN. In addition, the 1-CN adduct could be successfully separated; 1H-NMR, 13C-NMR and HRMS analysis further confirmed the structure (Fig. S2, S3 and S6).
image file: c5ra05807d-f6.tif
Fig. 6 1H-NMR spectra of probe 1 and 1-CN.

3.6. Theoretical calculations

To gain further insight into the mechanism of the colour fading and fluorescence enhancement of probe 1 in the presence of CN, density functional theory (DFT) calculations were carried out at the B3LYP/6-31G(d) level using the Gaussian 09 program package.32 The optimized structures of 1 and 1-CN are shown in Fig. S14. In probe 1, the indolium group was nearly coplanar with the phenyl unit via a conjugated bridge (–C[double bond, length as m-dash]C–), with a dihedral angle between them of 177.6°. With the interaction of 1 with CN, the coplanation was inhibited and the dihedral angle between the indole and phenyl groups of 1-CN changed to 91.8°. This structural difference gives rise to significant differences in the π-conjunction between 1 and 1-CN.

Detailed information about the changes on the formation of 1-CN was also obtained from time-dependent DFT (TD-DFT) calculations. The calculated molecular orbitals are shown in Fig. 7; the HOMO of 1 was delocalized, mainly onto the triphenylamine unit, while the LUMO was delocalized over the phenyl and indolium groups. In contrast, both the HOMO and LUMO of 1-CN were localized to only the triphenylamine unit. Therefore the decreased fluorescence intensity of 1 could be attributed to ICT from the triphenylamine unit to the indolium group. The nucleophilic addition of cyanide to the indolium group prevented ICT from occurring, resulting in enhanced fluorescence emission from the triphenylamine unit.


image file: c5ra05807d-f7.tif
Fig. 7 Calculated HOMO and LUMO distribution of 1 and 1-CN.

The calculated results of transitions with an oscillator strength > 0.1 are summarized in Fig. S15. The calculated absorption wavelengths of 1 and 1-CN were 526 and 357 nm, respectively, with oscillator strengths of 1.3456 and 0.7646. The TD-DFT calculations showed one transition at 486 nm with an oscillator strength of f = 0.0559, which corresponded to a HOMO–LUMO transition. The calculations were highly consistent with the experimental results, although the wavelength values were slightly overestimated.

3.7. Applications

To demonstrate the practical application of probe 1 in the detection of CN, test strips were prepared to determine the suitability of a “dip-stick” method. After immersion in an aqueous solution of CN, the plate quickly changed from purple to colourless. However, the variation in colour was not detected for the plates after interaction with aqueous solutions containing other anions (including F, Cl, Br, I, NO3, SO42−, HS, AcO, N3, SCN, H2PO4, HPO42− and HSO3) (Fig. S12). This demonstrated that probe 1 could be used for the rapid detection of CN.

Probe 1 was then used for imaging CN in cells to explore its potential biological applications. Living GES cells (human breast cancer cells) were first incubated with probe 1 (20.0 μM) for 30 min at 37 °C in a 5% CO2 atmosphere, then washed three times with phosphate-buffered saline (pH = 7.4) to remove any residual dye from the cells; CN (50.0 μM) was then added to the solution for another 30 min. The fluorescence images revealed that the GES cells loaded with probe 1 (20.0 μM) showed weak intracellular fluorescence (Fig. 8b). In contrast, the cells displayed a bright blue intracellular fluorescence (Fig. 8c) after the introduction of CN. This suggested that probe 1 had been successfully introduced into the cells and could be used to image CN in living cells. The living cell images also demonstrated that it could be a useful molecular probe for studying biological processes involving CN within living cells.


image file: c5ra05807d-f8.tif
Fig. 8 (a) Bright-field transmission image of GES cells. Fluorescence microscopic imaging of live GES cells with probe 1 (20.0 μM) (b) before and (c) after treatment with CN (50.0 μM) for 30 min.

4. Conclusions

We have successfully developed a new colorimetric and fluorescent probe for the detection of CN. The experimental results showed that probe 1 displayed both high sensitivity (LOD = 21 nM) and selectivity for CN in the presence of other anions. The sensing mechanism was well supported by DFT/TD-DFT calculations. Live cell imaging experiments showed that the probe could be used to visualize changes in the concentrations of intracellular CN in living cells. Probe 1 could also be developed as a simple paper test strip system for the rapid monitoring of CN. We expect that this new probe will have potential applications in the biological and environmental detection of cyanide anions.

Acknowledgements

We thank the National Natural Science Foundation of China (no. 21174052) and the Natural Science Foundation of Jilin Province of China (no. 20130101024JC) for their generous financial support.

Notes and references

  1. (a) V. Amendola, D. Esteban-Gomez, L. Fabbrizzi and M. Licchelli, Acc. Chem. Res., 2006, 39, 343–353 CrossRef CAS PubMed; (b) M. E. Jun, B. Roy and K. H. Ahn, Chem. Commun., 2011, 47, 7583–7601 RSC; (c) L. E. Santos-Figueroa, M. E. Moragues, E. Climent, A. Agostini, R. Martinez-Manez and F. Sancenon, Chem. Soc. Rev., 2013, 42, 3489–3613 RSC; (d) P. A. Gale, N. Busschaert, C. J. E. Haynes, L. E. Karagiannidis and I. L. Kirby, Chem. Soc. Rev., 2014, 43, 205–241 RSC.
  2. (a) G. C. Miller and C. A. Pritsos, Cyanide: Soc., Ind. Econ. Aspects, Proc. Symp. Annu. Meet., TMS, 2001, pp. 73–81 Search PubMed; (b) K. Kulig, Cyanide Toxicity, U. S. Department of Health and Human Services, Atlanta, GA, 1991 Search PubMed.
  3. (a) C. Baird and M. Cann, Environmental Chemistry, Freeman, New York, 2005 Search PubMed; (b) B. Vennesland, E. E. Comm, C. J. Knownles, J. Westly and F. Wissing, Cyanide in Biology, Academic Press, London, 1981 Search PubMed.
  4. Guidelines for Drinking-Water Quality, ed. J. K. Fawell, J. R. Hickman, U. Lurid, B. Mintz, E. B. Pike, H. Galal-Gorchev, R. Helmer, X. Bonnefoy and O. Espinoza, World Health Organization, Geneva, 1996 Search PubMed.
  5. (a) B. Deep, N. Balasubramanian and K. S. Nagaraja, Anal. Lett., 2003, 36, 2865–2874 CrossRef; (b) A. T. Haj-Hussein, Talanta, 1997, 44, 545–551 CrossRef CAS.
  6. (a) G. Ding, H. Zhou, J. Xu and X. Lu, Chem. Commun., 2014, 50, 655–657 RSC; (b) Y. G. Timofeyenko, J. J. Rosentreter and S. Mayo, Anal. Chem., 2007, 79, 251–255 CrossRef CAS PubMed.
  7. T. Suzuki, A. Hiolki and M. Kurahashi, Anal. Chim. Acta, 2003, 476, 159–165 CrossRef CAS.
  8. P. J. Anzenbacher, D. S. Tyson, K. Jursikova and F. N. Castellano, J. Am. Chem. Soc., 2002, 124, 6232–6233 CrossRef CAS PubMed.
  9. (a) F. J. Lebeda and S. S. Deshpande, Anal. Biochem., 1990, 187, 302–309 CrossRef CAS; (b) J. Ma and P. K. Dagupta, Anal. Chim. Acta, 2010, 673, 117–125 CrossRef CAS PubMed.
  10. (a) Z. Xu, X. Chen, H. N. Kim and J. Yoon, Chem. Soc. Rev., 2010, 39, 127–137 RSC; (b) F. Wang, L. Wang, X. Chen and J. Yoon, Chem. Soc. Rev., 2014, 43, 4312–4324 RSC.
  11. (a) W. Cao, X. Zheng, D. Fang and L. Jin, Dalton Trans., 2014, 43, 7298–7303 RSC; (b) M. G. D. Holaday, G. Tarafdar, B. Adinarayana, M. L. P. Reddy and A. Srinivasan, Chem. Commun., 2014, 50, 10834–10836 RSC; (c) X. Lou, Q. Zeng, Y. Zhang, Z. Wan, J. Qin and Z. Li, J. Mater. Chem., 2012, 22, 5581–5586 RSC.
  12. (a) X. Chen, S. Nam, G. Kim, N. Song, Y. Jeong, I. Shin, S. K. Kim, J. Kim, S. Park and J. Yoon, Chem. Commun., 2010, 46, 8953–8955 RSC; (b) Z. Dai and E. M. Boon, J. Am. Chem. Soc., 2010, 132, 11496–11503 CrossRef CAS PubMed.
  13. (a) S. Seo, D. Kim, G. Jang, J. Kim and T. S. Lee, Polymer, 2013, 54, 1323–1328 CrossRef CAS PubMed; (b) R. Tirfoin and S. Aldridge, Dalton Trans., 2013, 42, 12836–12839 RSC.
  14. (a) Y. Chung, H. Lee and K. H. Ahn, J. Org. Chem., 2006, 71, 9470–9474 CrossRef CAS PubMed; (b) S. Saha, A. Ghosh, P. Mahato, S. Mishra, S. K. Mishra, E. Suresh, S. Das and A. Das, Org. Lett., 2010, 12, 3406–3409 CrossRef CAS PubMed; (c) S. Kim, J. Y. Noh, S. J. Park, Y. J. Na, I. H. Hwang, J. Min, C. Kim and J. Kim, RSC Adv., 2014, 4, 18094–18099 RSC.
  15. M. Tomasulo, S. Sortino, A. J. P. White and F. M. Raymo, J. Org. Chem., 2006, 71, 744–753 CrossRef CAS PubMed.
  16. (a) F. Garcia, J. M. Garcia, B. Garcia-Acosta, R. Martinez-Manez, F. Sancenon and J. Soto, Chem. Commun., 2005, 2790–2792 RSC; (b) Y. Shiraishi, S. Sumiya and T. Hirai, Chem. Commun., 2011, 47, 4953–4955 RSC.
  17. (a) S. Goswami, S. Paul and A. Manna, Dalton Trans., 2013, 42, 10682–10686 RSC; (b) M. Sun, S. Wang, Q. Yang, X. Fei, Y. Li and Y. Li, RSC Adv., 2014, 4, 8295–8299 RSC.
  18. (a) S. H. Mashraqui, R. Betkar, M. Chandiramani, C. Estarellas and A. Frontera, New J. Chem., 2011, 35, 57–60 RSC; (b) J. Li, J. Gao, W. Xiong, P. Li, H. Zhang, Y. Zhao and Q. Zhang, Chem.–Asian J., 2014, 9, 121–125 CrossRef CAS PubMed.
  19. (a) P. Wang, Y. Yao and M. Xue, Chem. Commun., 2014, 50, 5064–5067 RSC; (b) Y.-K. Yang and J. Tae, Org. Lett., 2006, 8, 5721–5723 CrossRef CAS PubMed.
  20. (a) Y. Zhang, D. Li, Y. Li and J. Yu, Chem. Sci., 2014, 5, 2710–2716 RSC; (b) P. B. Pati and S. S. Zade, RSC Adv., 2013, 3, 13457–13462 RSC.
  21. M. K. Bera, C. Chakraborty, P. K. Singh, C. Sahu, K. Sen, S. Maji, A. K. Das and S. Malik, J. Mater. Chem. B, 2014, 2, 4733–4739 RSC.
  22. (a) Y. Duan and Y. Zheng, Talanta, 2013, 107, 332–337 CrossRef CAS PubMed; (b) H. Niu, D. Su, X. Jiang, W. Yang, Z. Yin, J. He and J. Cheng, Org. Biomol. Chem., 2008, 6, 3038–3040 RSC.
  23. (a) D. Kim, Y. Chung, M. Jun and K. H. Ahn, J. Org. Chem., 2009, 74, 4849–4854 CrossRef CAS PubMed; (b) H. Miyaji, D. Kim, B. Chang, E. Park, S. Park and K. H. Ahn, Chem. Commun., 2008, 753–755 RSC.
  24. N. Gimeno, X. Li, J. R. Durrant and R. Vilar, Chem.–Eur. J., 2008, 14, 3006–3012 CrossRef CAS PubMed.
  25. (a) J. H. Lee, A. R. Jeong, I. Shin, H. Kim and J. Hong, Org. Lett., 2010, 12, 764–767 CrossRef CAS PubMed; (b) S. Hong, J. Yoo, S. Kim, J. S. Kim, J. Yoon and C. Lee, Chem. Commun., 2009, 189–191 RSC.
  26. (a) S. S. Razi, R. Ali, P. Srivastava, M. Shahid and A. Misra, RSC Adv., 2014, 4, 22308–22317 CAS; (b) S. S. Razi, R. Ali, P. Srivastava and A. Misra, Tetrahedron Lett., 2014, 55, 1052–1056 CrossRef CAS PubMed; (c) S. S. Razi, R. Ali, P. Srivastava and A. Misra, Tetrahedron Lett., 2014, 55, 2936–2941 CrossRef CAS PubMed.
  27. C. Zhou, M. Sun, C. Yan, Q. Yang, Y. Li and Y. Song, Sens. Actuators, B, 2014, 203, 382–387 CrossRef CAS PubMed.
  28. (a) Y. Ding, T. Li, W. Zhu and Y. Xie, Org. Biomol. Chem., 2012, 10, 4201–4207 RSC; (b) H. Li, B. Li, L. Jin, Y. Kan and B. Yin, Tetrahedron, 2011, 67, 7348–7353 CrossRef CAS PubMed.
  29. (a) M. O. Odago, D. M. Colabello and A. J. Lees, Tetrahedron, 2010, 66, 7465–7471 CrossRef CAS PubMed; (b) H. Niu, X. Jiang, J. He and J. Cheng, Tetrahedron Lett., 2008, 49, 6521–6524 CrossRef CAS PubMed.
  30. Y. Yang, B. Li and L. Zhang, Sens. Actuators, B, 2013, 183, 46–51 CrossRef CAS PubMed.
  31. Y. Sun, S. Fan, L. Duan and R. Li, Sens. Actuators, B, 2013, 185, 638–643 CrossRef CAS PubMed.
  32. M. J. Frisch, G. W. Trucks, H. B. Schlegel, G. E. Scuseria, M. A. Robb, J. R. Cheeseman, G. Scalmani, V. Barone, B. Mennucci, G. A. Petersson, H. Nakatsuji, M. Caricato, X. Li, H. P. Hratchian, A. F. Izmaylov, J. Bloino, G. Zheng, J. L. Sonnenberg, M. Hada, M. Ehara, K. Toyota, R. Fukuda, J. Hasegawa, M. Ishida, T. Nakajima, Y. Honda, O. Kitao, H. Nakai, T. Vreven, J. A. Montgomery Jr, J. E. Peralta, F. Ogliaro, M. Bearpark, J. J. Heyd, E. Brothers, K. N. Kudin, V. N. Staroverov, R. Kobayashi, J. Normand, K. Raghavachari, A. Rendell, J. C. Burant, S. S. Iyengar, J. Tomasi, M. Cossi, N. Rega, J. M. Millam, M. Klene, J. E. Knox, J. B. Cross, V. Bakken, C. Adamo, J. Jaramillo, R. Gomperts, R. E. Stratmann, O. Yazyev, A. J. Austin, R. Cammi, C. Pomelli, J. W. Ochterski, R. L. Martin, K. Morokuma, V. G. Zakrzewski, G. A. Voth, P. Salvador, J. J. Dannenberg, S. Dapprich, A. D. Daniels, Ö. Farkas, J. B. Foresman, J. V. Ortiz, J. Cioslowski and D. J. Fox, Gaussian 09, Revision D.01, Gaussian, Inc., Wallingford C. T., 2009 Search PubMed.

Footnote

Electronic supplementary information (ESI) available: 1H NMR, 13C NMR and HRMS spectra of probe 1 and 1-CN; the plot of (1 − A/A0) at 532 nm vs. the concentration of CN; colour and florescence changes of probe 1 with the gradual addition of CN. Colour and fluorescence changes of probe 1 in the presence of CN and other anions; selectivity figure towards metal ions; photograph of the TLC plates towards carious anions; Job's plot of probe 1 and CN; DFT/TD-DFT calculated results. See DOI: 10.1039/c5ra05807d

This journal is © The Royal Society of Chemistry 2015
Click here to see how this site uses Cookies. View our privacy policy here.