Preparation and characterization of layered LiNi0.9Co0.05Mn0.025Mg0.025O2 cathode material by a sol–gel method for lithium-ion batteries

Daochuan Jianga, Li Zhao*a, Yanbin Shaob and Dianlong Wanga
aSchool of Chemical Engineering and Technology, Harbin Institute of Technology, Harbin, 150001, P. R. China. E-mail: dhx907@hit.edu.cn; Fax: +86 451 86413721; Tel: +86 451 86413721
bInstitute of Chemistry and Energy Material Innovation, Harbin Institute of Technology, Harbin, 150001, P. R. China. E-mail: irina2008@126.com; Fax: +86 451 86413751; Tel: +86 451 86413751

Received 31st March 2015 , Accepted 30th April 2015

First published on 30th April 2015


Abstract

LiNi0.9Co0.05Mn0.025Mg0.025O2 was prepared by a sol–gel method using citric acid as a chelating agent. Calcination temperature and calcination time played a critical role in the preparation of the materials, and their effects on the properties of the materials were discussed in detail. The optimal calcination temperature and time were determined to be 700 °C and 12 h, respectively. The sample prepared under the above optimal conditions had a well ordered hexagonal layered structure. The charge–discharge tests showed that the initial capacities of the sample were 201.0 mA h g−1 and 187.6 mA h g−1 at the discharge rate of 0.1 C and 1 C between 2.8 and 4.3 V, respectively. The capacity retention ratio was 99.3% at 0.1 C after 10 cycles and 91.86% at 1 C after 50 cycles. The excellent rate capability of the sample prepared at the optimal conditions was also observed.

1. Introduction

With the development of consumer electric devices such as mobile phones and laptops, power sources with high energy density and long cycling life are in urgent need. Conventional cathode materials for lithium ion batteries, such as LiCoO2, olivine LiFePO4 and spinel LiMn2O4, have better electrochemical performance,1–3 but they can not entirely meet such requirements. As a result, much more attentions have been focused on Ni-layered cathode materials due to their high specific capacity. Investigations of LiNi1−yCoyO2 (y ≤ 0.3) have been carried out.4–7 Considering the high price and remarkable capacity reduction of the reversible specific capacity induced by the substitution of Co, LiNi0.9Co0.1O2 with a capacity of about 200 mA h g−1 attracted the researchers' attention in spite of the obvious capacity fading with cycles in practical applications.8

In order to enhance the electrochemical performance as well as to lower the cost, introducing other cheaper metals, such as Mg, Al, Fe, Mn and Ti to partially substitute Co while remaining the content of Ni becomes an option.9–12 Kono firstly reported the cathode material of LiNi0.9Co0.05Mn0.025Mg0.025O2 with an initial capacity of 190 mA h g−1 and 80% capacity retention after 500 cycles at a 0.7 C charge and 1 C discharge rate in voltages ranging from 2.5–4.2 V, but the synthetic method was not yet published. According to G.R. Hu, LiNi0.9Co0.05Mn0.025Mg0.025O2 with a capacity more than 200 mA h g−1 at 0.2 C and good cycling performance can be synthesized by co-precipitation method,13 and similar studies was reported by Q. Liu and co-authors.8

It's known that the preparation method has significant effects on the electrochemical performance of the materials. To our knowledge, the sol–gel method offers several advantages, that is, a highly homogeneous polycrystalline material could be produced because of the molecular level mixing of the starting materials, and the lower temperature and shorter preparation time are required. The synthetic route of the sol–gel method is simple and straightforward compared with solid-state method. Therefore, in this work, LiNi0.9Co0.05Mn0.025Mg0.025O2 was firstly prepared via sol–gel method with citric acid as a chelating agent. The effects of calcination temperature and time on the structure, morphology and electrochemical performance of the materials were investigated systematically. The kinetic process of the material synthesized at optimal conditions was characterized and analyzed.

2. Experimental

2.1 Preparation of materials

The cathode material LiNi0.9Co0.05Mn0.025Mg0.025O2 was synthesized by sol–gel method using citric acid as a chelating agent. A stoichiometric amount of Ni(NO3)2·6H2O, Co(NO3)2·6H2O, Mn(NO3)2, Mg(NO3)2·6H2O was dissolved in 80 mL distilled water with 5% access of LiNO3, the solution was labelled as A. Citric acid was dissolved in 70 mL distilled water, and the solution was labelled as B. The mole ratio of citric acid to all the metal ions was 1.1[thin space (1/6-em)]:[thin space (1/6-em)]1. Solution B was dropwise added into stirring solution A. Thereafter, the pH value of the solution was adjusted using ammonia water and the solution was evaporated under continuous stirring at 60 °C until the viscidity green aquogel was formed. After drying at 120 °C in a drying oven overnight, the xerogel was crushed, subsequently heated at 550 °C for 5 h in air to decompose the organic constituents and nitrate components. The sample was then grounded, pelletized and calcined at different temperatures for various times followed by grounding for later use as the temperature cooled down to room temperature.

2.2 Performance measurements

Thermal decomposition behavior was studied by thermogravimetric analysis (TGA) in air at a heating rate 10 °C min−1. X-ray diffraction (XRD) was carried out on a D/max-rB X-ray diffractometer using Cu Kα radiation to identify the crystal morphology of the samples. XRD data was collected at 2θ between 20° and 90°, with a step size of 0.02° and a constant counting time of 0.3 s. The morphological features and particle sizes were characterized by a SU8000 scanning electron microscope.

The electrochemical measurements were conducted using CR2205-type coin cells at a discharge current of 0.1 C for low rate and a discharge current of 1 C for high rate at room temperature. A metallic lithium foil served as the anode electrode. The cathode electrode was composed of LiNi0.9Co0.05Mn0.025Mg0.025O2 active material, carbon black and polyvinylidene fluoride binder (the mass ratio is 80[thin space (1/6-em)]:[thin space (1/6-em)]10[thin space (1/6-em)]:[thin space (1/6-em)]10) dissolved in N-methylpyrrolidone (NMP), the slurry was then pasted on an aluminium foil, followed by drying at 120 °C overnight in a vacuum oven. The electrolyte solution was 1 M LiPF6 in a mixture of ethylene carbonate and diethyl carbonate at a volume ratio 1[thin space (1/6-em)]:[thin space (1/6-em)]1. Galvanostatic charge–discharge cycling was performed on a Neware battery testing system over a potential range between 2.8 and 4.3 V. It should be noted that a constant current constant voltage charge rule was used, the terminated current is 1.8 mA g−1. The cyclic voltammetric experiments were performed on a electrochemical workstation (CH Instrument 430) at a scan rate of 0.1 mV s−1.

3. Results and discussion

3.1 Thermal analysis of gel precursor

Fig. 1 presents the TGA curve of the gel precursor.
image file: c5ra05669a-f1.tif
Fig. 1 TGA curve of the citric acid–LiNi0.9Co0.05Mn0.025Mg0.025 gel precursor.

The weight loss in the range of room temperature to 200 °C is due to the removal of absorbed water or crystal water in the dried gel. The major weight loss occurred between 200 °C and 550 °C is attributed to the decomposition of organic constituents and nitrate components of the xerogel. The minor weight loss observed between 550 °C and 700 °C is due to the crystallization reaction. The weight loss occurred at temperatures higher than 700 °C might result from the removal of LiO and/or O from the crystal lattice, which is consistent with other literatures.14,15

3.2 Effects of calcination temperature on the characterization of the materials

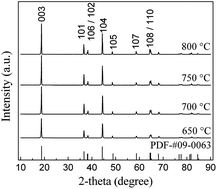
The XRD pattern was recorded to identify the structure of the materials obtained at different calcination temperatures. Fig. 2 shows the XRD patterns of the samples calcined at 650 °C, 700 °C, 750 °C and 800 °C, respectively. It can be clearly seen from Fig. 2 that the diffraction peaks are sharp, indicating the well crystallinity of the samples. All peaks can be indexed from PDF-#09-0063, suggesting a hexagonal α-NaFeO2 structure with R3m space group. As the calcination temperature was increased, all the peaks became more intensive and sharper, demonstrating the improvement in the crystalline nature of the sample at the higher temperature. The XRD patterns between 37.5° and 38.5° and between 63.5° and 65.5°, are compared as shown in Fig. 2(b) and (c), respectively. The (106)/(102) and (108)/(110) peaks clearly split for all samples, suggesting the high structure order of the samples.6,8,16 The lattice parameters of the samples are calculated and presented in Table 1. Generally, the c/a value is employed to examine a layered material, for example, the c/a value of the material with an ideal cubic close layered structure is over 4.899.11 In our work, the c/a values of the samples were 4.939, 4.941, 4.939, and 4.932, respectively, indicating the ideal hexagonal structure of the samples. It has been reported that the intensity ratio of I(003)/I(104) reflects the cation mixing degree of the layered structure.17 In general, the value of I(003)/I(104) over 1.2 is an indication of small cation mixing.18 As seen from Table 1, the values of I(003)/I(104) were larger than 1.3, indicating negligible undesired cation mixing is observed in these samples.
image file: c5ra05669a-f2.tif
Fig. 2 XRD patterns of LiNi0.9Co0.05Mn0.025Mg0.025O2 prepared at different temperatures for 12 h (a) with expanded views of the patterns in sections of 37.5°–38.5° (b) and 63.5°–65.5° (c).
Table 1 Lattice parameters of samples prepared at different calcination temperatures
Temperature (°C) a (Å) c (Å) c/a I003/I104 R-factora
a R-factor = (I006 + I102)/I101.
650 2.872 14.185 4.939 1.374 0.485
700 2.872 14.192 4.941 1.497 0.448
750 2.875 14.200 4.939 1.543 0.488
800 2.879 14.200 4.932 1.477 0.620


As the calcination temperature was increased from 650 °C to 750 °C, the values of I(003)/I(104) were gradually increased, which indicates that the cation mixing degree reduces with the increased calcination temperature. However, further increasing calcination temperature to 800 °C resulted in a reduced value of I(003)/I(104), which may be related to other changes in the fine structure.

Fig. 3 shows the SEM images of samples synthesized at different calcination temperatures. Remarkable changes can be found among these materials. For the material calcined at 650 °C as shown in Fig. 3(a), the powder particles size is about 300 nm. As the temperature was increased, the sizes of the powder particles were remarkably increased to about 5 μm at 800 °C, while the size distribution of the particles became uneven, which suggests that the higher calcination temperature induces the growth of the particles. Generally speaking, the larger particles may cause the diffusion difficulty of lithium-ions since the diffusion distance is longer. That could cause the capacity reduced especially in high charge and discharge rates.


image file: c5ra05669a-f3.tif
Fig. 3 SEM images of the samples calcined at 650 °C (a), 700 °C (b), 750 °C (c) and 800 °C (d).

Fig. 4 shows the initial discharge curves and cycling performance of LiNi0.9Co0.05Mn0.025Mg0.025O2 synthesized at different calcination temperatures at a discharge current of 0.1 C for low rate and a discharge current of 1 C for high rate at room temperature over a voltage range between 2.8 and 4.3 V, respectively. The electrochemical performance of LiNi0.9Co0.05Mn0.025Mg0.025O2 mainly relies on its structure and morphology. As mentioned above the calcination temperature influences the structure and morphology of LiNi0.9Co0.05Mn0.025Mg0.025O2. It's rational to assume that the calcination temperature is critical for the electrochemical performance of the material. In the case of 0.1 C rate, the samples calcined at 650 °C showed a first cycle discharge capacity of 128.4 mA h g−1 and a tenth cycle discharge capacity was 121.4 mA h g−1. The decreased capacity is attributed to the less ordering in lithium ions and transition metal ions, as supported by the XRD results. When the calcination temperature was increased to 700 °C, the material gave improved specific capacity of 201.0 mA h g−1 for the first cycle and 199.6 mA h g−1 for the 10th cycle, which may be due to the more layered structure, suitable particle size and narrow size distribution. When the calcination temperature was increased to 750 °C, the discharge specific capacity is decreased to 180.5 mA h g−1 for the first cycle and 170.0 mA h g−1 for the 10th cycle. Further increasing the calcination temperature to 800 °C led to a further decrease in the specific capacity, the main reason for this capacity fading can be attributed to the change of the fine structure since the R-factor increased dramatically from 0.448 to 0.620. The effects of the morphology on the performance should be also considered, the faster capacity fading at 1 C rate for the sample calcined at 800 °C could be due to the larger particles. The larger particles increase the distance of lithium ion diffusion pathways, as a result, more lithium ions can not effectively work at higher charge and discharge rate. According to the results, the optimal calcination temperature was 700 °C.


image file: c5ra05669a-f4.tif
Fig. 4 The initial discharge curves (a) and the cycling performance (b) of the samples at 0.1 C. The initial discharge curves (c) and the cycling performance (d) of the samples at 1 C.

3.3 Effects of calcination time on the characterization of the materials

The XRD patterns of the samples calcined for 6 h, 12 h and 18 h at 700 °C were shown in Fig. 5. The lattice parameters were calculated and given in Table 2.
image file: c5ra05669a-f5.tif
Fig. 5 XRD patterns of LiNi0.9Co0.05Mn0.025Mg0.025O2 prepared at 700 °C for different hours.
Table 2 Lattice parameters of samples prepared at different calcination time
Time (h) a (Å) c (Å) c/a I003/I104 R-factor
6 2.872 14.186 4.940 1.346 0.458
12 2.872 14.191 4.941 1.497 0.448
18 2.873 14.194 4.940 1.508 0.431


The XRD peaks of the samples calcined for 6 h were sharp and match well with PDF-#09-0063, which indicates that the material with high crystallinity and pure phase has been obtained. However, the I(003)/I(104) was lowest to be 1.346. As the calcination time was increased to 12 h, all the peaks became more intensive and sharper, which can be attributed to the higher crystallinity of the material. The value of I(003)/I(104) was increased to be 1.497, which means that less cation mixing occurred compared to the material calcined for 6 h. Further increasing the calcination time to 18 h, the value of I(003)/I(104) was increased slightly to be 1.508, which indicates a better hexagonal ordering in the material. The c/a values of these three samples are 4.940, 4.941 and 4.940, respectively, and all are larger than that of the ideal cubic close packing structure (4.899), indicating the good hexagonal ordering of the materials.

Fig. 6 shows the SEM images of samples calcined at 700 °C for different times. It can be seen that the calcination time has significant effects on the morphology of the samples. In the case of 6 h, the particles were small, and agglomeration phenomenon was observed. For the sample calcined for 12 h, the particles grew up. When the calcination time was increased to 18 h, the morphology of the sample changed obviously, serious agglomeration occurred.


image file: c5ra05669a-f6.tif
Fig. 6 SEM images of the samples calcined at 700 °C for 0 h (a), 6 h (b), 12 h (c) and 18 h (d).

The initial discharge curves and cycling performance of the material calcined for different times are shown in Fig. 7. It can be seen that the material calcined for 12 h exhibited a maximum initial discharge capacity of 201 mA h g−1 (0.1 C). The material calcinated for 6 h showed the discharge of 162.1 mA h g−1 for the first cycle and 148.2 mA h g−1 for the 10th cycle, which may owe to the higher cation mixing, as confirmed by the smaller value of I003/I104 in the XRD studies. When the calcination time was increased to 18 h, the first discharge capacity was 148.2 mA h g−1 and the tenth cycle discharge capacity was 140.4 mA h g−1, although the XRD studies showed a more layered structure. This poor performance, on one hand, can be attributed to the volatilized lithium due to prolonged heating;14 on the other hand, to the serious agglomeration as confirmed by the SEM observation which decreases the reversible lithium storage capacity. In the case of 1 C rate, similar phenomena were found. The first cycle discharge capacity was 144.0 mA h g−1 for 6 h, 187.6 mA h g−1 for 12 h, 132.1 mA h g−1 for 18 h and that of the 50th cycles was 106.3 mA h g−1, 172.3 mA h g−1 and 105.1 mA h g−1, respectively. The sample calcined for 12 h exhibited the outstanding capacity and cycling performance. Hence, taking the structure, morphology and electrochemical performance into consideration, the optimal calcination time is set to be 12 h.


image file: c5ra05669a-f7.tif
Fig. 7 The initial discharge curves (a) and the cycling performance (b) of the samples at 0.1 C. The initial discharge curves (c) and the cycling performance (d) of the samples at 1 C.

3.4 Electrochemical performance of the material prepared at optimized conditions

The rate performance of LiNi0.9Co0.05Mn0.025Mg0.025O2 prepared at 700 °C for 12 h was investigated between 2.8 and 4.3 V. The initial discharge curves of LiNi0.9Co0.05Mn0.025Mg0.025O2 at different charge–discharge rates (0.1 C/0.1 C, 0.2 C/0.2 C, 0.5 C/0.5 C, 1 C/1 C, 2 C/2 C) are shown in Fig. 8(a). It can be seen that the profiles were similar each other except the faster voltage drop with capacity fading at the higher C-rates, which can be attributed to the increased polarization of the electrodes at high current densities. The polarization increases with increasing current rate as a result of the reduced discharge time for lithium-ion intercalation into the crystal lattice, as only the surfaces of active materials participate in the reaction.11 Fig. 8(b) shows the rate capability of samples synthesized at 700 °C for 12 h. The curves demonstrated good rate capability when the C-rates increased from 0.1 C to 2 C, and excellent cycling performance was observed at each C-rate for five cycles. The similar phenomena were found when the C-rates decreased from 2 C to 0.1 C, however, the discharge capacity was reduced to 179 mA h g−1 with about 20 mA h g−1 loss during the cycles. The main reason for the capacity fading may result from the accumulation of lattice defects especially at a high charge and discharge rate, as well as the occurrence of irreversible structural phase transition which led to no enough sites for lithium ion intercalation.
image file: c5ra05669a-f8.tif
Fig. 8 Initial charge and discharge curves (a) and rate capability (b) of LiNi0.9Co0.05Mn0.025Mg0.025O2 synthesized at 700 °C for 12 h.

The cyclic voltammetry was carried out for LiNi0.9Co0.05Mn0.025Mg0.025O2 to evaluate the reaction progress during charge–discharge experiment. Fig. 9 shows the cyclic voltammetry curves of LiNi0.9Co0.05Mn0.025Mg0.025O2 electrode for initial three cycles. The profiles of the curves are similar except the positive scan for the first cycle, which can be attributed to the cation mixing. It's known that the cation mixing results in obvious irreversible capacity in the initial cycle, which corresponds to significantly reduced peak area in later cycle in the cyclic voltammetric curves. According to the literature,19,20 the peaks in the cyclic voltammetric curve demonstrate the phase transition along with lithium insertion and extraction. When two phases were coexisted, one peak can be observed. As seen from the Fig. 9, three couples of peaks were found during the charge–discharge process in the second and third cycle. It has been reported that the three peaks occurred in the positive scan correspond to the transition of hexagonal phase (H1) to monoclinic phase (M), monoclinic phase (M) to hexagonal phase (H2), hexagonal phase (H2) to hexagonal phase (H3), respectively.21 Generally, phase transitions may result in capacity fading due to the irreversible change of the structure. In our work, the sample synthesized at the optimal conditions exhibited excellent cycling performance, as confirmed by the almost overlapping cyclic voltammetric curves during discharge process. That could be explained by the existence of inactive Mn4+ and Mg2+ in the structure which stabilizes the crystalline structure to make the phase transition more reversible.


image file: c5ra05669a-f9.tif
Fig. 9 The cyclic voltammetric curves of the sample synthesized at the optimal conditions at a voltage ranging from 2.8 V to 4.3 V.

4. Conclusions

In summary, we have successfully synthesized well-ordered layered LiNi0.9Co0.05Mn0.025Mg0.025O2 by using citric acid assisted sol–gel method. The calcination temperature and time are critical for the preparation of the materials with good structure, morphology and the electrochemical performance. The electrochemical studies indicate that the material calcined at 700 °C for 12 h has the best performance, in terms of capacity, cycling performance and rate capability. In addition, cyclic voltammetric tests demonstrated that there are three reversible phase transitions involved in the charge–discharge process.

Notes and references

  1. D. Luo, G. Li, C. Yu, L. Yang, J. Zheng, X. Guan and L. Li, J. Mater. Chem., 2012, 22, 22233 RSC.
  2. S. J. Hu, Y. Li, F. Y. Lai, X. H. Zhang, Q. Y. Li, Y. G. Huang, X. M. Yuan, J. J. Chen and H. Q. Wang, RSC Adv., 2015, 5, 17592 RSC.
  3. Y. T. Xing, Y. B. He, B. H. Li, X. D. Chu, H. Z. Chen, J. Ma, H. D. Du and F. Y. Kang, Electrochim. Acta, 2013, 109, 512 CrossRef CAS PubMed.
  4. J. Cho, G. Kim and H. S. Lim, J. Electrochem. Soc., 1999, 146, 3571 CrossRef CAS PubMed.
  5. G. D. Park and Y. C. Kang, RSC Adv., 2014, 4, 44203 RSC.
  6. P. Periasamy, H. S. Kim, S. H. Na, S. I. Moon and J. C. Lee, J. Power Sources, 2004, 132, 213 CrossRef CAS PubMed.
  7. L. F. Xiao, Y. Y. Yang, Y. Q. Zhao, X. P. Ai, H. X. Yang and Y. L. Cao, Electrochim. Acta, 2008, 53, 3007 CrossRef CAS PubMed.
  8. Q. Liu, K. Du, H. W. Guo, Z. D. Peng, Y. B. Cao and G. R. Hu, Electrochim. Acta, 2013, 90, 350 CrossRef CAS PubMed.
  9. J. Cho, Chem. Mater., 2000, 12, 3089 CrossRef CAS.
  10. X. J. Zhu, H. H. Chen, H. Zhan, D. L. Yang and Y. H. Zhou, Mater. Chem. Phys., 2004, 88, 145 CrossRef CAS PubMed.
  11. K. Karthikeyan, S. Amaresh, G. W. Lee, V. Aravindan, H. Kim, K. S. Kang, W. S. Kim and Y. S. Lee, Electrochim. Acta, 2012, 68, 246 CrossRef CAS PubMed.
  12. P. Y. Liao, J. G. Duh and S. R. Sheen, J. Electrochem. Soc., 2005, 152, A1695 CrossRef CAS PubMed.
  13. G. R. Hu, Q. Liu, K. Du, Z. D. Peng, Y. B. Cao and W. M. Liu, Chin. J. Inorg. Chem., 2012, 28, 1171 CAS.
  14. R. Gover, R. Kanno, B. Mitchell, A. Hirano and Y. Kawamoto, J. Power Sources, 2000, 90, 82 CrossRef CAS.
  15. B. J. Hwang, R. Santhanam and C. H. Chen, J. Power Sources, 2003, 114, 244 CrossRef CAS.
  16. A. Rougier, P. Gravereau and C. Delmas, J. Electrochem. Soc., 1996, 143, 1168 CrossRef CAS PubMed.
  17. Y. M. Choi, S. I. Pyun and S. I. Moon, Solid State Ionics, 1996, 89, 43 CrossRef CAS.
  18. H. B. Ren, Y. R. Wang, D. C. Li, L. H. Ren, Z. H. Peng and Y. H. Zhou, J. Power Sources, 2008, 178, 439 CrossRef CAS PubMed.
  19. S. C. Park, Y. S. Hana, P. S. Lee, S. Ahn, H. M. Lee and J. Y. Lee, J. Power Sources, 2001, 102, 130 CrossRef CAS.
  20. X. R. Deng, G. R. Hu, K. Du, Z. D. Peng, X. G. Gao and Y. N. Yang, Mater. Chem. Phys., 2008, 109, 469 CrossRef CAS PubMed.
  21. W. Li, J. N. Reimers and J. R. Dahn, Solid State Ionics, 1993, 67, 123 CrossRef CAS.

This journal is © The Royal Society of Chemistry 2015
Click here to see how this site uses Cookies. View our privacy policy here.