DOI:
10.1039/C5RA05599G
(Paper)
RSC Adv., 2015,
5, 54338-54344
Detection of Staphylococcus aureus using acridine orange-doped silica nanoparticles as a fluorescent label†
Received
30th March 2015
, Accepted 8th June 2015
First published on 8th June 2015
Abstract
In this paper, a new type of core–shell fluorescent silica nanoparticles (NPs) carrying amino groups on the surface was designed and prepared by an inverse-microemulsion method using acridine orange (AO) as the dopant fluorophore. These NPs are monodisperse and possess a uniform diameter of ∼80 nm. The introduction of amino groups on the nanoparticles surfaces was proven by IR spectroscopy. Fluorescence studies indicate that the photostability of the NPs was improved compared to that of AO. A highly sensitive, simple and rapid counting approach for Staphylococcus aureus (S. aureus) was established by using the NPs as a fluorescent label. Fluorescence intensity and the total number of S. aureus are linearly correlated within the range of 103 to 107 cfu mL−1, and the limit of detection is 500 cfu mL−1. The recovery rate for a spiked sample ranged from 96.5% to 102.7%, and the RSD was lower than 7% (for n = 7). We presume that this method has a large potential for further applications to rapid analysis of pathogens.
Introduction
Detection of bacteria has played an important role in food safety, disease diagnosis, environmental monitoring and anti-bioterrorism.1,2 The common ways for bacteria detection include the flat colony counting method, multiple tube fermentation, the membrane filter technique and so on,3,4 but they can't meet the requirements of the current food safety monitoring due to their low sensitivity, time-consuming and laborious nature or discontinuities. Recently, various new assay methods for bacteria detection have been developed, such as enzyme-linked immunosorbent assay,5 polymerase chain reaction (PCR) measures,6 flow cytometry,7 and so on. But most of these methods have special requirements for equipment and personnel, need complicated procedures and high cost.8 However, fluorescence analysis is more favorable for rapid, technically simple, and efficient in detecting the total bacterial count from originals or pre-enriching samples. In particular, for high fluorescence intensity and optical stability, the fluorescent nanoparticles-based signal amplification has been frequently reported and utilized for improving detection sensitivity, which has injected new vitality to bacterial detection.9,10
Due to the non-toxicity and high chemical stability, silica played an important role in preparation of new nanomaterials. SiO2 based core–shell fluorescent nanoparticles can produce higher amplified optical signals than the single organic dye molecule. So, they could improve the analytical sensitivity greatly. Moreover, as a matrix material, silica was chemically and mechanically stable vehicle, which can protect the dye molecules from the harsh surrounding environment. As a result, both photobleaching and photodegradation of dye molecules were greatly reduced. Meanwhile, the flexible preparation provided versatile routes for the NPs modification with different types of functional groups and further used for bioconjugation.11–14 Compared with the traditional method using single light-emitting molecular as a marker, core–shell fluorescent nanoparticles integrated with advanced technologies can achieve incomparable performance for food bacteria testing. Mechery et al. used antibody modified RuBpy-doped silica NPs for E. coli O157:H7 quantify detection at single cell level owing to the higher fluorescence intensity of RuBpy-doped silica NPs.15 By using two kinds of silica nanoparticles, silica nanoparticles doped with FITC and Ru(bpy) and conjugated with respective antibodies were used by Rajendran group for simultaneous detection of S. Typhimurium and E. coli.16 Zhou et al. established an ultrasensitive method in which Cy3- and Cy5-doped Au/silica core–shell particles were prepared for two-color microarray detection of DNA.17 The detection limit was 1 pM, which was one magnitude lower than the results obtained by the commonly used methods. At the same time, the linear range was up to four orders of magnitude and the light stability was greatly improved because of the SiO2 shell. In generally, fluorescent silica nanoparticles showed great promising for food safety and environmental quality monitoring due to the higher sensitivity, biocompatibility and analytical efficiency.
Acridine orange compound was a kind of tricyclic aromatic cationic alkaline fluorescent dye, which is taken as the cell markers and widely used in cell detection.18,19 Because of its high toxicity, cells would be killed with small amount of it. Simultaneously, the fluorescent signal couldn't be identified at the low concentration. Moreover, photobleaching was another limit for acridine orange, and fluorescence spectrum and intensity were vulnerable influenced by solvents, pH, temperature and so on. Those factors also greatly limit its application in biomedical field.20 In order to avoid these deficiencies and limitations, we proposed the novel structure of acridine orange-doped silica nanoparticles applied for bacteria detection. There were few reports about core–shell acridine orange nanoparticles, only Liu et al. prepared orange-doped silica nanoparticles with 170 nm diameter for solution pH measurement.21
In this article, acridine orange-doped silica nanoparticles were prepared by encapsulating acridine orange (AO) into silica via a self-modified reverse-microemulsion method. The silica-coated AO nanoparticles were further modified with 3-aminopropyltrimethoxysilane (APTMS). Structure and fluorescence properties were characterized by transmission electron microscopy (TEM), scanning electron microscope (SEM), UV-Vis absorption/photoluminescence (PL), laser particle size analyzers, Fourier transform infrared spectroscopy (FT-IR) measurements. After the feasibility of the new type fluorescent label was investigated, it was applied as a fluorescent label for S. aureus detection and thus an efficient and quantitative detection method was developed.
Results and discussion
Design of acridine orange-doped silica nanoparticles and its labeling process for S. aureus
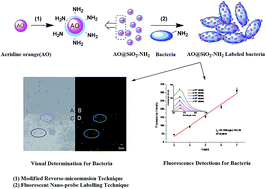
In order to overcome the shortcomings of AO in their bioanalytical application, such as toxicity, easy photobleaching, lower efficiency and so on, a novel acridine orange-doped silica nanoparticles was proposed in this paper, which were prepared by coating AO with silicon dioxide (Fig. 1). The silica shell could be easily modified with a variety of functional groups for further application in biochemical detection because of the existence of active groups. To facilitate bacterial detection, amine-modified nanoparticles were obtained by the amination reaction with the APTMS as an amination reagent, during which the –OH on the surface of SiO2 were replaced by –NH2. So as to avoid the agglomeration of nanoparticles, the methylphosphonate (THPMP) was introduced onto the surface of composite nanoparticles as an inert stabilizing group which could effectively decreased the aggregation of the nanoparticles by electrostatically interacting with the majority of amino groups.22 Multiple amine-modified nanoparticles could be easily bound to bacterium by glutaraldehyde, because there were many amine groups on the surface of bacteria.23
 |
| Fig. 1 Synthesis and coupling process of AO@SiO2–NH2 fluorescent nanoparticles with bacterial cells. (A) Encapsulation process of the W/O microemulsion; (B) three-dimensional network structure of silicon dioxide. | |
Characterization of AO@SiO2–NH2 nanoparticles
The AO@SiO2–NH2 nanoparticles were synthesized as mentioned in Experimental section. For reverse-microemulsion, cyclohexane served as continuous phase and TritonX-100 was surfactant. Before silica formation, surfactant interaction allowed AO to be encapsulated within the aqueous domains of the reverse-microemulsion, in which an independent “nanoreactor” was formed (Fig. 1A). The formation of silica was initiated by hydrolyzing TEOS at the oil/water interface catalyzed by ammonia and Brownian motion. The hydrolyzed silica species formed in the initial stage of the reaction were bound onto the surfaces of AO. Then, the silica layer grew in situ by polycondensation reaction and silica shell with three-dimensional network structure was formed (Fig. 1B), Moreover, the silica-shell thickness was alterable since it was influenced by TEOS concentration.24 TEM micrographs of the AO@SiO2–NH2 nanoparticles were shown in Fig. 2. The AO@SiO2–NH2 nanoparticles were monodisperse and have quite uniform diameter about 80 nm and with clearly core–shell structure.
 |
| Fig. 2 TEM image of AO@SiO2–NH2 nanoparticles. | |
Amino-modified AO@SiO2 nanoparticles were confirmed using the IR spectrum (Fig. 3). As was showed in Fig. 3b peak at 1072.42 cm−1 was the stretching vibrational absorption of Si–O–Si and the peak near 790.81 cm−1 was attributable to the bending stretching of Si–O–Si, all these confirmed the formation of SiO2 shell. The characteristic bands at 1650–1580 cm−1 and 3540–3125 cm−1 indicated the successful introduction of amino groups. Therefore, silica NPs were functionalized with desired molecules by providing the required functional groups on their surfaces. Furthermore, the zeta potential of silica NPs turned positive to 1.68 mV from −42.5 mV after amino was introduced (Table 1S†), which showed that the structure of silica NPs conformed to our designed requirements.
 |
| Fig. 3 FTIR spectra of AO (a) and amino silica-coated AO (b). | |
The changes of optical property about the AO with silica encapsulation were monitored by UV-Vis spectroscopy (Fig. 4A). The black line was absorption spectrum of AO in deionized water, and the red line belonged to AO@SiO2–NH2 in deionized water. It was illustrated that the absorption peak of the AO with silica encapsulation was more smooth. It might be due to the affect of the SiO2 shell on the surface of the designed nanostructure. According to the concentration of AO, the fluorescence spectra of AO@SiO2–NH2 nanoparticles and AO normalized was detected (Fig. 4C). A slight blue shift was observed for AO@SiO2–NH2 peak. The peak changed broaden a little and fluorescence intensity slightly reduced owing to silica gel ineffective absorption and scattering and the energy transfer after AO coated in the silica shell. In addition, the rotation of the dye molecules was restricted because of the bigger molecule structure when AO was coated in the silica three-dimensional networks.25,26 The decreased fluorescence intensity might be explained by blocking by the silica shell and the loss of fluorescent dyes in the process of preparation and surface treatment. Besides, AO would polymerize with a large concentration, during which the quantum yield of the encapsulated AO@SiO2–NH2 nanoparticles decreased. Beyond that, energy transfer produced between adjacent AO dye molecules (homo-FRET) because of the narrow Stokes shift, all of those gave arise to the fluorescence quenching.27,28 The photographs of AO@SiO2–NH2 nanoparticles under UV light and daylight were shown in Fig. 4B. AO@SiO2–NH2 nanoparticles (the emission wavelength was at 526 nm) exhibited bright green color under UV lamp.
 |
| Fig. 4 (A) UV-Vis spectrum of AO and AO@SiO2–NH2; (B) the photographs of AO@SiO2–NH2 NPs under UV light (a) and daylight (b); (C) excitation and emission spectra of AO (a and c) and AO@SiO2–NH2 (b and d) solutions. (D) Photostability of AO and AO@SiO2–NH2 solutions. | |
The prepared AO@SiO2–NH2 nanoparticles were washed and fluorescence value of the last supernatant was detected, the fluorescence signal was almost zero and this indicated that fluorescent signal of the AO@SiO2–NH2 was not caused by AO absorbed at the surface of the nanoparticles. The fluorescence decay of AO@SiO2–NH2 nanoparticles was markedly lower than the AO (Fig. 4D), when they were irradiated by UV light for the same time. In this case, silica shell of AO@SiO2–NH2 had a certain protective effect against AO fluorescent bleaching. Therefore, AO@SiO2–NH2 was of good fluorescent performance and conformed to design requirements.
Fluorescence microscope image and SEM image of the S. aureus coupled with AO@SiO2–NH2 nanoparticles
Firstly, the reaction between high concentrations of glutaraldehyde and amino groups on the surface of nanoparticles was completed. Then, removed excess glutaraldehyde by centrifugation, and a number of aldehyde groups on the surface of nanoparticles were free, which could further react with S. aureus, eventually nanoparticles were connected to S. aureus by vecarbon bridge.29 There were a lot of amino on the surface of bacteria, so it could be connected with multiple fluorescent nanoparticles. Moreover, this method could avoid the decrease of amino binding sites in the reaction process of bacteria and glutaraldehyde. Simultaneously, high concentration of glutaraldehyde could relieve the homo-coupling of nanoparticles. Under the conditions of the nanoparticles coupled with bacteria adequately, the fluorescent intensity of the measuring system increased with increasing of amount of bacteria. Therefore, the number of bacteria could be detected by the change of the fluorescent intensity.
In order to demonstrate that the AO@SiO2–NH2 nanoparticles were labeled to the S. aureus cells, fluorescent microscopy and SEM were employed and the fluorescent signals were displayed in Fig. 5. Bright fluorescence was observed under a fluorescent microscope (Fig. 5D). In contrast, the fluorescence signals of the S. aureus cells without addition of the glutaraldehyde were invisible in control experiments (Fig. 5B), It turned out the mechanism that the amino groups of AO@SiO2–NH2 and the surface of bacteria could effectively conjugated by glutaraldehyde. Moreover, it also showed the weak nonspecific binding of the prepared AO@SiO2–NH2. Compared with the unlabeled S. aureus (Fig. 5E), the SEM image of the S. aureus cell incubated with the NPs (Fig. 5F) indicated that many nanoparticles could bound to the single bacterial cell which resulted in significant luminescent amplification.
 |
| Fig. 5 Fluorescent microscope images and SEM images of S. aureus based on AO@SiO2–NH2 NPs labeling. (A and B) showed bright-field and fluorescence images of S. aureus cells treated with AO@SiO2–NH2 NPs without glutaraldehyde. (C and D) indicated bright-field and fluorescence image of S. aureus cells treated with AO@SiO2–NH2 and glutaraldehyde. (E and F) were the SEM images of S. aureus (E) and S. aureus bacterium coated with AO@SiO2–NH2 NPs (F), respectively. | |
Fluorescence detection of count of S. aureus
The assay sensitivity was evaluated using a series of S. aureus. As shown in Fig. 6, the photoluminescence (PL) intensity increased with the increasing concentration of S. aureus. An excellent linear relationship was obtained in the bacteria concentration ranging from 103 to 107 cfu mL−1, and the equation was IFL = 69.188
log(c) − 161.28 with a correlation coefficient of 0.9814 (S/N
3). The sensitivity of this proposed assay was 500 cfu mL−1, at least 10–20 times lower than plate count method, and an order of magnitude lower than previous organic fluorescent dye FITC labeled methods.30 In addition, compared with typical PCR method this proposed method had high sensitivity, simple operations and low cost.31 Meanwhile, comparison of different nanoparticle-based methods for bacteria detection as shown in Table 1, suggested our detecting exhibited good sensitivity and universality than previously reported detecting methods.
 |
| Fig. 6 Calibration of the fluorescence intensity vs. the total count of S. aureus, curves (a–e) are for S. aureus at concentrations from 103 to 107 cfu mL−1 (λEx = 480 nm). | |
Table 1 Comparison of different nanoparticle-based methods for determination of bacteria
Method |
Target bacteria |
Linear range |
Limit of detection |
Comments |
Ref. |
Au NPs |
E. coli O157:H7 |
106 to 5.0 × 10⁷ cfu mL−1 |
7.2 × 10⁵ cfu mL−1 |
Poor selectivity; higher cost |
32
|
FITC/SiO2; Ru(bpy)/SiO2 |
Salmonella; E. coli |
— |
105 cfu mL−1 |
Fluorescent turn-on probe; portable; point-of-care; poor selectivity |
16
|
FITC loaded silica coated Fe3O4 NP |
E. coli
|
103 to 107 cfu mL−1 |
103 cfu mL−1 |
Rapid (20 min for detection) |
33
|
Polyion complex micellar nanoparticles |
E. coli
|
— |
5.5 × 10⁴ cfu mL−1 |
Portable and inexpensive; poor selectivity |
34
|
AO@SiO2–NH2 |
S. aureus
|
103 to 107 cfu mL−1 |
500 cfu mL−1 |
Sensitive; simplicity in synthesis and low cost |
This work |
S. aureus in spiked milk sample was detected using this method (concentration of S. aureus in the spiked milk sample ranged from 102 to 107 cfu mL−1). Serial dilutions of S. aureus labeled with AO@SiO2–NH2 were respectively for quantitative analysis by RF-5301 Spectro-fluorometer. It still had a strong linear relationship between PL intensity and the total count of S. aureus in 103 to 107 cfu mL−1, which described as IFL = 39.510
log(c) − 66.835 (R2 = 0.9710) (Fig. 1S†). It was also illustrated that this method was accuracy for the bacteria detection, and satisfied results were obtained for the spiked samples detection.
The reliability and universality of the method was evaluated by seven spiked samples including three kinds of bacteria for fluorescence detection (Table 2). Results indicated that the recovery rate of this method was 96.5% to 102.7%, and RSD was lower than 7% (for n = 7). Furthermore, the developed method could be used to detect different bacteria, even mixed bacteria.
Table 2 Recovery rate and RSD for sample detectiona
Sample |
Original (cfu mL−1) |
Added (cfu mL−1) |
Found (cfu mL−1) |
Recovery (%) |
RSD (n = 7) (%) |
PBS: phosphate buffered saline.
|
S. aureus (PBS) |
1.0 × 10³ |
0 |
1.02 × 10³ |
102.7 |
6.01 |
S. aureus (PBS) |
1.0 × 10³ |
5.0 × 10² |
1.46 × 10³ |
97.3 |
5.13 |
S. aureus (PBS) |
1.0 × 10³ |
2.0 × 10³ |
2.90 × 10³ |
96.5 |
6.17 |
S. aureus (PBS) |
0 |
1.0 × 10³ |
9.84 × 10³ |
98.4 |
4.78 |
E. coli (PBS) |
1.0 × 10³ |
0 |
0.99 × 10³ |
99.0 |
4.03 |
Salmonella (PBS) |
1.0 × 10³ |
0 |
0.99 × 10³ |
101.0 |
5.96 |
Mixed bacteria (PBS) |
3.0 × 10³ |
0 |
3.11 × 10³ |
103.7 |
6.45 |
Experimental
Reagents and chemicals
Acridine orange (AO) was acquired from Sigma Aldrich. Tetraethoxysilane (TEOS), TritonX-100 (99%), 3-aminopropyltrimethoxysilane (APTMS), 3-(trihydroxysilyl)propylmethylphosphonate (THPMP) were purchased from J&K Chemical Ltd (Beijing, China). All chemicals and reagents used without further purification and of analytical grade (AR). The water was deionized, doubly distilled and sterilized.
S. aureus used in the experiment were provided by the College of Laboratory Medicine, Chongqing Medical University. Strains were transferred into Luria Bertani broth and incubated at 37 °C for 12 h prior to use. The initial concentration of each bacterial strain was obtained using the plate count method.
Apparatus
Fluorescence spectra were obtained by a Model RF-5301 Spectro-fluorometer (Shimadzu, Japan). The UV-Vis absorption spectra were obtained on a UV-2450 UV-Vis photo-spectrometer (Shimadzu Co.). The size and morphology of the AO@SiO2–NH2 were characterized using a JEM-1230 transmission electron microscopy (TEM, Japan, JEOL) and the FT-IR spectra of the prepared nanoparticles were collected by using a IRPrestige-21 Fourier transform infrared spectrophotometer (Shimadzu, Japan) in the KBr tableting method. A dynamic light scattering technique (Zetasizer Nano ZS90, Malvern) was used to determine the zeta potential of AO@SiO2–NH2 nanoparticles. Fluorescent signals were measured with an inverted fluorescence microscope (IX71, Olympus, Japan). The scanning electron microscope (SEM) images were obtained by a JEOL JSM-7800F field emission SEM system. The suspension of nanoparticles was prepared by an ultrasonic bath (KJ-300, Wuxi Kejie Electron Instruments Co. Ltd., China).
Synthesis of AO@SiO2–NH2 nanoparticles
Acridine orange-doped silica nanoparticles were prepared by the reverse-microemulsion method owing to its simple equipment, easy operation, controllable particle size and good dispersion, etc. The microemulsion consisted of a mixture of 7.50 mL cyclohexane, 1.77 mL TritonX-100, 1.80 mL n-hexanol, and 480 μL of a 8 × 10⁻³ M (ref. 21) acridine orange aqueous solution were added into the flask under vigorous stirring at room temperature. After thirty minutes equilibration period, 100 μL TEOS was added to the mixture and subsequently 60 μL ammonia solution (25 wt%) was introduced to initiate and catalyze the polymerization process. The reaction was undergoing for 24 h with stirring. Finally, 20 μL APTMS and 40 μL THPMP were injected into the reaction system for stirring for one more day. The resulting amine-functionalized AO@SiO2 nanoparticles were isolated from the microemulsion by adding 10 mL acetone into the above reaction system, followed by centrifuging at 8000 rpm for 5 min. Then, in order to remove the surfactants and other ingredients, they were washed with ethanol and pure water successively for several times. At last, the composite nanoparticles were placed under light-protected vacuum to dry at low temperature for further application.
Characterization of AO@SiO2–NH2 nanoparticles
Transmission electron microscopic (TEM) observations were carried out on a JEOL-2010 electron microscope operating at 200 kV for determining the sizes and morphology of AO@SiO2–NH2 nanoparticles. The prepared AO and AO@SiO2–NH2 nanoparticles were measured by an IRPrestige-21 infrared spectrophotometer using KBr pellets as the sample matrix. Fluorescence spectra and UV-Vis absorption spectra of AO, AO@SiO2–NH2 were obtained by RF-5301PC Fluorescence spectrometer and UV-2450 UV-Vis photo-spectrometer, respectively. The photostability of the prepared AO, AO@SiO2–NH2 was investigated by the constant illumination with a 356 nm wavelength ultraviolet lamp and every hour for determination by Fluoroskan Ascent FL.
AO@SiO2–NH2 coupled with bacteria for quantitative detection
5 mg of amino-group modified AO@SiO2 nanoparticles were dispersed into 1.0 mL deionized water containing 2% glutaraldehyde for about 2 h at room temperature. Then the nanoparticles were separated by centrifugation and washed with deionized water for three times. After the nanoparticles were re-dispersed in deionized water, they were further incubated with 107 cfu mL−1S. aureus solution for 12 h at 4 °C with shocking. After all of these steps, the S. aureus–nanoparticles conjugates were purified using ultrafiltration membrane (0.22 μm) to wash away the excess AO@SiO2–NH2 nanoparticles. Moreover, glutaraldehyde was not added into the reaction solution in contrast. S. aureus–nanoparticles conjugates were subsequently fixed and processed for scanning (SEM) by the methods of Chang et al.35
A serial of solution of AO@SiO2–NH2 labeled S. aureus (300 μL) were prepared by the above two approaches, suspended in deionized water with concentration of 102, 5 × 10², 103 to 107 cfu mL−1, respectively. And then their fluorescence intensity values were detected by fluorescence spectrophotometer. Finally, a standard curve of the logarithm of concentration and fluorescence intensity values was established.
Procedure for measuring S. aureus in spiked milk samples
S. aureus in different concentrations (102, 5 × 10², 103 to 107 cfu mL−1) was added to the treated aseptic milk samples purchased from a local supermarket. Firstly, these milk samples were left to centrifugate at least 10 min and filtered with a 0.45 μm filtration membrane. Then, the supernatant was diluted 1000 times.36 At last, the samples were treated as above mentioned to extract S. aureus target bacteria and further measure by this method.
Conclusions
The conclusions section should come in this section at the end of the article, before the acknowledgements. In this work, nanoparticles had been successfully prepared by self-modified inverse-microemulsion method. By modifying the surface of AO@SiO2 nanoparticles with amino groups and methylphosphonate groups, biologically functionalized and monodisperse silica composite nanoparticles were obtained. The prepared AO@SiO2–NH2 nanoparticles had good dispersion, better luminance, and good stability in detection of bacteria. Simultaneously, a highly sensitive, simple and rapid counting approach for S. aureus was established by using the NPs as a fluorescent label. The linear range of this fluorescence method was 103 to 107 cfu mL−1 and detection limit was down to 500 cfu mL−1. Furthermore, the amino-modified AO@SiO2 nanoparticles could conjugate with amines, thiols, and carboxyl groups, which would facilitate the linking of biomolecules. It was indicated that amino-modified silica fluorescent nanoparticles were hopeful to be applied in the field of biological labeling and detection.
Acknowledgements
This work was financially supported by the National Natural Science Foundation of China (nsfc: 21375156), Ministry of Science and Technology 863 Plan Projects (2015AA021104), the technologic research foundation project of Chongqing Science and Technology Committee [CSTC, 2012gg B1001] and the Key Project of Central University Basic Scientific Research Business Expenses (no. 106112015CDJZR225512).
Notes and references
- C. Signoretto and P. Canepari, Curr. Opin. Biotechnol., 2008, 19, 248–253 CrossRef CAS PubMed.
- J. Maukonen, J. Ind. Microbiol. Biotechnol., 2003, 30, 327–356 CrossRef CAS PubMed.
- I. Delalibera Jr, R. A. Humber and A. E. Hajek, Can. J. Microbiol., 2004, 50, 579–586 CrossRef PubMed.
- S. Seurinck, W. Verstraete and S. Sieiliano, Rev. Environ. Sci. Biotechnol., 2005, 4, 19–37 CrossRef CAS.
- I. Hochel, Food Agric. Immunol., 2007, 18, 151–167 CrossRef CAS.
- F. Salinas, D. Garrido, A. Ganga, G. Veliz and C. Martínez, Food Microbiol., 2009, 26, 328–332 CrossRef CAS PubMed.
- S. Duhamel, G. Gregori, F. van Wambeke, R. Mauriac and J. Nedoma, J. Microbiol. Methods, 2008, 75, 269–278 CrossRef CAS PubMed.
- F. Maruyama, N. Yamaguchi, T. Kenzaka, K. Tani and M. Nasu, J. Microbiol. Methods, 2004, 59, 427–431 CrossRef CAS PubMed.
- M. Vendrell, D. T. Zhai, J. C. Er and Y. T. Chang, Chem. Rev., 2012, 112, 4391–4420 CrossRef CAS PubMed.
- P. K. Mandal, A. K. Biswas, K. Choi and U. K. Pal, Am. J. Food Technol., 2011, 6, 87–102 CrossRef.
- Z. Z. Chen, L. Cai, X. M. Dong, H. W. Tang and D. W. Pang, Biosens. Bioelectron., 2012, 37, 75–81 CrossRef CAS PubMed.
- S. Y. Lee, J. Lee, H. S. Lee and J. H. Chang, Biosens. Bioelectron., 2014, 53, 123–128 CrossRef CAS PubMed.
- R. Ghosh Chaudhuri and S. Paria, Chem. Rev., 2012, 112, 2373–2433 CrossRef CAS PubMed.
- M. T. Hurley, Z. F. Wang, A. Mahle, D. Rabin, Q. Liu, D. S. English, R. Michael, Z. R. Zachariah, D. Daniel Stein and P. DeShong, Adv. Funct. Mater., 2013, 23, 3335–3343 CrossRef CAS.
- S. J. Mechery, X. J. J. Zhao, L. Wang, L. R. Hilliard, A. Munteanu and W. H. Tan, Chem.–Asian J., 2006, 1, 384–390 CrossRef CAS PubMed.
- V. K. Rajendran, P. Bakthavathsalam and B. M. J. Ali, Microchim. Acta, 2014, 181, 1815–1821 CrossRef CAS.
- X. Zhou and J. Zhou, Anal. Chem., 2004, 76, 5302–5312 CrossRef CAS PubMed.
- C. H. Liu, S. L. Sahoo and M. H. Tsao, Colloids Surf., B, 2014, 115, 150–156 CrossRef CAS PubMed.
- M. Manikandan and H. F. Wu, Photochem. Photobiol. Sci., 2013, 13, 1921–1926 Search PubMed.
- F. Gao, Q. Q. Ye, P. Cui, X. X. Chen, M. G. Li and L. Wang, Anal. Methods, 2011, 3, 1180–1185 RSC.
- J. S. Liu, L. J. Zang, Y. R. Yiru Wang and G. N. Liu, J. Lumin., 2014, 147, 155–158 CrossRef CAS.
- R. J. Wang, Y. Xu, Y. Jiang, N. Chuan, X. Su and J. G. Ji, Anal. Methods, 2014, 6, 6802–6808 RSC.
- Z. Q. Ye, M. Q. Tan, G. Wang and J. L. Yuan, Anal. Chem., 2004, 76, 513–518 CrossRef CAS PubMed.
- R. P. Bagwe, C. Y. Yang, L. R. Hilliard and W. H. Tan, Langmuir, 2004, 20, 8336–8342 CrossRef CAS PubMed.
- G. Wang, Q. Ma, W. C. Dou, S. Kanwal, G. N. Wang, P. F. Yuan and X. G. Su, Talanta, 2009, 77, 1358–1364 CrossRef PubMed.
- E. Rampazzo, S. Bonacchi, M. Montalti, L. Prodi and N. Zaccheroni, J. Am. Chem. Soc., 2007, 129, 14251–14256 CrossRef CAS PubMed.
- I. L. H. Jin and Y. H. Cho, J. Colloid Interface Sci., 2013, 395, 45–49 CrossRef PubMed.
- M. Darbandi, G. Urban and M. Krüger, J. Colloid Interface Sci., 2010, 351, 30–34 CrossRef CAS PubMed.
- M. Montalti, L. Prodi, N. Zaccheroni, A. Zattoni, P. Reschiglian and G. Falini, Langmuir, 2004, 20, 2989–2991 CrossRef CAS PubMed.
- X. L. Su and Y. B. Li, Anal. Chem., 2004, 76, 4806–4810 CrossRef CAS PubMed.
- F. Li, Q. Zhao, C. Wang, X. L. Lu, X. F. Li and X. C. Le, Anal. Chem., 2010, 82, 3399–3403 CrossRef CAS PubMed.
- C. C. Huang, C. T. Chen, Y. C. Shiang, Z. H. Lin and H. T. Chang, Anal. Chem., 2009, 81, 875–882 CrossRef CAS PubMed.
- L. Y. Chen, F. S. Razavi, A. Mumin, X. X. Guo, T. K. Sham and J. Zhang, RSC Adv., 2013, 3, 2390–2397 RSC.
- Y. M. Li, X. L. Hu, S. D. Tian, Y. Li, G. Z. Zhang, G. Y. Zhang and S. Y. Liu, Biomaterials, 2014, 35, 1618–1626 CrossRef CAS PubMed.
- Y. C. Chang, C. Y. Yang, R. L. Sun, Y. F. Cheng, W. C. Kao and P. C. Yang, Sci. Rep., 2013, 3, 1863 Search PubMed.
- A. C. Fernandes, C. M. Duarte, F. A. Cardoso, R. Bexiga, S. Cardoso and P. P. Freitas, Sensors, 2014, 14, 15496–15524 CrossRef PubMed.
Footnote |
† Electronic supplementary information (ESI) available. See DOI: 10.1039/c5ra05599g |
|
This journal is © The Royal Society of Chemistry 2015 |
Click here to see how this site uses Cookies. View our privacy policy here.