DOI:
10.1039/C5RA05598A
(Paper)
RSC Adv., 2015,
5, 37431-37439
Fast and selective determination of phenazopyridine at a novel multi-walled carbon nanotube modified ZnCrFeO4 magnetic nanoparticle paste electrode†
Received
30th March 2015
, Accepted 17th April 2015
First published on 17th April 2015
Abstract
In the present work, ZnCrFeO4 nanoparticles are synthesized via a sol–gel method. The resulting magnetic nanoparticles were characterized by field emission scanning electron microscopy (FE-SEM), X-ray diffraction (XRD) and Fourier transform infrared spectroscopy (FT-IR). Then, a novel phenazopyridine sensor was developed based on multi-walled carbon nanotubes modified with ZnCrFeO4 magnetic nanoparticles (MWCNTs/ZnCrFeO4/CPE). The modified electrode has a catalytic effect on the oxidation current of phenazopyridine and the oxidation mechanism was studied using cyclic voltammetry (CV), chronoamperometry and electrochemical impedance spectroscopy (EIS). Under the optimized chemical and instrumental conditions, the differential pulse voltammetry (DPV) response of the modified electrode toward phenazopyridine shows a linear concentration range from 0.3 to 625.0 μmol L−1 with a detection limit (3σ) of 0.02 μmol L−1. The proposed method was examined as a selective, simple and precise method for voltammetric determination of phenazopyridine in real samples with satisfactory results.
1. Introduction
Nanotechnology has become one of the most interesting disciplines in science and technology today. The growing advances in nanotechnology are being driven by various interesting fields and are contributing to a new industrial revolution. Carbon nanotubes (CNTs) are an important nanostructure that are used as building blocks of nanotechnology. With one hundred times the tensile strength of steel, thermal conductivity better than all but the purest diamond, and electrical conductivity similar to copper, but with the ability to carry much higher currents, they seem to be a very interesting material. Since their discovery in 1991,1 CNTs have generated great interest in future applications based on their field emission and electronic transport properties,2 their high mechanical strength3 and high conductivity.4 The modification of electrode substrates with CNTs for use in analytical sensing has been documented to result in low detection limits, high sensitivities, reduction of over-potentials, and resistance to surface fouling.5–9 Magnetic nanoparticles (MNPs) have also attracted a growing interest in the development and fabrication of sensors and biosensors. They exhibit the best performance at sizes of 10–20 nm due to supermagnetism, which makes them especially suitable when looking for a fast response, large surface area and high mass transference.10,11
Phenazopyridine is a heterocyclic aromatic azo compound that exerts an analgesic effect on the mucosa of the urinary tract and provides symptomatic relief of pain, burning, urgency, frequency and other discomforts arising from irritation of the lower urinary tract caused by infection, trauma, surgery, endoscopic procedures, or the passage of sounds or catheters.12,13 Phenazopyridine may cause side effects. The urine may turn a red-orange or brown. This is a normal effect and is not cause for alarm unless have other symptoms such as pale or yellowed skin, fever, stomach pain, nausea, and vomiting. Darkened urine may also cause stains to your underwear, which may or may not be removed by laundering. Therefore, development of highly sensitive analytical methods for determination trace amount of phenazopyridine is of great significance in clinical treatment. Several electrochemical methods have been proposed for the determination of phenazopyridine including polarography,14 voltammetry,15–21 amperometry,22 and gravimetry.23 Many of them are not enough sufficiently sensitive and/or are time consuming and/or used toxic materials.
To the best of our knowledge, no previous report was described using a carbon paste electrode modified with ZnCrFeO4 nanoparticles for the quantitation of bimolecular and drugs. In the present study, we described initially the preparation of spinel-type ZnCrFeO4 from salts of zinc, chromium and iron. Then, we have used voltammetric and electrochemical impedance spectroscopic techniques at pH 2.0 to demonstrate the electrochemical behavior of phenazopyridine on MWCNTs/ZnCrFeO4/CPE. The results showed that the detection limit, linear dynamic range, and sensitivity to phenazopyridine with MWCNTs/ZnCrFeO4/CPE are comparable to, and even better than, those recently developed which use voltammetric methods15–21 (Table 1).
Table 1 Comparison of figures of merit of the proposed method with recently published voltammetric methods for the determination of phenazopyridine
| Electrode |
Technique |
Limit of detection (μmol L−1) |
Linear rang (μmol L−1) |
Reference |
| Drop mercury electrode |
Differential pulse polarography |
0.3 |
0.32–4.0 |
14 |
| Drop mercury electrode |
Differential pulse polarography |
0.0001 |
0.004–0.08 |
15 |
| MgCr2O4–MWCNTS modified-glassy carbon electrode |
Differential pulse voltammetry |
0.025 |
0.05–7.5 |
17 |
| Carbon paste |
Square wave voltammetry |
0.07 |
0.2–2.5 |
19 |
| Poly p-aminobenzene sulfonic acid (p-ABSA) modified glassy carbon electrode |
Differential pulse voltammetry |
0.21 |
6–10 |
21 |
| Glassy carbon |
Amperometry |
0.8 |
0.4–120.0 |
22 |
| Ultra trace graphite electrode (UTGE) |
Differential pulse voltammetry |
0.00081 |
0.06–1 |
31 |
| MWCNTs/ZnCrFeO4/CPE |
Differential pulse voltammetry |
0.02 |
0.3–625 |
This work |
2. Experimental
2.1. Apparatus
All voltammetric measurements were carried out using an electrochemical system comprising the Metrohm instrument (Herisau, Switzerland), Model 797 VA and a conventional three electrode cell assembly containing an Ag/AgCl electrode as reference electrode, a platinum wire as counter electrode and the MWCNTs/ZnCrFeO4/CPE as working electrode. All of the potentials were measured and reported vs. Ag/AgCl reference electrode. The pH of the solutions was controlled with a Corning pH meter (model 146). The structure and morphology of the product were characterized by using XRD (Holland Philips Xpert, X-ray diffractometer with Cu-Kα radiation) and FE-SEM (Hitachi S-4160) with gold coating. FT-IR was recorded using a JASCO FT-IR (680 plus). The spectra of solids were obtained using KBr pellet. The analysis of chemical composition of the modified electrode was performed using an energy dispersive spectrometer (EDX).
2.2. Chemicals
All chemicals were of analytical reagent grade and purchased from Merck (Darmstadt, Germany) except otherwise stated. A stock solution of 0.01 mol L−1 was prepared by dissolving 0.0624 g of phenazopyridine hydrochloride (>99%) (from Sigma-Aldrich) in water and the solution was diluted to 25 mL with water in a 25 mL volumetric flask. Working solutions were prepared by dilution of the stock solution with deionized water.
Phosphate buffer solutions (0.10 mol L−1) with different pH values were used. Pure graphite powder (particle size <50 μm) and MWCNTs (>90% MWCNTs basis, with a diameter of 20–30 nm and a length of 5–15 μm) were prepared from Aldrich. High-viscosity paraffin (d = 0.88 kg L−1) was used for the preparation of the paste electrodes.
2.3. Preparation of ZnCrFeO4 magnetic nanoparticles
The synthesis of ZnCrFeO4 nanoparticles used for this study followed a method reported by Hamed et al.24 8.07 g Fe(NO3)3·9H2O, 5.94 g Zn(NO3)2·6H2O and 8.00 g Cr(NO3)3·9H2O were mixed with 100 mL methanol to form a sol, the mixed solution was adjusted to pH ∼ 9 by the ammonium hydroxide solution. After stirring the mixture for 20 min at 80 °C, stirring was continued for 24 hours at room temperature. The product was washed with double distilled water several times and dried at 60 °C. Then, heat treatment of the product was carried out for 1 hour at 700 °C, then for another 2 hours at 900 °C.
2.4. Preparation of MWCNTs/ZnCrFeO4 modified electrode
In order to prepare of MWCNTs/ZnCrFeO4 modified electrode, the mixture of 0.1 MWCNTs, 0.05 g ZnCrFeO4 and 0.8 g graphite powder were mixed together. Then diethyl ether was added and mixed to get a uniform mixture. After evaporation of diethyl ether, 0.2 g paraffin oil was added and the solid was mixed with mortar and pestle to obtain a uniformly wetted paste. The multi-walled carbon nanotubes/carbon-paste electrode (CNPE) was prepared in the same way but without adding ZnCrFeO4. The unmodified CPE was prepared by mixing fine graphite powder with the appropriate amount of paraffin (80![[thin space (1/6-em)]](https://www.rsc.org/images/entities/char_2009.gif) :20, w/w) and thorough hand mixing in a mortar and pestle. Finally, a portion of each wetted paste was inserted into a glass tube with a copper wire placed into the glass tube for electrical connection. After each experiment, a new surface was obtained by pushing an excess of the paste out of the tube and polishing with a weighing paper.
:20, w/w) and thorough hand mixing in a mortar and pestle. Finally, a portion of each wetted paste was inserted into a glass tube with a copper wire placed into the glass tube for electrical connection. After each experiment, a new surface was obtained by pushing an excess of the paste out of the tube and polishing with a weighing paper.
2.5. Real samples preparation
Urine samples were centrifuged (2000 rpm for 5 min) and supernatant was filtered using a 0.45 μm filter. Then, 1.0 mL of the sample solution plus 9.0 mL of 0.10 mol L−1 buffer (pH 2.0) were transferred into the cell to measure the phenazopyridine contents using the standard addition method.
Serum samples were obtained and stored frozen until the analysis. For preparation of serum samples, 1.0 mL of each sample was diluted to 10.0 mL in voltammetric flask by phosphate buffer solution (pH 2.0). Then, 5 mL of this solution was transferred to the voltammetric cell, were diluted to 10 mL with phosphate buffer solution. To this solution different amounts phenazopyridine were added and the recovery percent was obtained by DPV technique and standard addition method.
The pharmaceutical samples were chosen from phenazopyridine tablet (labeled 100 mg of phenazopyridine per tablet, Shahre Daru Laboratories Co.), was completely ground and homogenized, 45.0 mg of which was accurately weighed and dissolved with ultrasonication in 10 mL of water. Then, 200 μL of the solution plus 5 mL of the buffer (pH 2.0) was diluted with water in a 10 mL volume flask and the resulting solution was used for analysis. Then, the diluted sample solutions were placed in an electrochemical cell to determine their concentrations using the DPV method.
3. Results and discussion
3.1. Morphological characterization of ZnCrFeO4 nanoparticles
Fig. 1A shows characteristic peaks that occur at 2θ of 30.08°, 35.36°, 37.08°, 43.08°, 53.27°, 56.93° and 62.44° which are marked by their corresponding crystallographic planes (220), (311), (222), (400), (422), (511) and (440) respectively. XRD results confirmed that the ZnCrFeO4 (Cubic, JCPDS no. 43-0554) was obtained. Furthermore, there is additional phase, which may be attributed to form a little Fe3O4 (JCPDS no. 11-0614).
 |
| | Fig. 1 (A) XRD pattern of the ZnCrFeO4 nanoparticles, (B) FE-SEM image of ZnCrFeO4, and (C) FT-IR spectra of ZnCrFeO4 nanoparticles. | |
The crystallite size (D) of the ZnCrFeO4 sample was estimated using Scherrer's equation as follows:25,26
| |
 | (1) |
where
λ,
θ, and
β are the X-ray wavelength (0.154056 nm for Cu-K
α), Bragg diffraction angle, and the full width at half maximum of the diffraction peak (FWHM), respectively. In this calculation, we took the highest intensity peak (311). According to
eqn (1), the crystallite size of the synthesized ZnCrFeO
4 was calculated about 3 nm. The FE-SEM image of the product shows that the morphology of the sample is spherical and consist of agglomerated nanoparticles. According to the FE-SEM image a range of 48–108 nm in size are observed.
Fig. 1C, shows the FT-IR spectrum of ZnCrFeO4. The FT-IR spectra shows the three principles absorption bands of Fe3+–O2−, Cr3+–O2− and Zn2+–O2− located at around the range of 410, 490 and 615 cm−1, respectively, for all the calcined samples. These bonds are associated with ZnCrFeO4, and this indicates the formation of spinel ZnCrFeO4 nanocrystals, as suggested by previously published data.27,28 The peaks observed at around 3415 and 1544 cm−1 are ascribed due to the stretching modes and H–O–H bending vibration of the free or absorbed water molecules on the surface of the ZnCrFeO4.29 The absence of the peaks at 1000–1300 cm−1 and 2000–3000 cm−1 in the samples confirmed that the O–H mode and C–O mode stretching mode of organic sources in the calcined samples is not present.30
3.2. Electrochemical characterization of the modified electrode
Real surface area of the MWCNTs/ZnCrFeO4/CPE, MWCNTs/CPE and CPE were obtained by CV using 1 mM K3Fe(CN)6 as a probe at different scan rates. For a reversible process, the Randles–Sevcik formula has been used:| | |
Ipa = 2.69 × 10⁵n3/2AC0DR1/2ν1/2
| (2) |
where Ipa (A) refers to the anodic peak current, n the electron transfer number, A the surface area of the electrode, DR the diffusion coefficient, C0 (mol cm−3) the concentration of K3Fe(CN)6 and ν is the scan rate. For 1 mmol L−1 K3Fe(CN)6 in the 0.1 mol L−1 KCl electrolyte: n = 1 and DR = 7.6 × 10⁻⁶ cm2 s−1, then from the slope of the Ipa − ν1/2 relation, the real surface areas were calculated. The results showed that the electrode surface area was 0.0434 cm2 for the CPE, 0.2115 cm2 for the MWCNTs/CPE, and about 0.2690 cm2 for the MWCNTs/ZnCrFeO4/CPE. This means that the surface area for the MWCNTs/CPE and MWCNTs/ZnCrFeO4/CPE are 4.9 and 6.2 times, respectively, greater than that for the CPE. However, the increase in the peak current of the analyte at the surface of the MWCNTs/ZnCrFeO4/CPE is not only due to the surface area, but also due to the synergic effect of MWCNTs and ZnCrFeO4 nanoparticles on the oxidation of phenazopyridine at pH 2.0.
3.3. Electrochemical behavior of phenazopyridine at the surface of modified electrodes
Cyclic voltammograms of the phosphate buffer (pH 2.0) as an electrolyte were recorded on at the surface of (a) CPE, (b) ZnCrFeO4/CPE, (c) MWCNTs/CPE and (d) MWCNTs/ZnCrFeO4/CPE (Fig. 2A). Differential pulse voltammograms of the oxidation of 400.0 μM phenazopyridine at the surface of these different electrodes in 0.1 mol L−1 of PBS (pH = 2) are shown in Fig. 2B. As can be seen, the anodic peak potential for the oxidation of phenazopyridine at MWCNTs/ZnCrFeO4/CPE (curve h) and CNPE (curve g) is about 800 mV, while at the ZnCrFeO4/CPE (curve f) peak potential is about 780 mV, and at the CPE (curve e) peak potential is about 910 mV for phenazopyridine. In addition, when we compared the oxidation of phenazopyridine at the ZnCrFeO4/CPE (curve e) and MWCNTs/ZnCrFeO4/CPE (curve h), there is a dramatic enhancement of the anodic peak current at MWCNTs/ZnCrFeO4/CPE relative to the value obtained at the ZnCrFeO4/CPE. From these results, it is concluded that the best electrocatalytic effect for phenazopyridine oxidation is observed at MWCNTs/ZnCrFeO4/CPE (curve h).
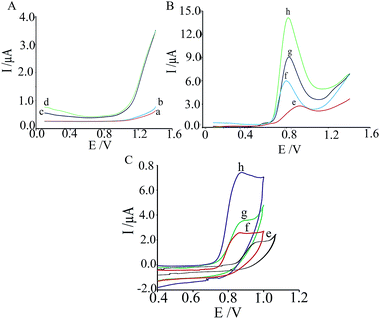 |
| | Fig. 2 (A) Differential pulse voltammograms of the blank solution at (a) CPE, (b) ZnCrFeO4/CPE, (c) CNPE, and (d) MWCNTs/ZnCrFeO4/CPE; (B) differential pulse voltammograms and (C) cyclic voltammograms of phenazopyridine (400.0 μmol L−1) at (e) CPE, (f) ZnCrFeO4/CPE, (g) CNPE, and (h) MWCNTs/ZnCrFeO4/CPE. DPV experimental conditions: pulse amplitude of 100 mV, pulse time of 50 ms, sweep rate of 50 mV s−1; phosphate buffer (0.1 mol L−1, pH 2.0). CV experiments: scan rate, 50 mV s−1. | |
The effect of scan rate on the anodic peak current of phenazopyridine at MWCNTs/ZnCrFeO4/CPE was also investigated. The results showed that by increasing the scan rate, the anodic peak current (Ipa) is gradually increased. A linear relationship between ν1/2 and Ipa at scan rates from 10 to 130 mV s−1 confirms a diffusion-controlled process on the modified electrode (R2 = 0.9957) (Fig. S2†).
To study the rate determining step, a Tafel plot was developed for MWCNTs/ZnCrFeO4/CPE using the data derived from the raising part of the current–voltage curve (Fig. 3). The slope of the Tafel plot is equal to 2.3RT/n(1 − α)F or to 0.1093 V decade−1. Using this data gives n(1 − α) = 0.54. If assuming n = 1, then α = 0.46.
 |
| | Fig. 3 Tafel plot for MWCNTs/ZnCrFeO4/CPE in 0.1 mol L−1 PBS (pH 2.0) with a scan rate of 10 mV s−1 in the presence of 100.0 μmol L−1 phenazopyridine. | |
3.4. Optimization of measurement conditions
Since DPV has a much higher sensitivity and resolution than CV, DPV was used for determination of phenazopyridine. The DPV parameters changed when the concentration of phenazopyridine was 400 μmol L−1. The results showed that the maximum peak current was obtained with a pulse height of 100 mV, a pulse time of 50 ms, and a voltage step time of 0.1 s. These values were selected for further study.
To optimize the composition of the electrode, several modified electrodes were prepared with different amount of ZnCrFeO4 and MWCNTs. When the amount of ZnCrFeO4 and MWCNTs were 0.05 and 0.1 g, respectively, the maximum signal was obtained. The results showed that a small quantity of this ZnCrFeO4, brought a low sensitivity in the determination phenazopyridine while overflowing mass of ZnCrFeO4 may lead to undesirable mechanical properties of CPE, which correspondingly decreased the electron transfer rate of modified electrode. Therefore, weight ratio 1:2 (the mass of ZnCrFeO4 to MWCNTs) was chosen for further study.
The influence of pH solution on the oxidation peak potential and peak current of phenazopyridine was investigated by DPV in the pH range 2.0–7.0. As shown in Fig. 4 it can be seen that the oxidation peak potential of phenazopyridine shifts negatively with rising pH demonstrating that deprotonation is involved in the oxidation process. The value of proton in the electrode reaction was estimated by:
| | |
Ep = E0 − 0.0590p/n pH
| (3) |
The plot of
Ep versus pH give a linear equation as:
Ep (V) = −0.0595 pH + 0.904. The slope of d
E/dpH indicates the number of electron and proton involved in electrochemical reaction is equal. As previously proven
19 the oxidation mechanism of phenazopyridine contains two electrons and two protons exchange (
Scheme 1).
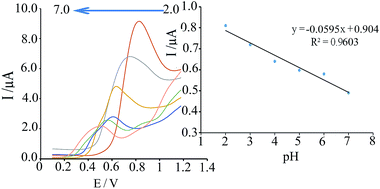 |
| | Fig. 4 Dependence of oxidation peak potential of phenazopyridine with pH at the modified CPE. | |
 |
| | Scheme 1 Mechanistic picture for the electrochemical oxidation of phenazopyridine at MWCNTs/ZnCrFeO4 carbon paste electrode. | |
3.5. SEM and electrochemical characterization of MWCNTs/ZnCrFeO4/CPE
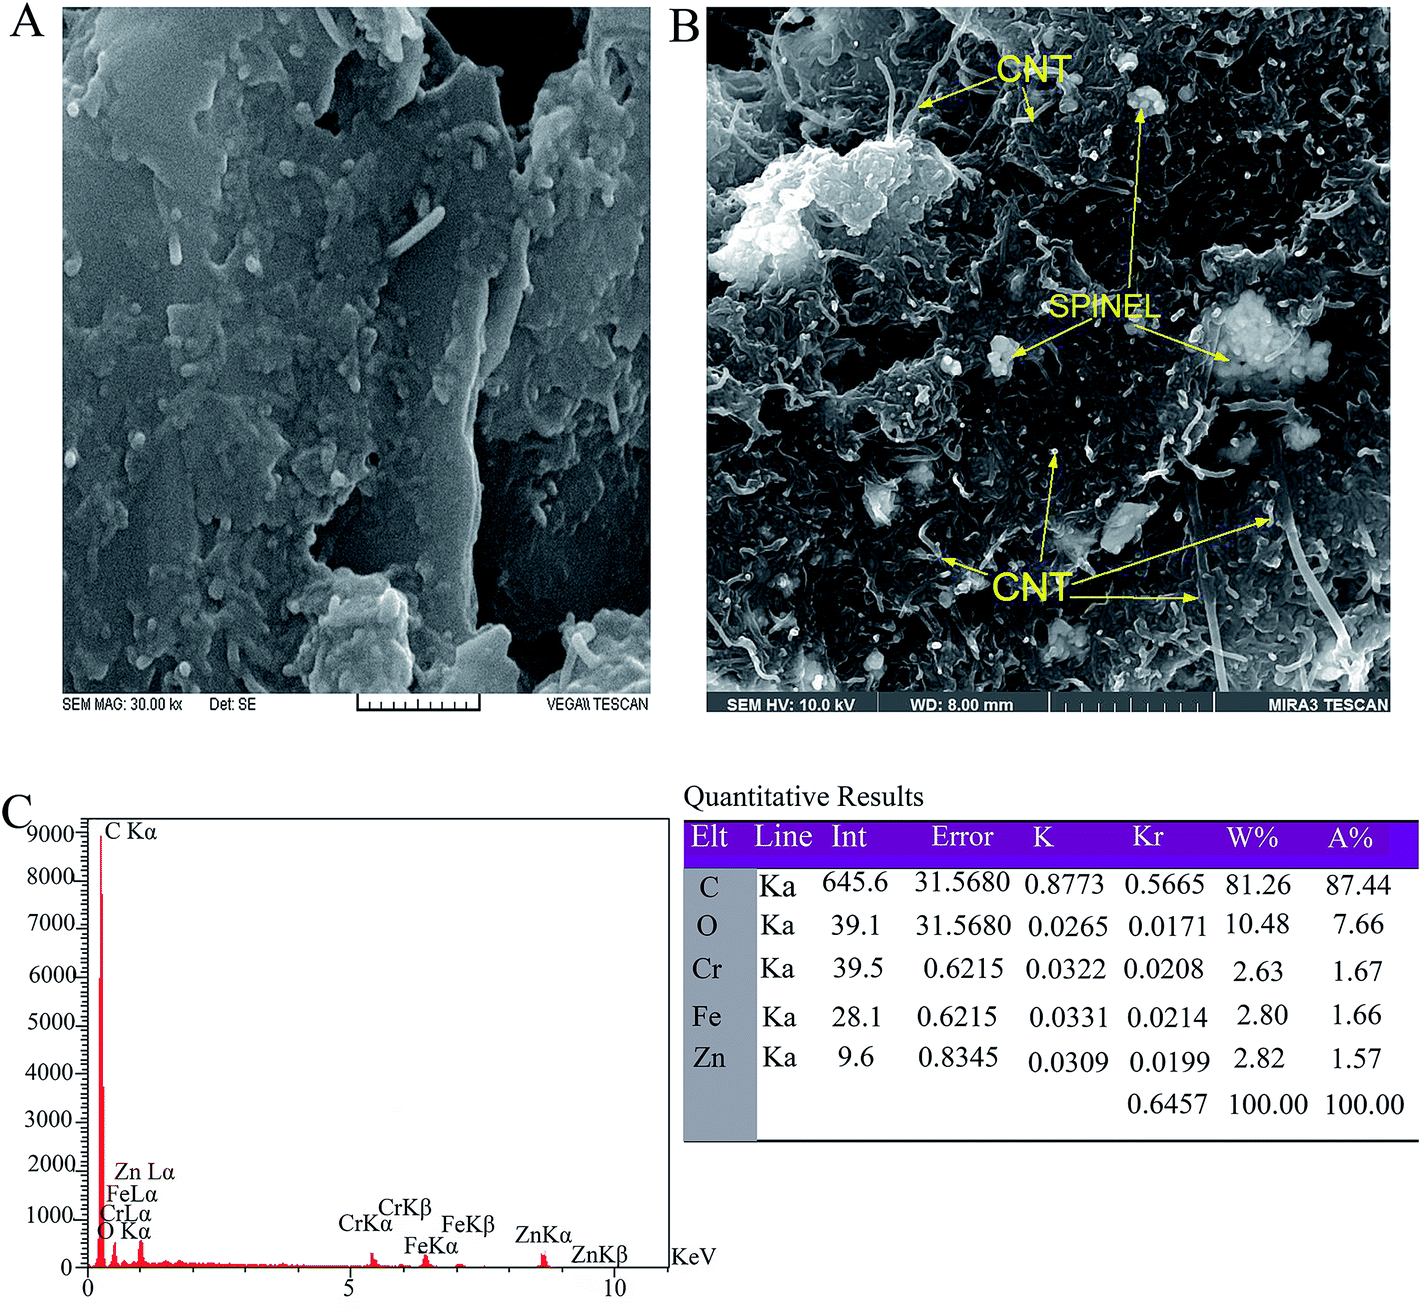
Fig. 5 shows the FE-SEM images of CNPE and MWCNTs/ZnCrFeO4/CPE. Significant differences in the surface structure of two electrodes were observed. These pictures show that the ZnCrFeO4 and also MWCNTs were distributed in the carbon paste and filled the pores between the graphite particles. It can increase the active surface area of the electrode and the electrooxidation current of phenazopyridine.
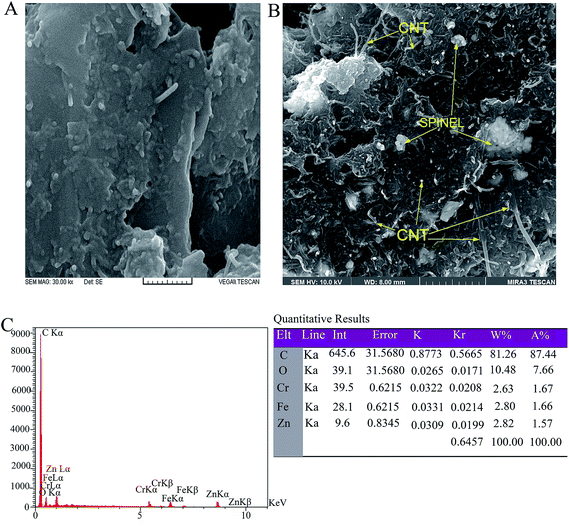 |
| | Fig. 5 SEM image of: (A) CNPE, (B) MWCNTs/ZnCrFeO4/CPE and (C) the corresponding EDX spectrum taken from the whole area of (B). | |
EIS is an effective probe to determine the electron transfer properties of the modified electrode. Fig. 6A exhibits the Nyquist plots of the CPE, ZnCrFeO4/CPE, MWCNTs/CPE and MWCNTs/ZnCrFeO4/CPE in 5.0 mmol L−1 [Fe(CN)6]3−/4− containing 0.1 M KNO3. The electron-transfer resistance (Rct) at the electrode surface was equal to the semicircle diameter of EIS and could be used to describe the interface properties of the electrode. At the bare CPE, a large semicircle with an approximate diameter of 650 Ω (Rct) was seen. This demonstrated that there was a very low electron-transfer rate between the electrochemical probe [Fe(CN)6]3−/4− and the CPE. At CNPE electrode, however, the Nyquist plots contained much smaller semicircle diameter of about 395.0 Ω (curve c) showing that the MWCNTs promoted conductivity. When ZnCrFeO4 added to the CNPE electrode, the Rct reduced to 60 Ω. From the impedance changes at the modified electrodes in Fig. 6A, it was confirmed that the ZnCrFeO4 magnetic nanoparticles was excellent electric conducting materials and make the electron transfer easier. The impedance changes are not only due to the surface area, but also due to the synergistic effect of ZnCrFeO4 and MWCNTs nanoparticles in electrochemical response of [Fe(CN)6]3−/4−.
 |
| | Fig. 6 (A) Impedance spectra; and (B) CVs of different electrodes in 5.0 mmol L−1 [Fe(CN)6]3−/4− containing 0.1 mol L−1 KNO3. Conditions: polarization potential: 0.15 V, frequency: 5.0 × 10 −3 to 105 Hz. CV measurement at scan rate of 100 mV s−1 between −0.20 and +0.90 V. | |
Cyclic voltammetry was also performed to characterize the modified electrode. The CV responses of [Fe(CN)6]3−/4− at the CPE and different modified electrodes were studied as shown in Fig. 6B. It can be seen that a pair of obvious redox peak with Ipa of 14.5 × 10⁻⁶ A at +0.38 V and Ipc of 14.2 × 10⁻⁶ A at +0.11 V appears at unmodified CPE. The peak currents of [Fe(CN)6]3−/4 at CNPE, increase and reach to Ipa of 20.4 × 10⁻⁶ A at +0.36 V and Ipc of 19.7 × 10⁻⁶ A at +0.09 V because of the large specific surface area and good conductivity of MWCNTs. However, the largest redox peaks (26.4 × 10⁻⁶ A at 0.38 V and Ipc of 25.4 × 10⁻⁶ A at +0.07 V) indicate that the synchronous introduction of MWCNTs and ZnCrFeO4 would amplify the peak current of [Fe(CN)6]3−/4− compared with CPE, CNPE and ZnCrFeO4/CPE. This could be ascribed to the effective integration of individual advantages of MWCNTs and ZnCrFeO4 nanocomposite such as large surface area, good catalytic activity and excellent electronic conductivity. In general, CV measurements and EIS techniques showed that nano modifiers cause a decrease in the surface impedance of carbon paste electrode. In fact, the nonporous coating of the surface of modified electrode made the oxidation current of [Fe(CN)6]3−/4− increase clearly.
3.6. Chronoamperometric studies
Single step potential chronoamperometry was applied for determination of the rate constants of homogeneous chemical reactions and diffusion coefficient of phenazopyridine. The potential of 0.80 V was inserted to MWCNTs/ZnCrFeO4/CPE working electrode vs. Ag|AgCl|KClsat in aqueous buffered solutions (pH 2.0). The linearity of electrocatalytic current vs. ν1/2 proved this current is controlled by Cottrellian behavior. Therefore, the slope of the linear region of Cottrell's plot can be used to estimate the diffusion coefficient of phenazopyridine. A plot of I versus t−1/2 for different concentration of phenazopyridine (in the ranges of 0.5 to 1.2 mmol L−1) given a straight line and the slope of such lines can be used to estimate the diffusion coefficient of phenazopyridine. The mean value of the D found to be 5.23 × 10⁻⁶ cm2 s1.
The rate constant for the chemical reaction between phenazopyridine and redox sites in MWCNTs/ZnCrFeO4/CPE, Kh, can be evaluated by chronoamperometry:32
| | |
IC/IL = π1/2γ1/2 = π1/2(KhCbt)1/2
| (4) |
where
IC is the catalytic current of MWCNTs/ZnCrFeO
4/CPE in the presence of 1.0 mmol L
−1 phenazopyridine,
IL is the limited current in the absence of phenazopyridine and
γ =
KhCbt (
Cb is the bulk concentration of phenazopyridine, mol cm
−3) is the argument of error function. The
Kh and
t are the catalytic rate constant (cm
3 mol
−1 s
−1) and time elapsed (s), respectively. From the slope of
IC/
IL versus t1/2 plot the value of
Kh can be simply calculated for a given concentration of the substrate. The
Kh was calculated as 6.48 × 10
2 cm
3 mol
−1 s
−1 using the slope of
IC/
IL −
t1/2 plot that explains the sharp feature of the catalytic peak observed for oxidation of phenazopyridine at the surface of MWCNTs/ZnCrFeO
4/CPE (Fig. S3 & Fig. S4
†).
3.7. Stability and reproducibility of the sensor
The stability of MWCNTs/ZnCrFeO4/CPE was checked out by CV using 100 μmol L−1 phenazopyridine. When the modified electrode was stored in the laboratory, the anodic peak current retained to 93% of its initial value after a week and 91% after 25 days. The reproducibility of the modified electrode was investigated by comparing the current of DPV response to phenazopyridine at six modified electrodes prepared independently. The relative standard deviation (RSD) of 3.6% was obtained at phenazopyridine concentration of 100 μmol L−1. The repeatability of MWCNTs/ZnCrFeO4/CPE was investigated by measuring relative standard deviation (RSD%) of ten successive assays of 100 μmol L−1 phenazopyridine. The oxidation current was almost unchanged and RSD of 2.7% was observed. These results indicate that MWCNTs/ZnCrFeO4/CPE has a good stability, repeatability and reproducibility.
4. Calibration curve and detection limit
DPV was used for determination of phenazopyridine concentration in aqueous solutions with optimum conditions. Results showed a linear segment for phenazopyridine concentration; namely, for 0.3 to 625.0 μmol L−1 of phenazopyridine, the regression equation was ΔIp (μA) = (0.0255 ± 0.001)C + (1.2122 ± 0.20)(R2 = 09926, n = 5) (Fig. 7), where C concentration is in μmol L−1. The detection limit (defined as 3sb/m where sb is the standard deviation of the blank signal (n = 10) and m is the slope of the calibration curve) was found to be 0.02 μmol L−1.
 |
| | Fig. 7 The calibration curve for the determination of phenazopyridine based on oxidation signal of phenazopyridine at MWCNTs/ZnCrFeO4/CPE. Inset: DPVs of 0.3, 4.0, 46.0, 78.0, 160.0, 189.0, 287.0, 321.0, 390.0, 422.0, 511.0, 564.0, 593.0 and 625.0 μmol L−1 MWCNTs/ZnCrFeO4/CPE in phosphate buffer solution (0.1 mol L−1 at pH 2.0). | |
5. Interference study
Analytical selectivity is one of the important parameters that affect the accuracy of the analysis. In order to evaluate the selectivity of the proposed method for the determination of phenazopyridine, the influence of various foreign species on the determination of 50.0 μmol L−1 phenazopyridine was investigated. The tolerance limit was defined as the maximum concentration of the interfering substance yielding a relative error less than 5% of the oxidation signal of phenazopyridine. The results are presented in Table 2. Cysteine at more than 100-fold interfered because it oxidized at the electrode surface, near the phenazopyridine peak potential. Despite its interference, it isn't present at significant levels in the urine and serum samples. These results confirm that no interference could be observed for the tested compounds such as different cations, anions and organic compounds (Fig. S5†).
Table 2 Interference study for the determination of 50.0 μmol L−1 phenazopyridine under the optimized conditions
| Species |
Tolerance limit (molSubstance/molPhenaopyridine) |
| Maximum concentration of the substances used. |
| Na+, Cl−, F−, Ca2+, K+, NO3−, Mg+2, ClO4−, histidine |
1000a |
| SO42−, ascorbic acid, methionine, uric acid, glucose |
400 |
| Fructose, sucrose, lactose, urea, aspartic acid, glycine, epinephrine |
200 |
| Citric acid, cysteine |
100 |
6. Analytical applications
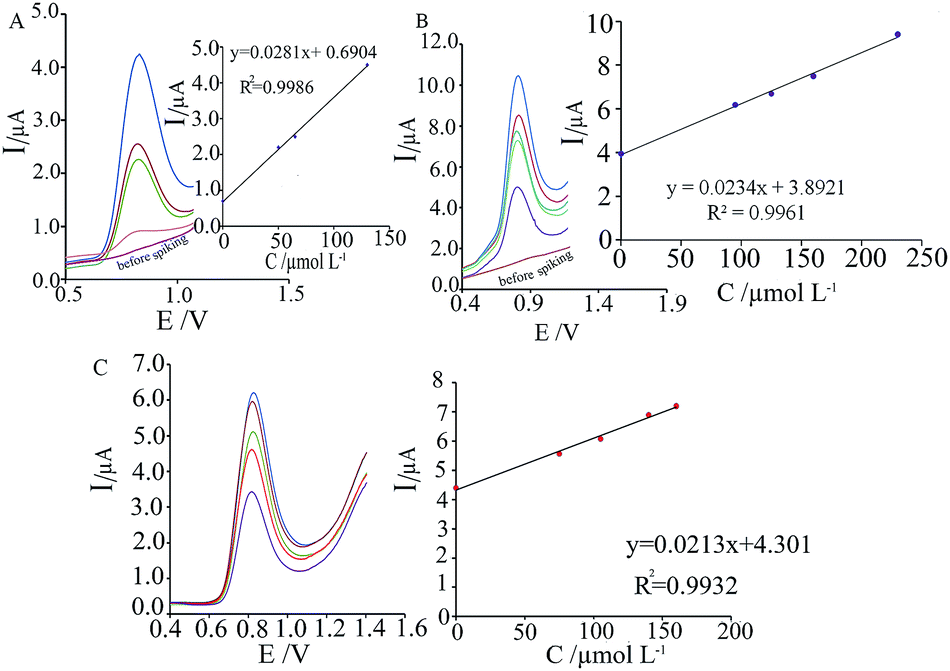
To evaluate the ability of the proposed sensor in real sample analysis, tablet, human plasma and urine samples were prepared and analyzed. Standard addition method was used for measuring the phenazopyridine contents in the samples. According to the obtained results, a good agreement can be seen between the proposed method and the standard method.33 The data, given in Table 3, show the satisfactory results and confirm the capability of the modified CPE for voltammetric determination of phenazopyridine in real samples. Representative DPVs for determination of phenazopyridine under optimized conditions in real samples with standard addition method were also illustrated in Fig. 8.
Table 3 Determination of phenazopyridine in real samples
| Real sample |
Added (μmol L−1) |
Proposed method (μmol L−1) |
Recovery (%) |
Relative error (%) |
Standard method (μmol L−1) |
Fexp. |
Ftab.(0.05);4,4 |
Spooled |
texp. |
ttab.(98%) |
| phenazopyridine tablet (labeled 100 mg of phenazopyridine per tablet, Shahre Daru Laboratories Co.). |
| Urine 1 |
— |
<Limit of detection |
— |
— |
<Limit of detection |
|
|
|
|
|
| 30.0 |
30.8(±2.00) |
102.7 |
+2.70 |
29.87(±3.4) |
2.89 |
9.6 |
2.79 |
0.53 |
3.75 |
| 100.0 |
119.4(±4.30) |
91.8 |
−8.15 |
— |
|
|
|
|
|
| Urine 2 |
— |
<Limit of detection |
— |
— |
<Limit of detection |
|
|
|
|
|
| 170.0 |
170.5(±4.6) |
100.3 |
+0.30 |
168.4(±4.4) |
1.09 |
9.6 |
4.50 |
0.75 |
3.75 |
| 40.0 |
212.7(±6.3) |
101.3 |
+1.28 |
— |
|
|
|
|
|
| Serum 1 |
— |
<Limit of detection |
— |
— |
<Limit of detection |
|
|
|
|
|
| 25.0 |
24.20(±0.80) |
96.8 |
−3.20 |
24.3(±0.7) |
1.31 |
9.6 |
0.75 |
0.21 |
3.75 |
| 100.0 |
118.7(±4.1) |
95.0 |
−5.04 |
— |
|
|
|
|
|
| 50.0 |
167.8(±3.30) |
95.9 |
−4.11 |
— |
|
|
|
|
|
| Serum 2 |
— |
<Limit of detection |
— |
— |
<Limit of detection |
|
|
|
|
|
| 450.0 |
425.6(±7.32) |
94.6 |
−5.42 |
440.4(±6.1) |
1.44 |
9.6 |
6.73 |
3.49 |
3.75 |
| 30.0 |
487.4(±12.2) |
101.5 |
+1.54 |
— |
|
|
|
|
|
| 70.0 |
543.4(±7.3) |
98.8 |
−1.20 |
— |
|
|
|
|
|
| Tableta |
— |
202.70(±3.40) |
— |
— |
200.7(±3.8) |
1.25 |
9.6 |
3.6 |
0.88 |
3.75 |
| 80.0 |
276.4(±7.73) |
98.2 |
−1.81 |
— |
|
|
|
|
|
| 300.0 |
543.6(±10.87) |
93.5 |
−6.51 |
— |
|
|
|
|
|
 |
| | Fig. 8 Determination phenazopyridine in real samples. Spiked plasma sample with the corresponding standard addition plot (A). Spiked urine sample with the corresponding standard addition plot (B) and phenazopyridine tablet sample with corresponding standard addition plot. Pulse amplitude of 100 mV, pulse time of 50 ms, sweep rate of 50 mV s−1; phosphate buffer (0.1 mol L−1, pH 2.0). | |
7. Conclusions
A new sensor has been successfully fabricated using MWCNTs/ZnCrFeO4 modified carbon paste electrode. The excellent conductivity of ZnCrFeO4 makes a modified electrode as a suitable mediator in the determination of phenazopyridine. The results showed that the oxidation of phenazopyridine is catalyzed at pH 2.0, where the peak potential of phenazopyridine is shifted by 110 mV toward negative values at the surface of the modified electrode compared to unmodified CPE. The modified electrode has been shown to be promising for the detection of phenazopyridine with many desirable properties including good reproducibility, high sensitivity, wide dynamic range, excellent catalytic activity, low detection limit, and especially its antifouling properties towards phenazopyridine and its oxidation products. The DPV peak current is increased linearly with the concentration of phenazopyridine in the range of 0.3–625.0 μmol L−1 with a very low detection limit of 0.02 μmol L−1. The value of Kh and α were found to be 6.48 × 102 cm3 mol−1 s−1 and 0.46, respectively. The reliability and fast analytical determination of phenazopyridine on the surface of MWCNTs/ZnCrFeO4/CPE offered a good ability for applying this electrode to routine analysis in biological samples such as urine and plasma.
References
- S. Iijima, Nature, 1991, 354, 56 CrossRef CAS.
- W. Z. Li, S. S. Xie, L. X. Qian, B. H. Chang, B. S. Zou, W. Y. Zhou, R. A. Zhao and G. Wang, Science, 1996, 274, 1701 CrossRef CAS.
- M. M. Treachy, T. W. Ebbesen and J. M. Gibson, Nature, 1996, 381, 678 CrossRef.
- A. A. Ensafi and H. Karimi-Maleh, J. Electroanal. Chem., 2010, 640, 75–83 CrossRef CAS PubMed.
- H. Beitollahi, H. Karimi-Maleh and H. Khabazzadeh, Anal. Chem., 2008, 80, 9848 CrossRef CAS PubMed.
- B. Habibi and M. H. Pournaghi-Azar, Electrochim. Acta, 2010, 55, 5492 CrossRef CAS PubMed.
- B. Habibi, M. Jahanbakhshi and M. H. Pournaghi-Azar, Electrochim. Acta, 2011, 56, 2888 CrossRef CAS PubMed.
- B. Habibi, M. Jahanbakhshi and M. H. Pournaghi-Azar, Anal. Biochem., 2011, 411, 167 CrossRef CAS PubMed.
- B. Habibi, M. Abazari and M. H. Pournaghi-Azar, Chin. J. Catal., 2012, 33, 1783 CrossRef CAS.
- M. Mazloum-Ardakani, H. Beitollahi, B. Ganjipour and H. Naeimi, Int. J. Electrochem. Sci., 2010, 5, 531 CAS.
- A. A. Ensafi, M. Taei, T. Khayamian and F. Hasanpour, Anal. Sci., 2010, 26, 803 CrossRef CAS.
- S. M. Halvorsen and W. L. Dull, Am. J. Med., 1991, 91, 315 CrossRef CAS.
- B. A. Meyer, B. Gonik and R. K. Creasy, Am. J. Perinatol., 1991, 8, 297 CrossRef CAS PubMed.
- P. Surmann and P. Aswakun, Arch. Pharm., 1985, 8, 14 CrossRef PubMed.
- S. M. Sabry, Talanta, 1999, 50, 133 CrossRef CAS.
- S. Yağmur and S. Yilmaz, GU J. Sci., 2012, 25, 53 Search PubMed.
- A. A. Ensafi, B. Arashpour, B. Rezaei and A. R. Allafchian, Colloids Surf., B, 2013, 111, 270 CrossRef CAS PubMed.
- S. Yagmur, S. Yilmaz, M. Sadikoglu, G. Saglikoglu, M. Yildiz, C. Yengin and E. Kilinc, Int. J. Electrochem. Sci., 2013, 8, 6818 CAS.
- M. Cıtak, S. Yilmaz, Y. Dilgin, G. Turker, S. Yagmur, H. Erdugan and N. Erdugan, Curr. Pharm. Anal., 2007, 3, 141 CrossRef.
- P. Vijaybhaskar and A. Ramachandraiah, J. Chem., 2009, 6, 1181 CAS.
- C. Demirtas, S. Yilmaz, G. Saglikoglu and M. Sadikoglu, Int. J. Electrochem. Sci., 2015, 10, 1883 CAS.
- F. Belal, J. AOAC Int., 1997, 127, 1207 Search PubMed.
- M. N. Vora and K. Maheswaran, Indian J. Pharm., 1976, 38, 98 CAS.
- A. Hamed, A. G. Fitzgerald, L. Wang, M. Gueorguieva, K. Malik and A. Melzer, Mater. Sci. Eng., C, 2013, 33, 1623 CrossRef CAS PubMed.
- L. Han, X. Zhou, L. Wan, Y. Deng and S. Zhan, J. Environ. Chem., 2014, 2, 123 CrossRef CAS PubMed.
- P. K. Harold and E. A. Leroy, X-ray Diffraction Procedures: for Polycrystalline and Amophous Materials, Wiley, New York, 1974 Search PubMed.
- R. P. Patil, S. D. Delekar, D. R. Mane and P. P. Hankare, Results Phys., 2013, 3, 129 CrossRef PubMed.
- W. Konicki, D. Sibera, E. Mijowska, Z. Lendzion-Bieluń and U. Narkiewicz, J. Colloid Interface Sci., 2013, 398, 152 CrossRef CAS PubMed.
- I. Sharifi and H. Shokrollahi, J. Magn. Magn. Mater., 2012, 324, 2397 CrossRef CAS PubMed.
- M. Stefanescu, M. Barbu, T. Vlase, P. Barvinschi, L. Barbu-Tudoran and M. Stoia, Thermochim. Acta, 2011, 526, 130 CrossRef CAS PubMed.
- S. Yagmur, S. Yilmaz, M. Sadikoglu, G. Saglikoglu, M. Yildiz, C. Yengin and E. Kilinc, Int. J. Electrochem. Sci., 2013, 8, 6818 CAS.
- Z. Galus, Fundamentals of Electrochemical Analysis, Ellis Horwood, New York, 1976 Search PubMed.
- B. J. Beck, S. M. Duverneuil and A. Owens, The United States Pharmacopeia (USP 28) and The National Formulary 23, Pharmacopeial convention Inc., U. S. A., 2005, pp. 1523–1524 Search PubMed.
Footnote |
| † Electronic supplementary information (ESI) available. See DOI: 10.1039/c5ra05598a |
|
| This journal is © The Royal Society of Chemistry 2015 |
Click here to see how this site uses Cookies. View our privacy policy here.